2 Heart Failure Genomic Locus Characterisation
The following sets of figures provide a locus-level summary of 66 conditionally independent genetic loci associated with one or more HF phenotypes identified from the HERMES Consortium GWAS meta-analysis.
Each set represents one locus, and contains the following panels:
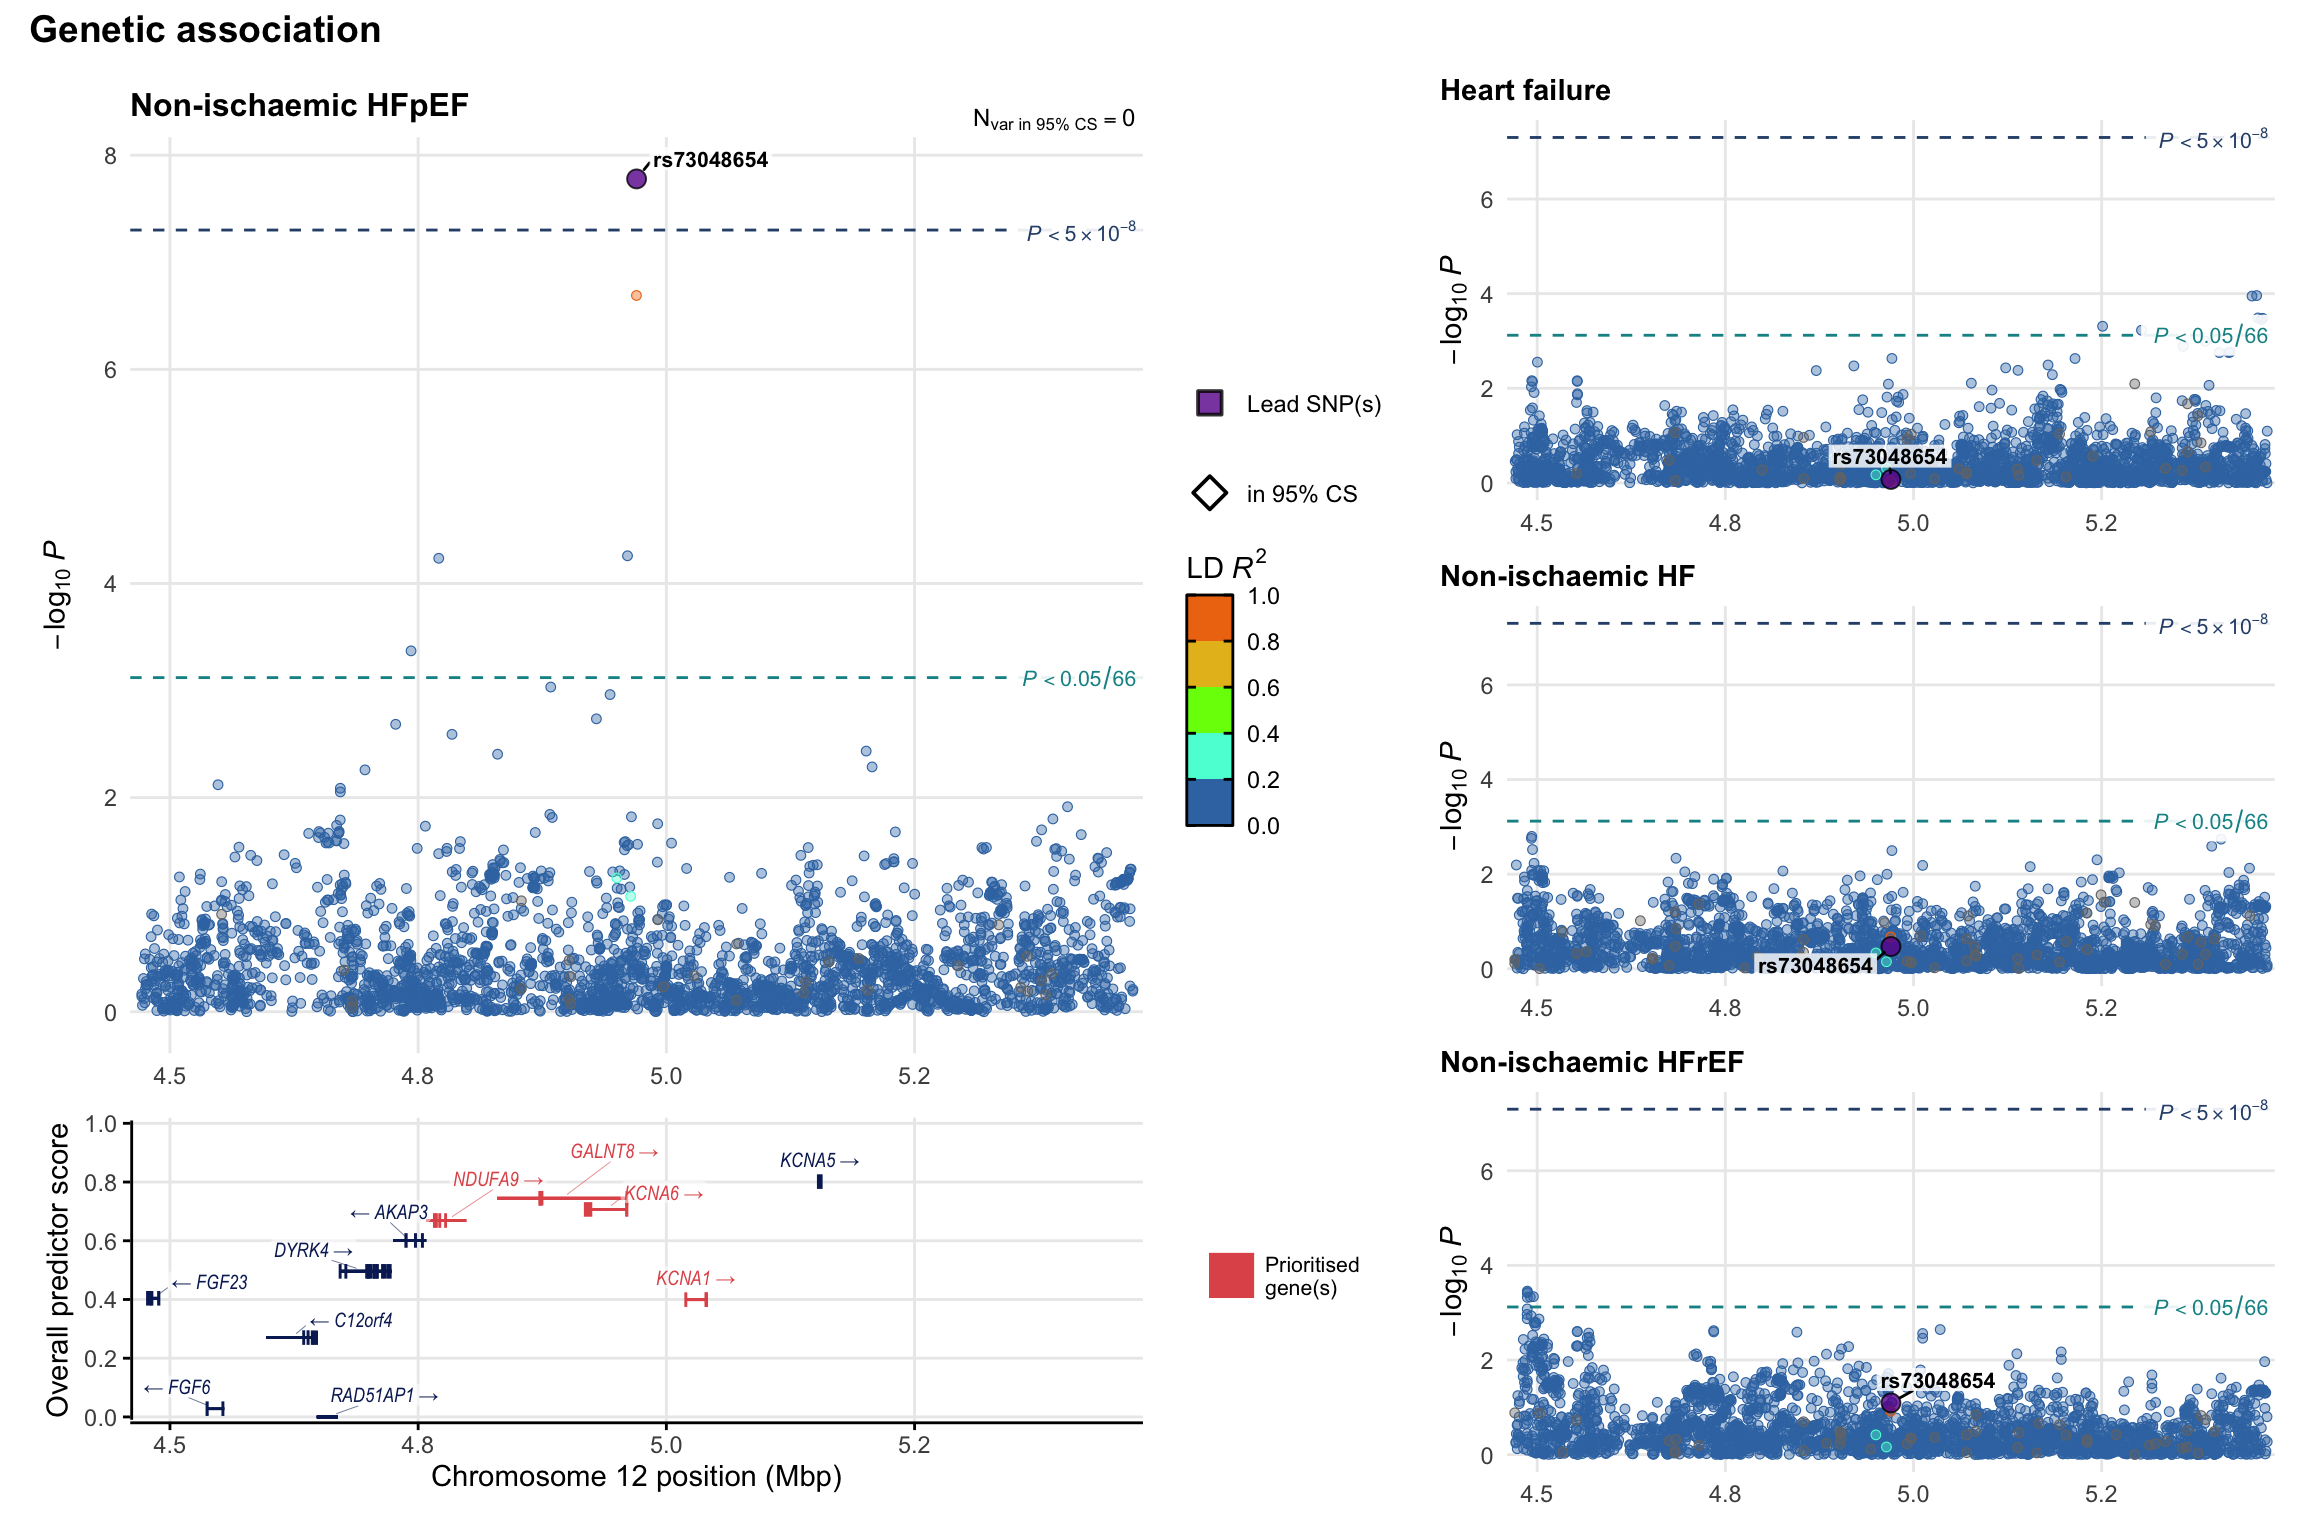
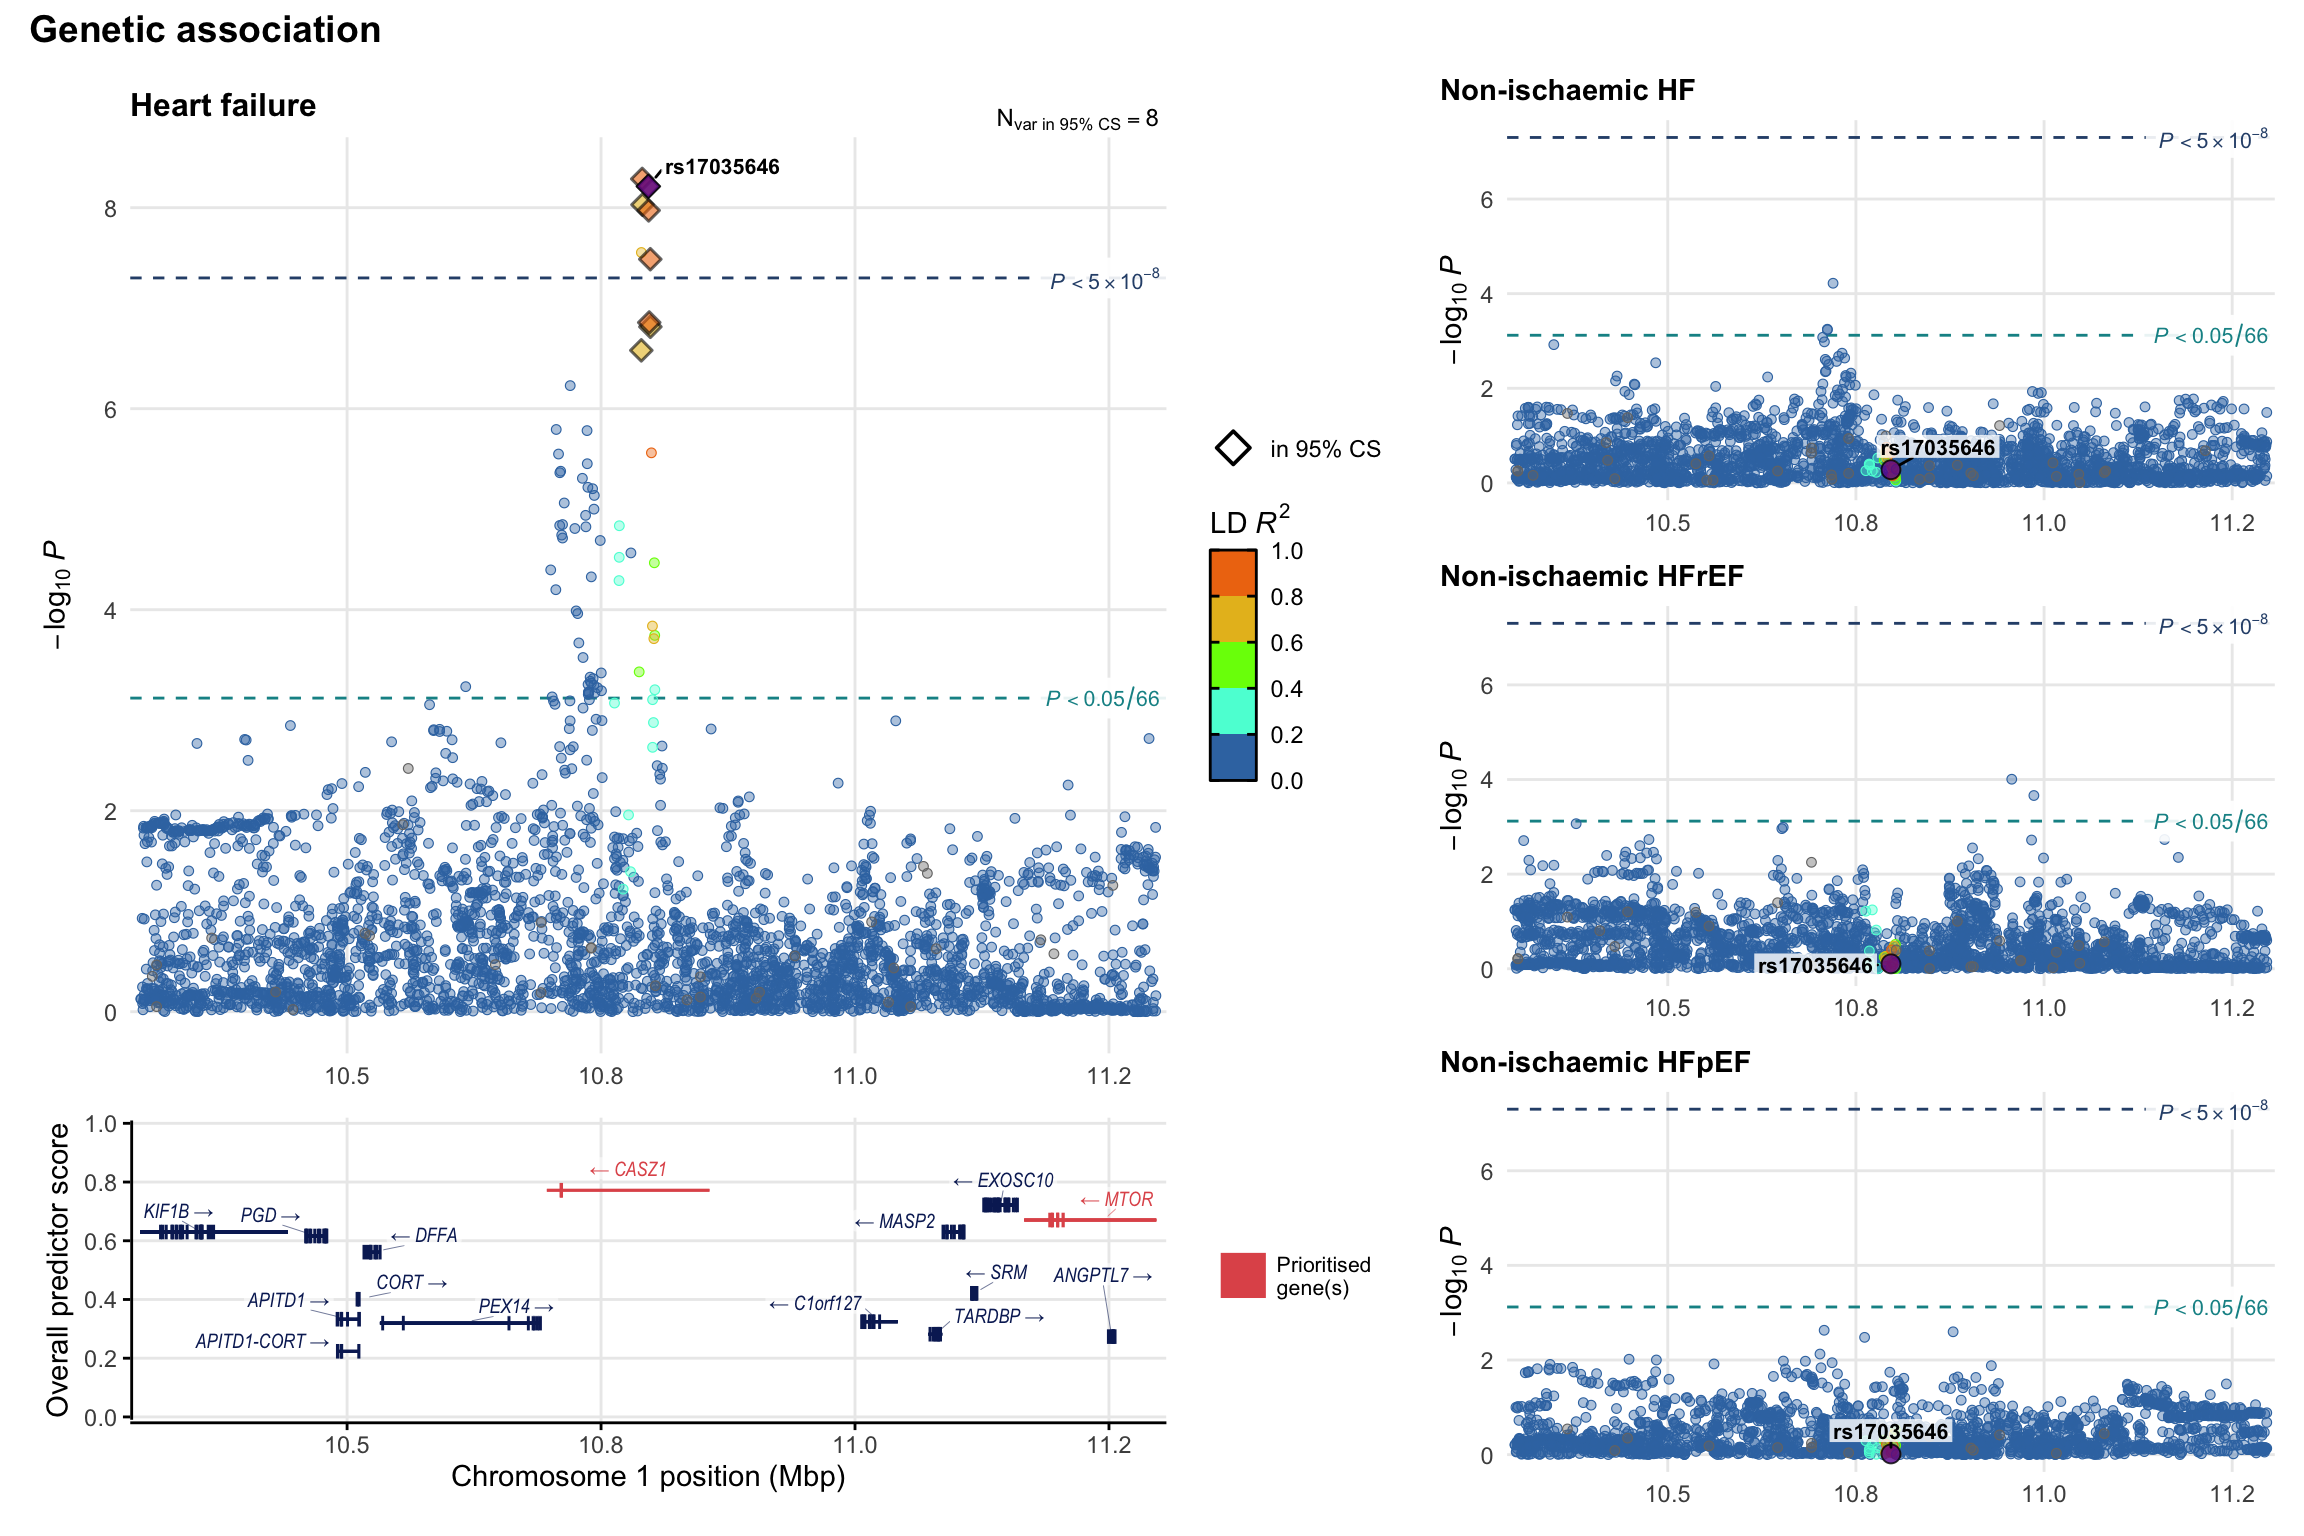
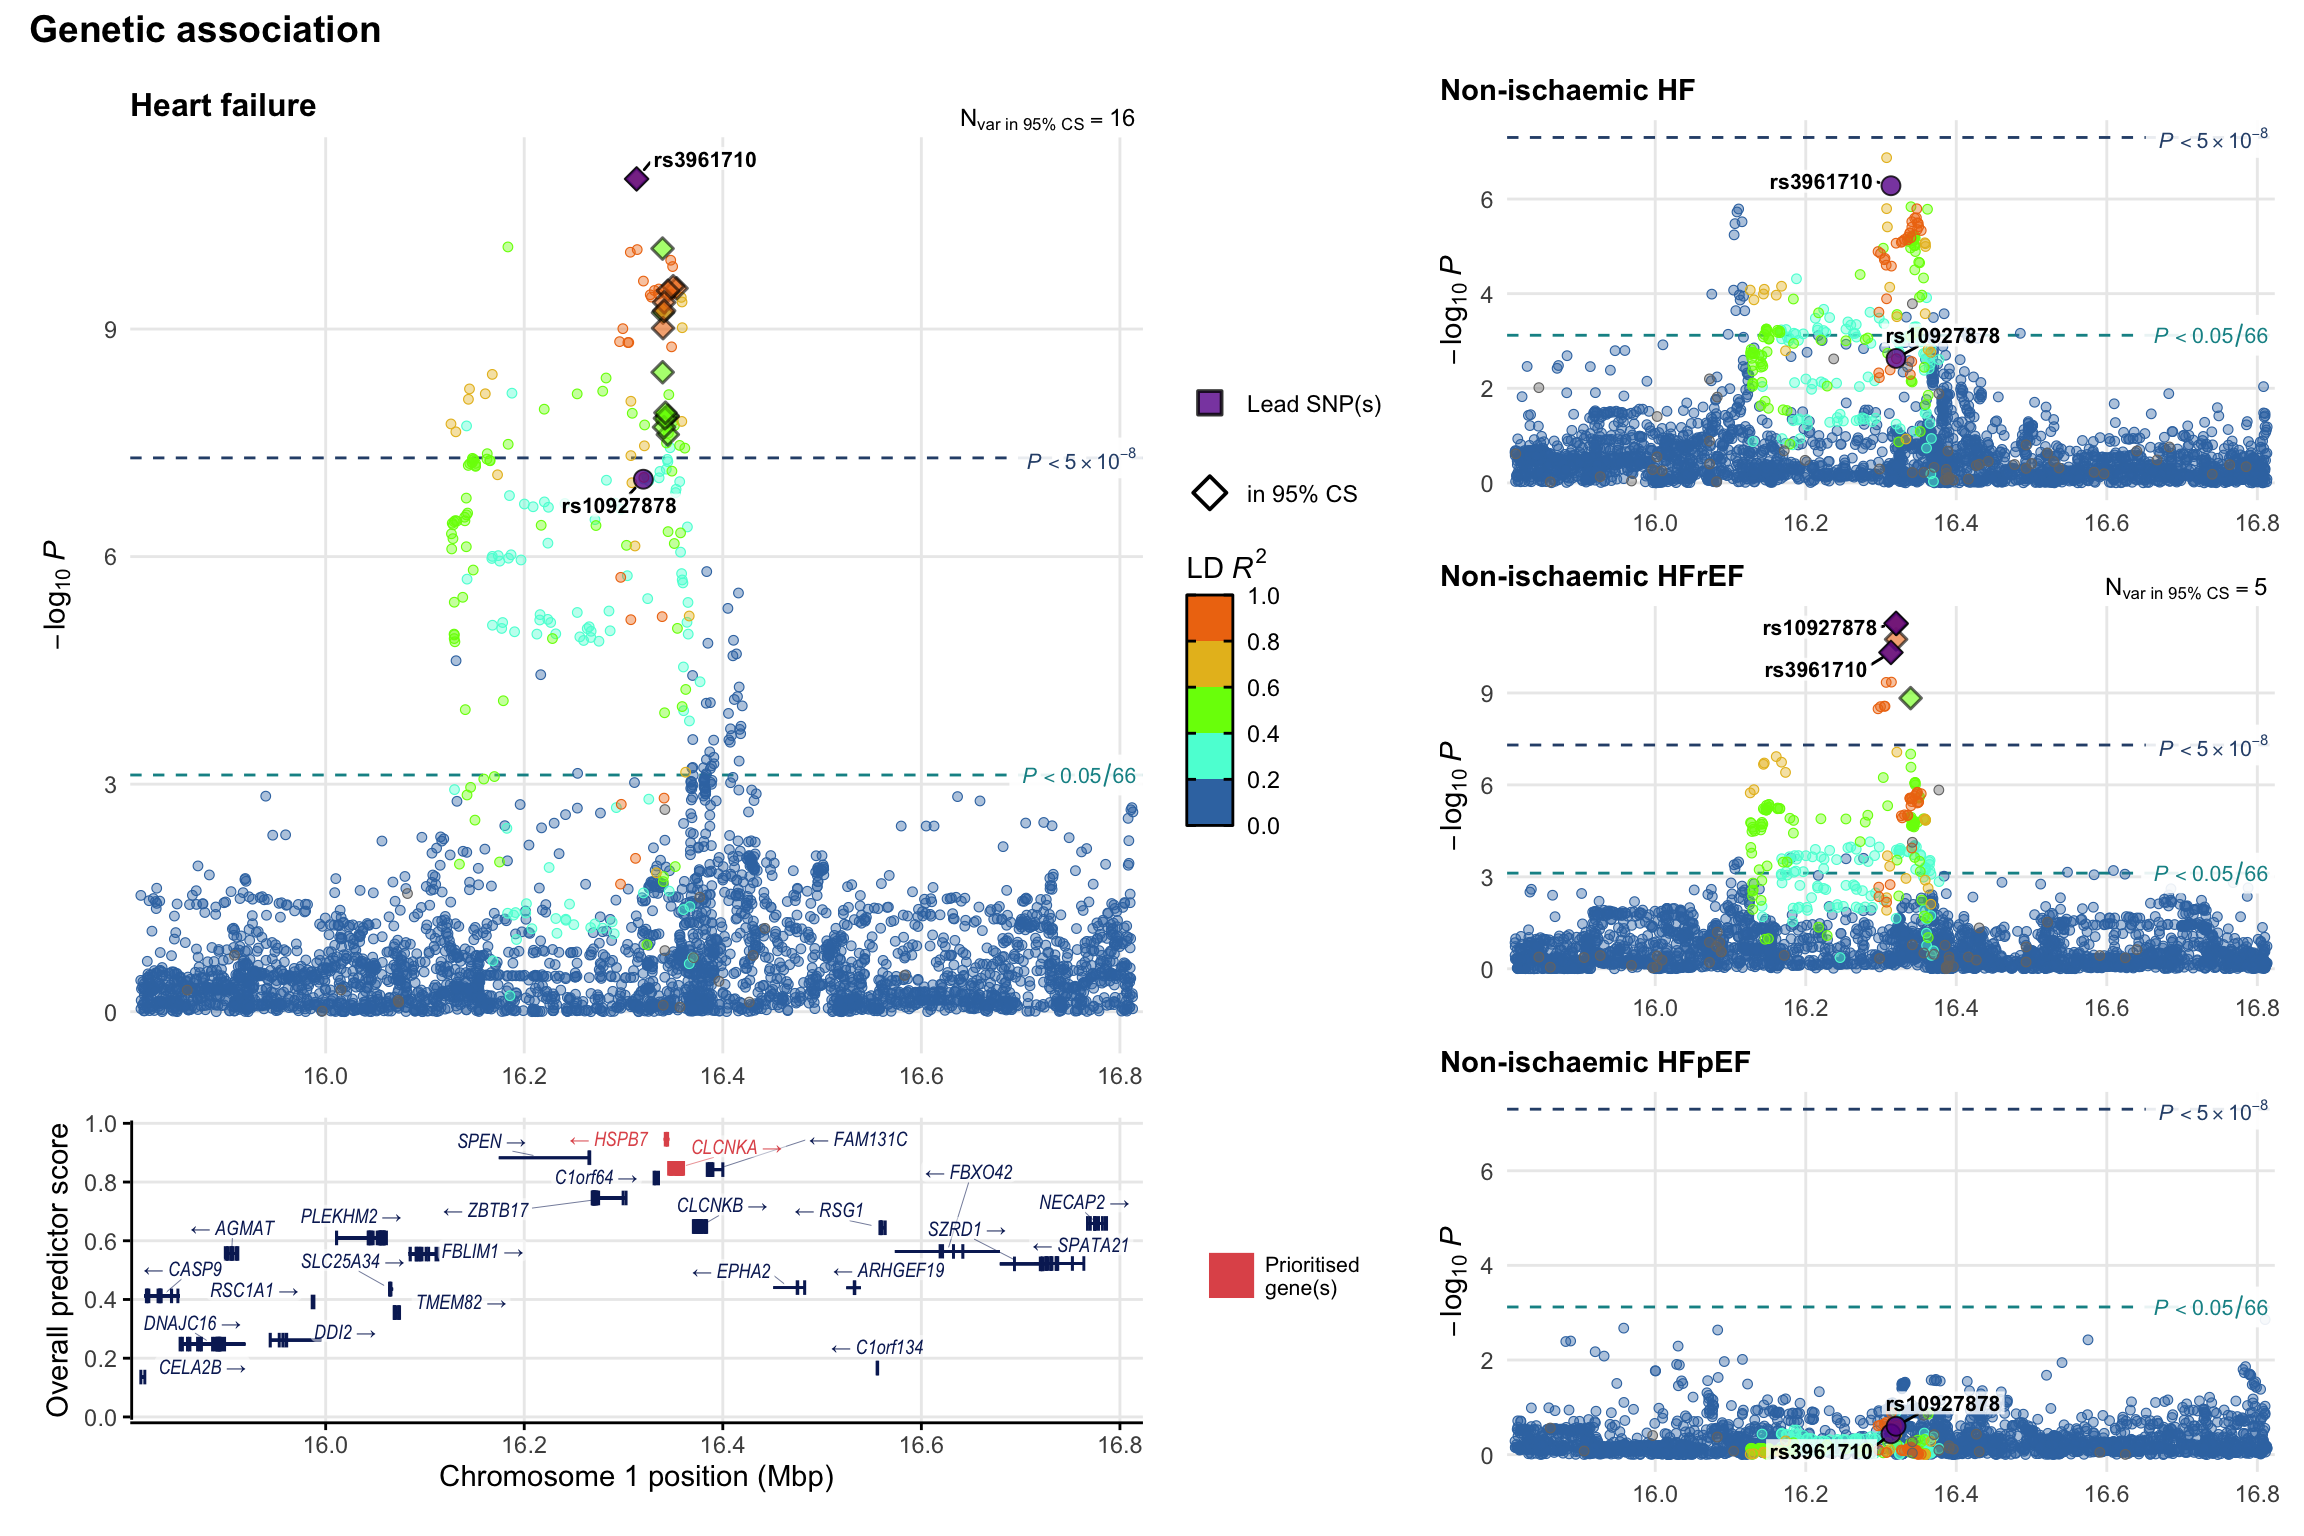
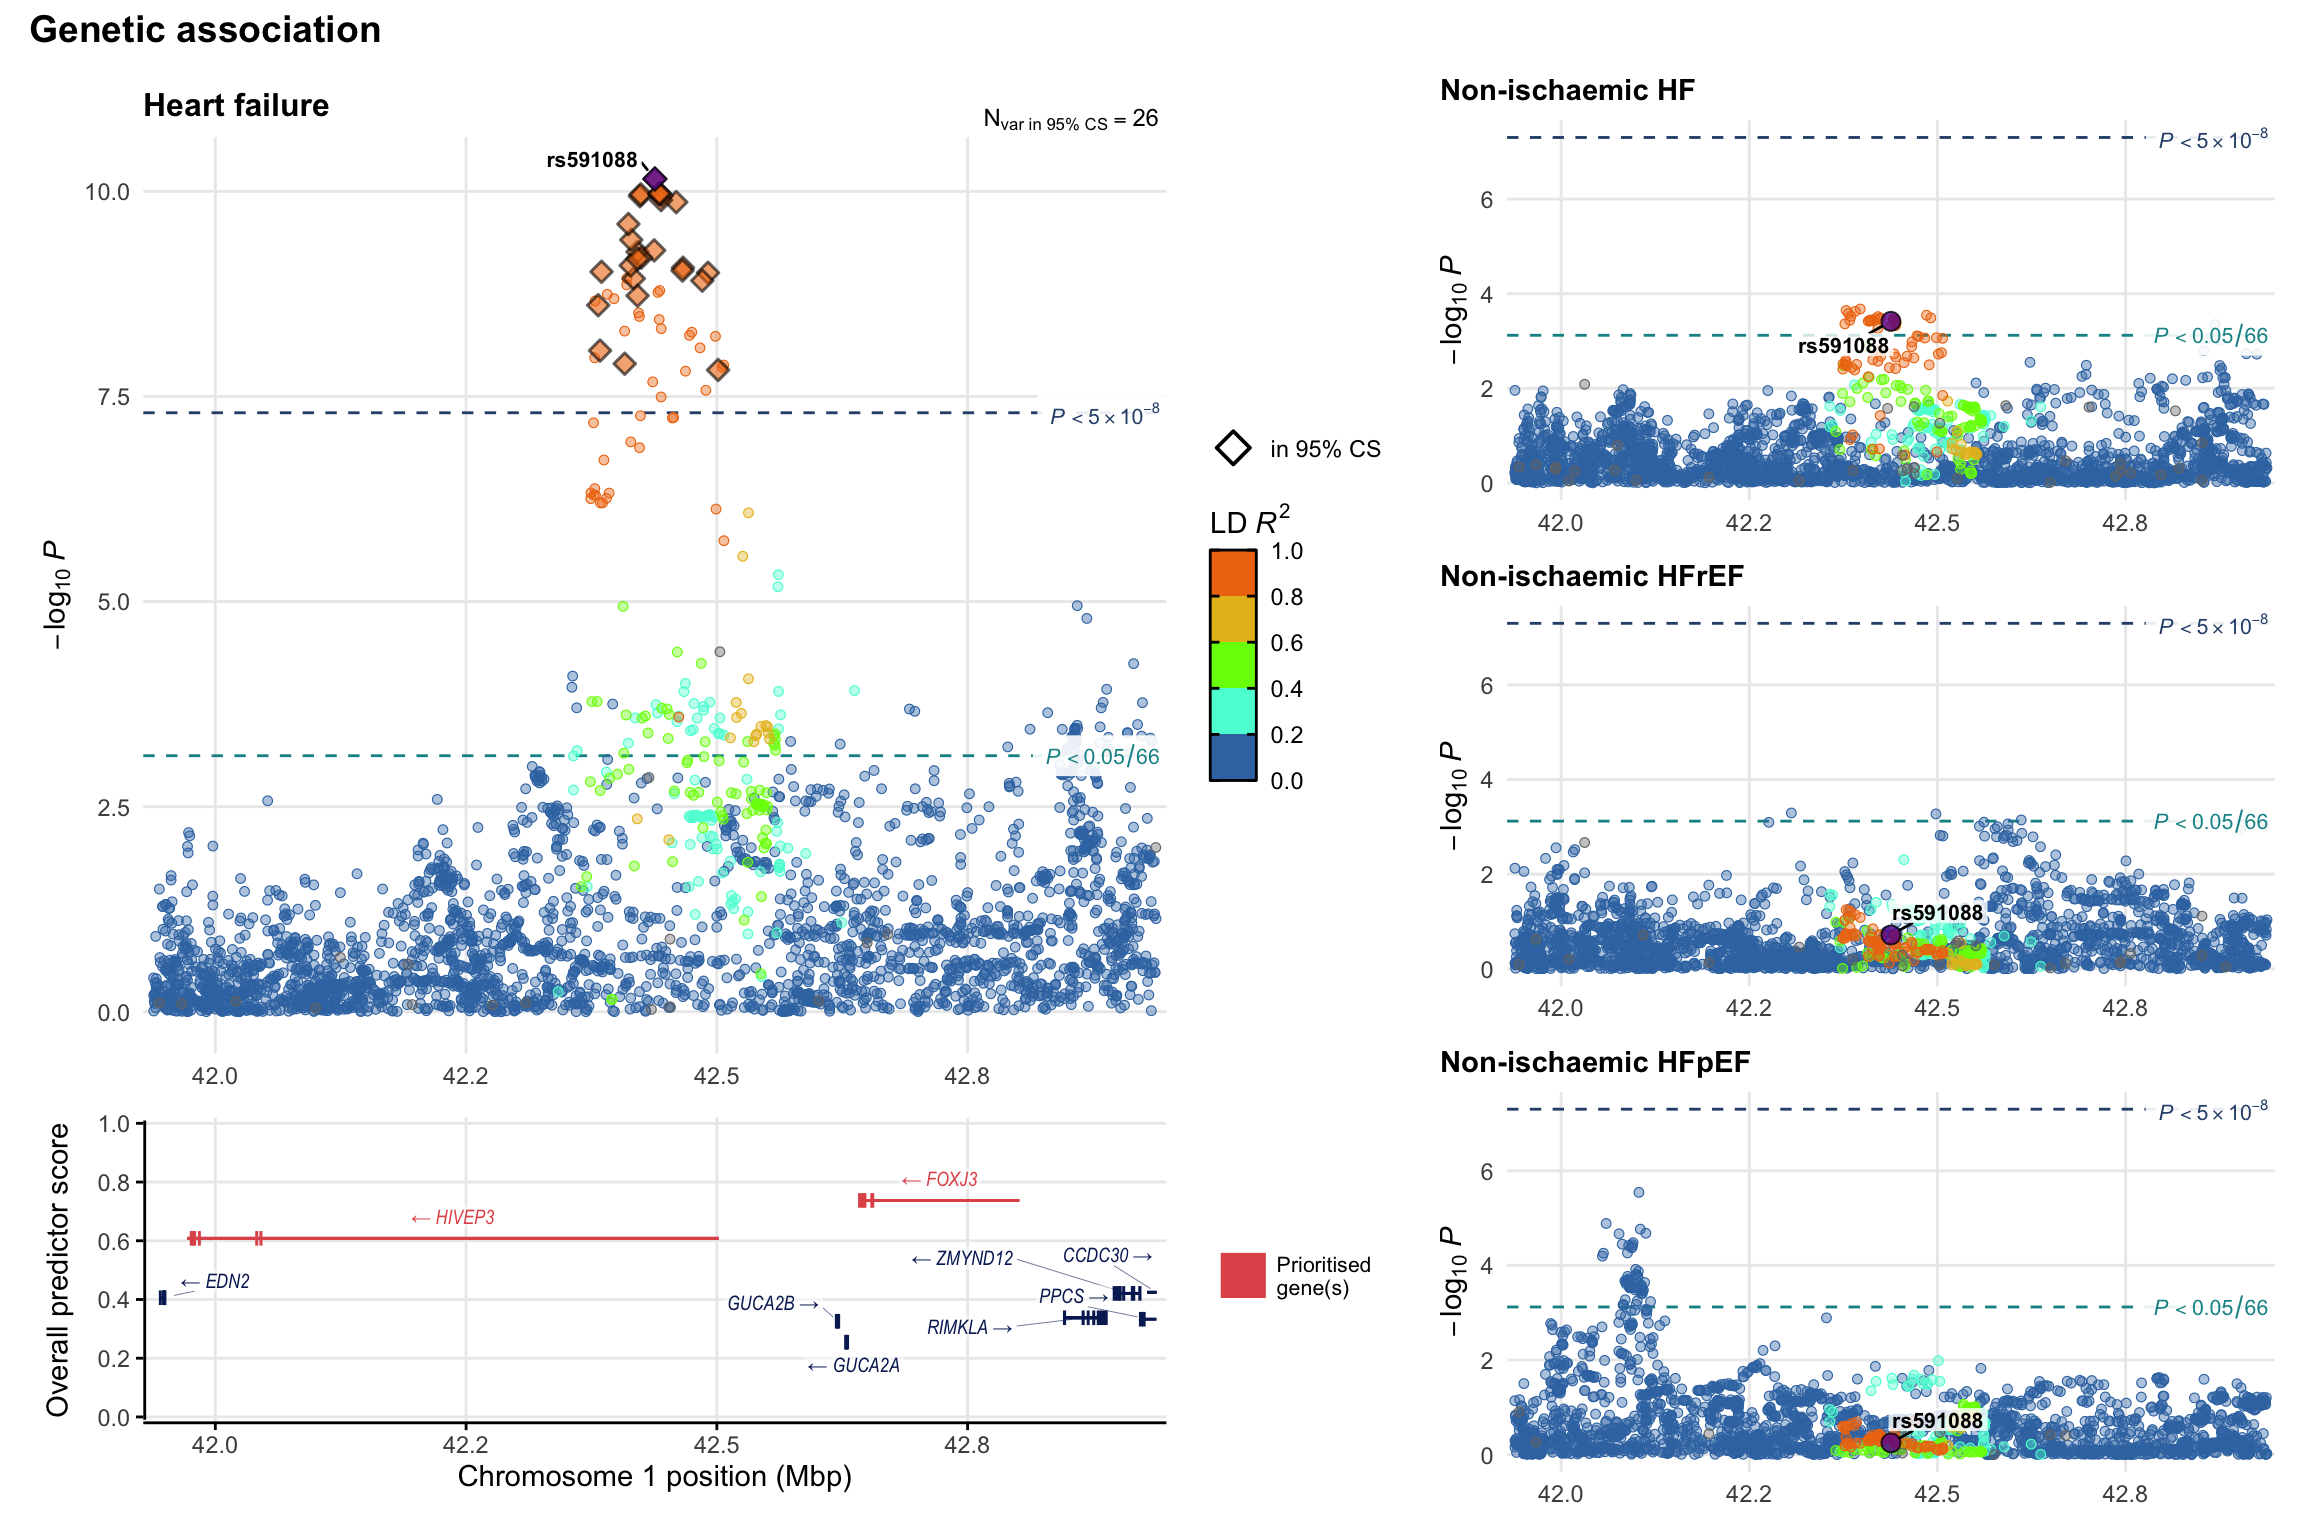
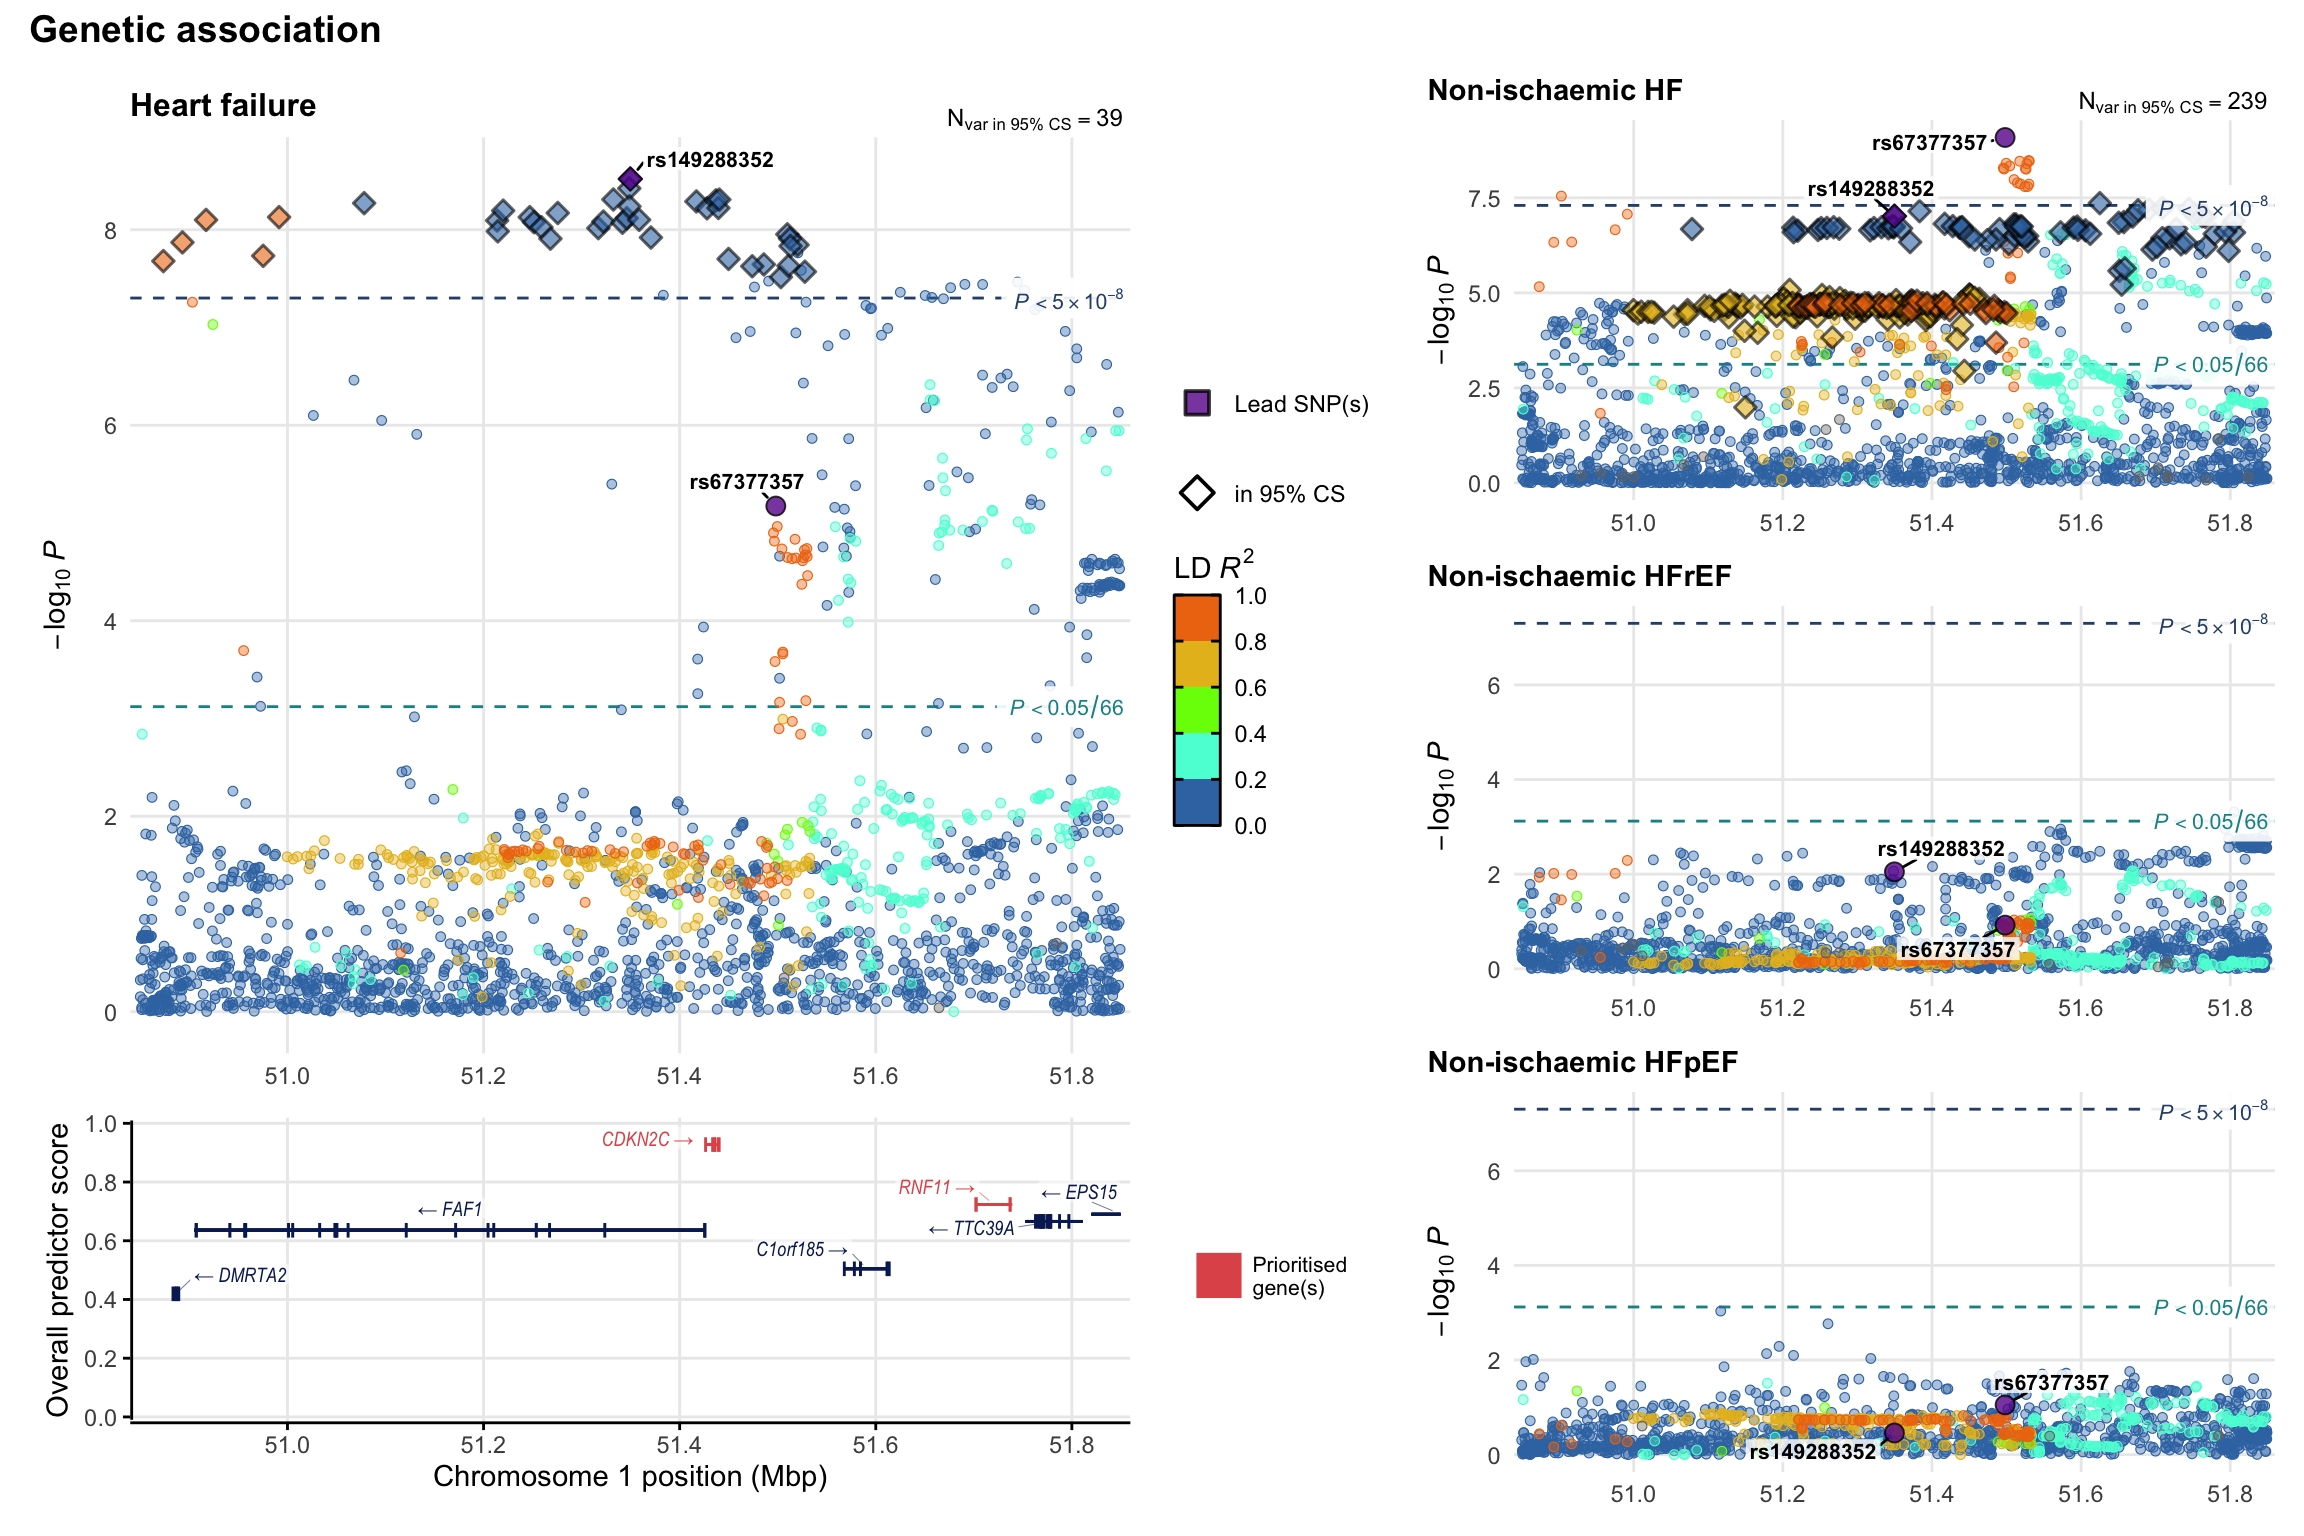
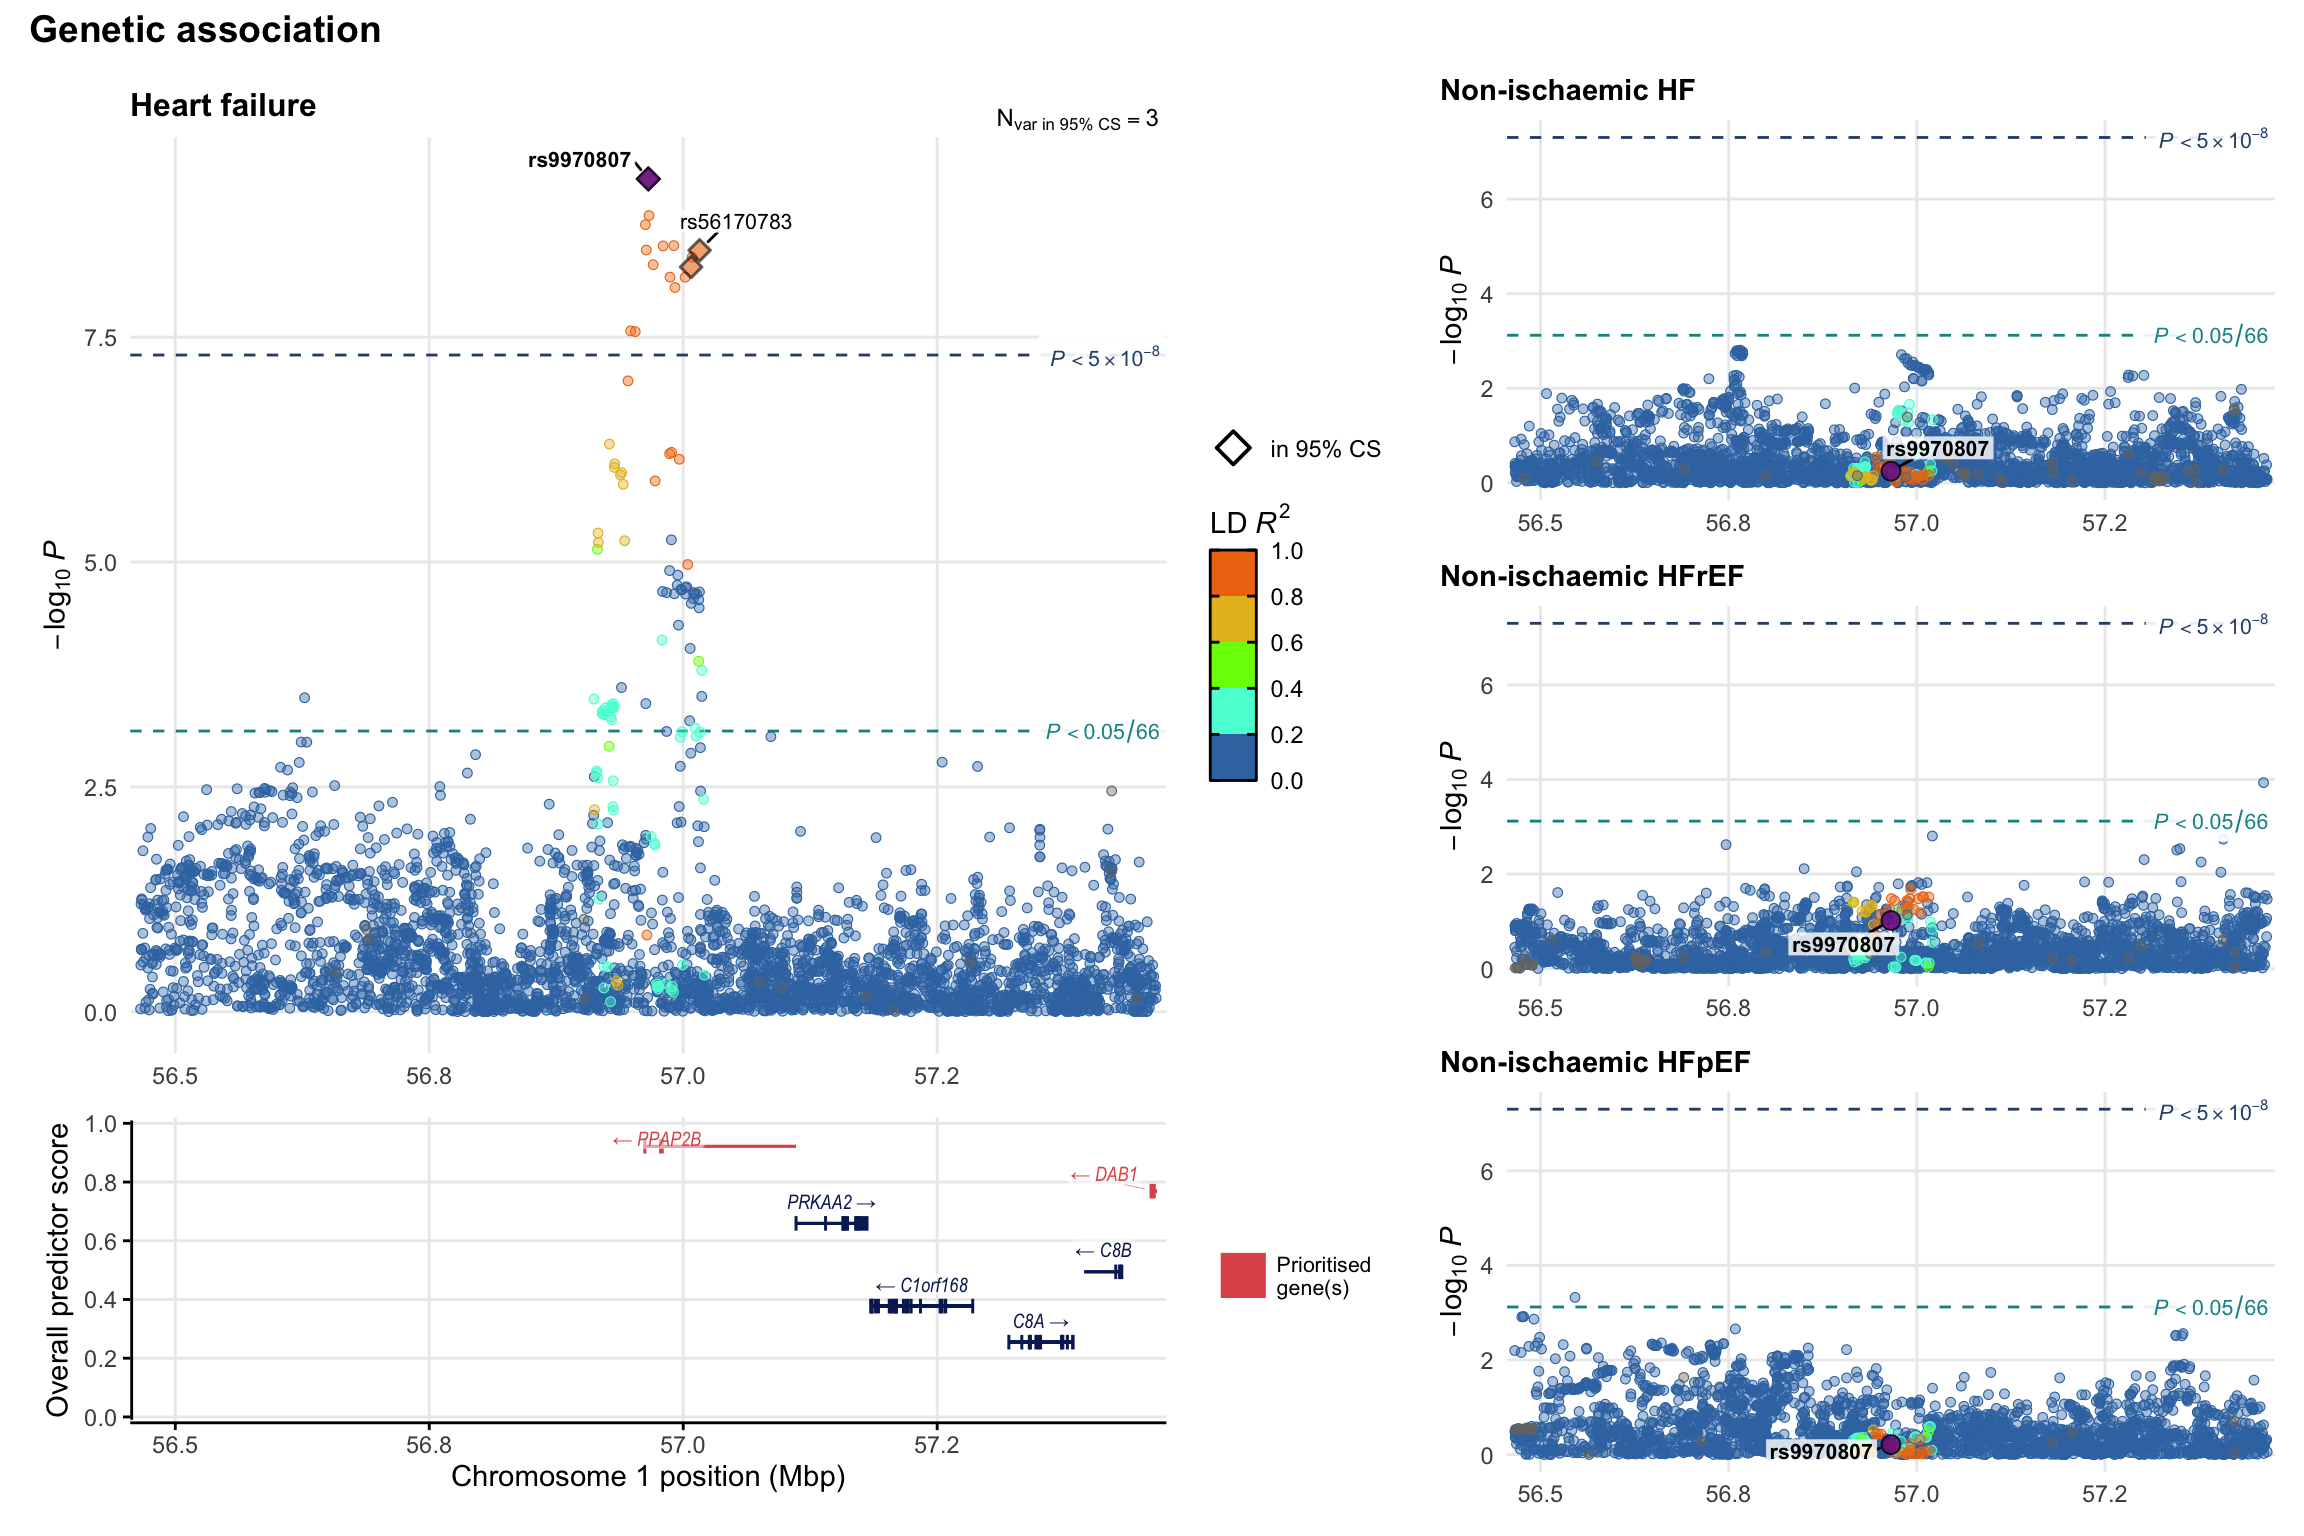
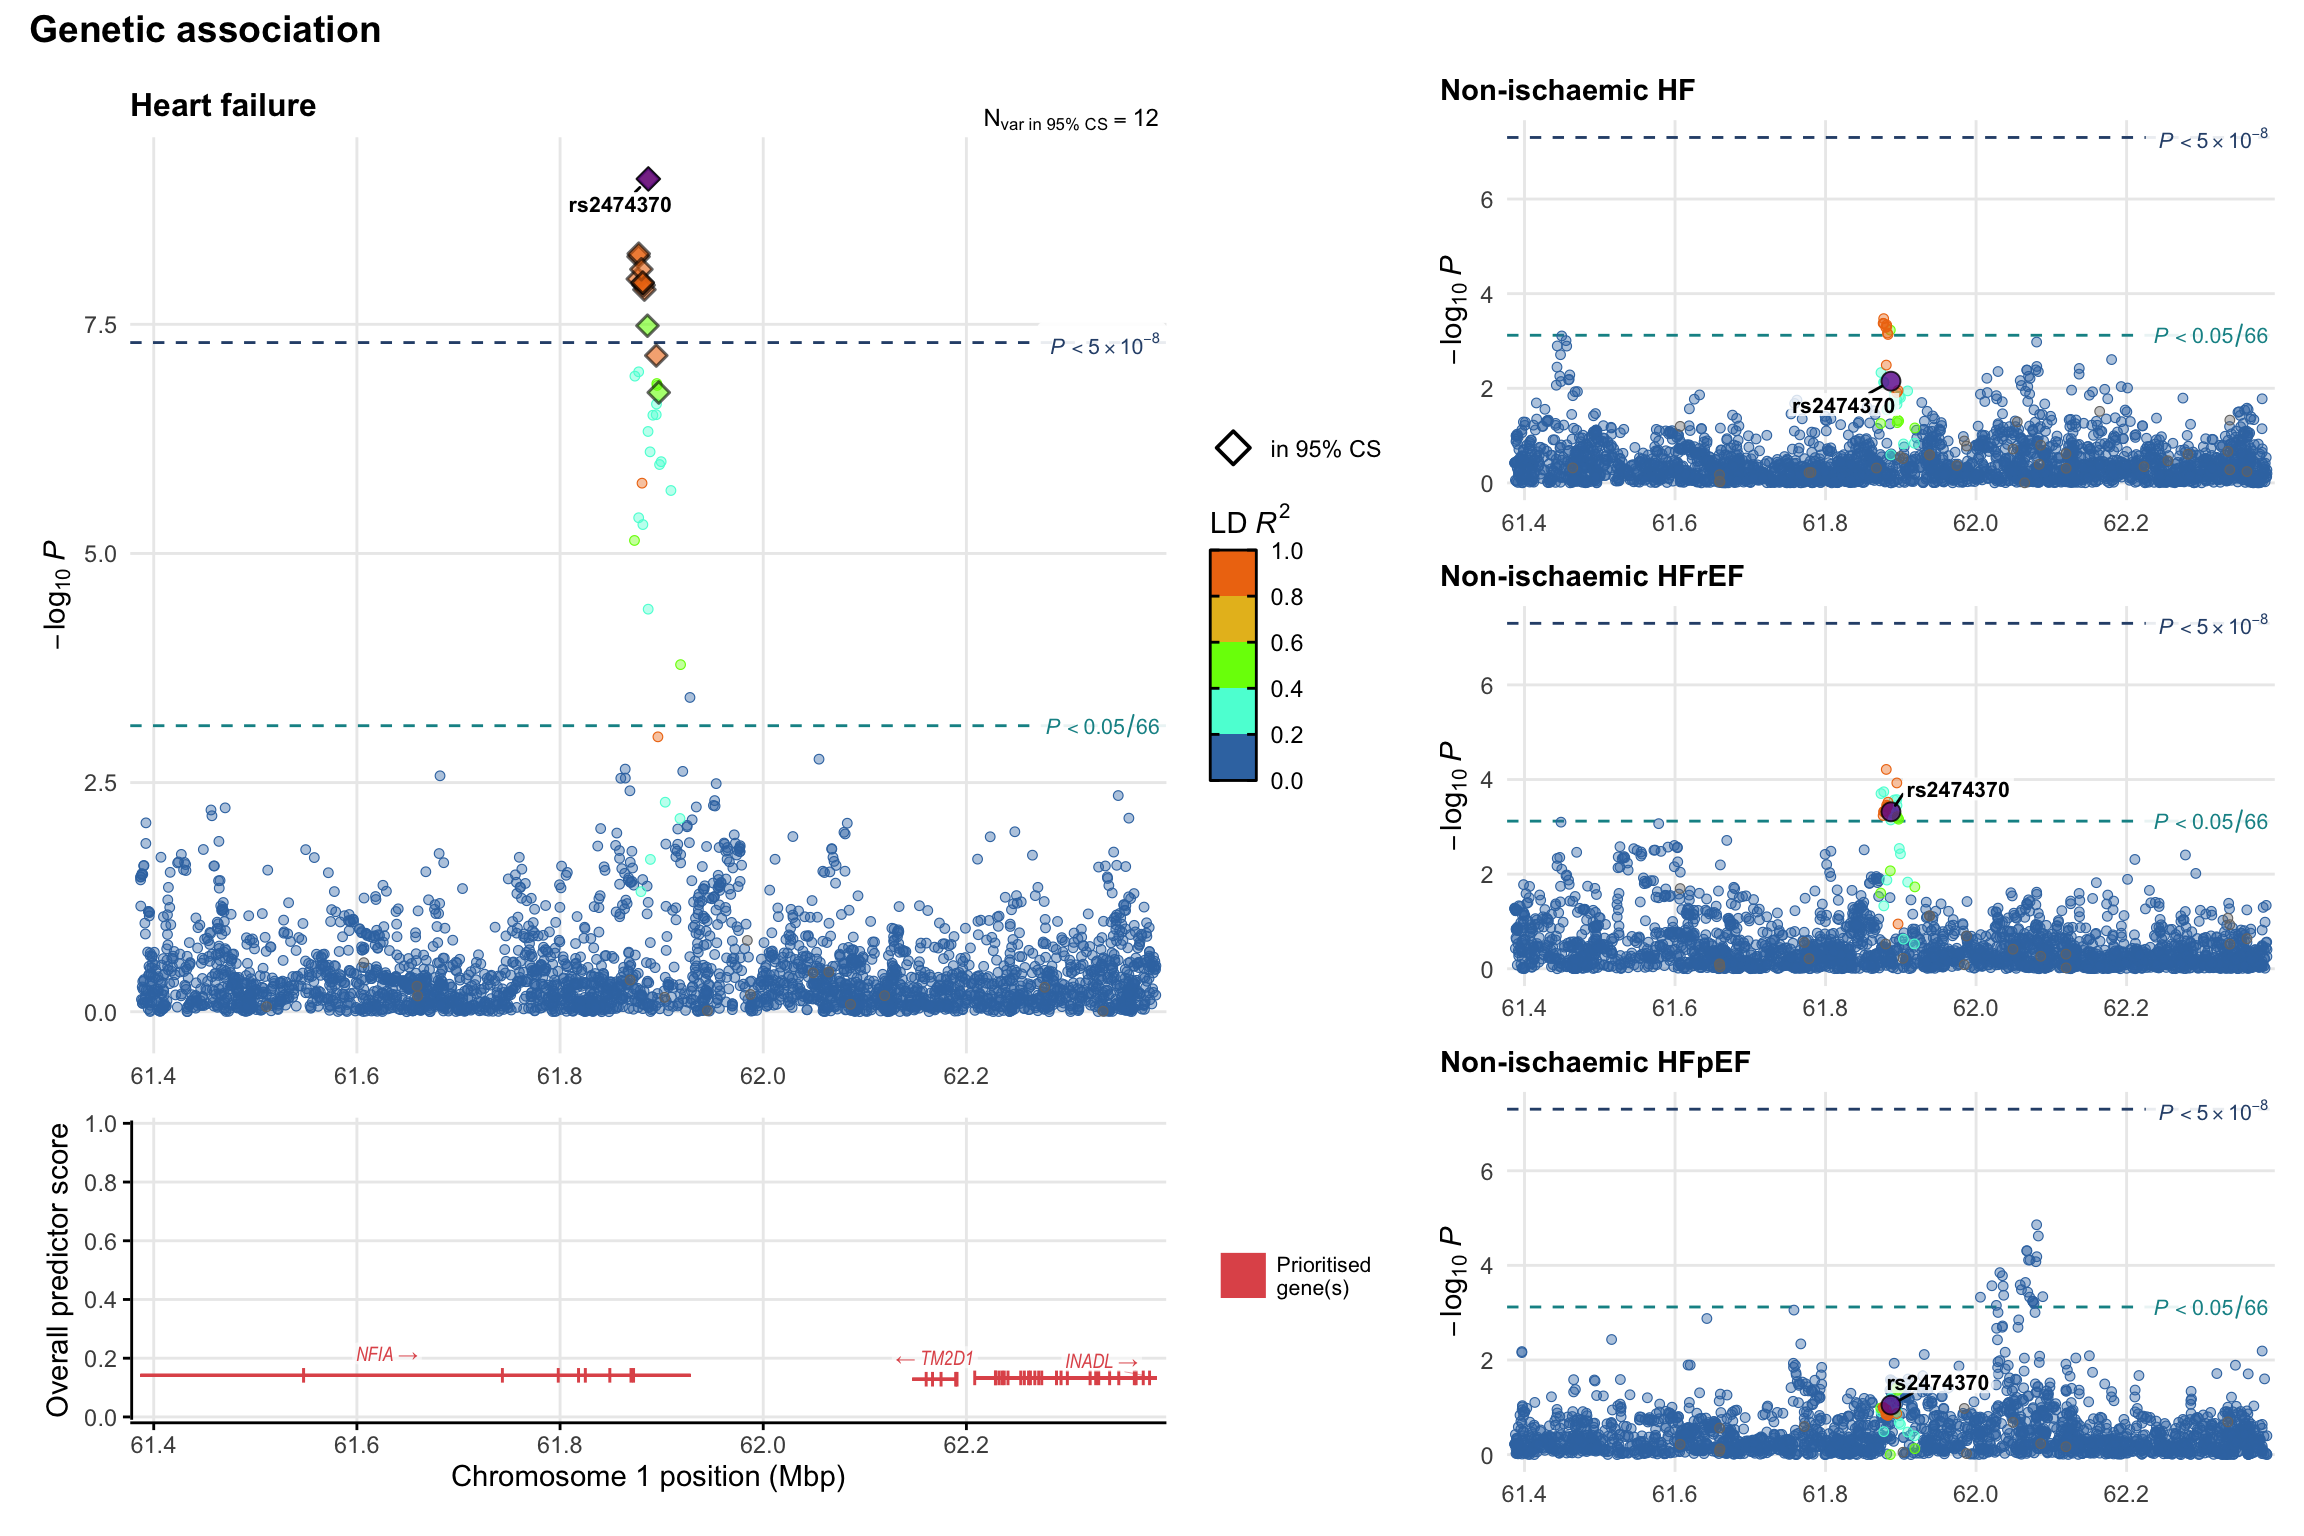
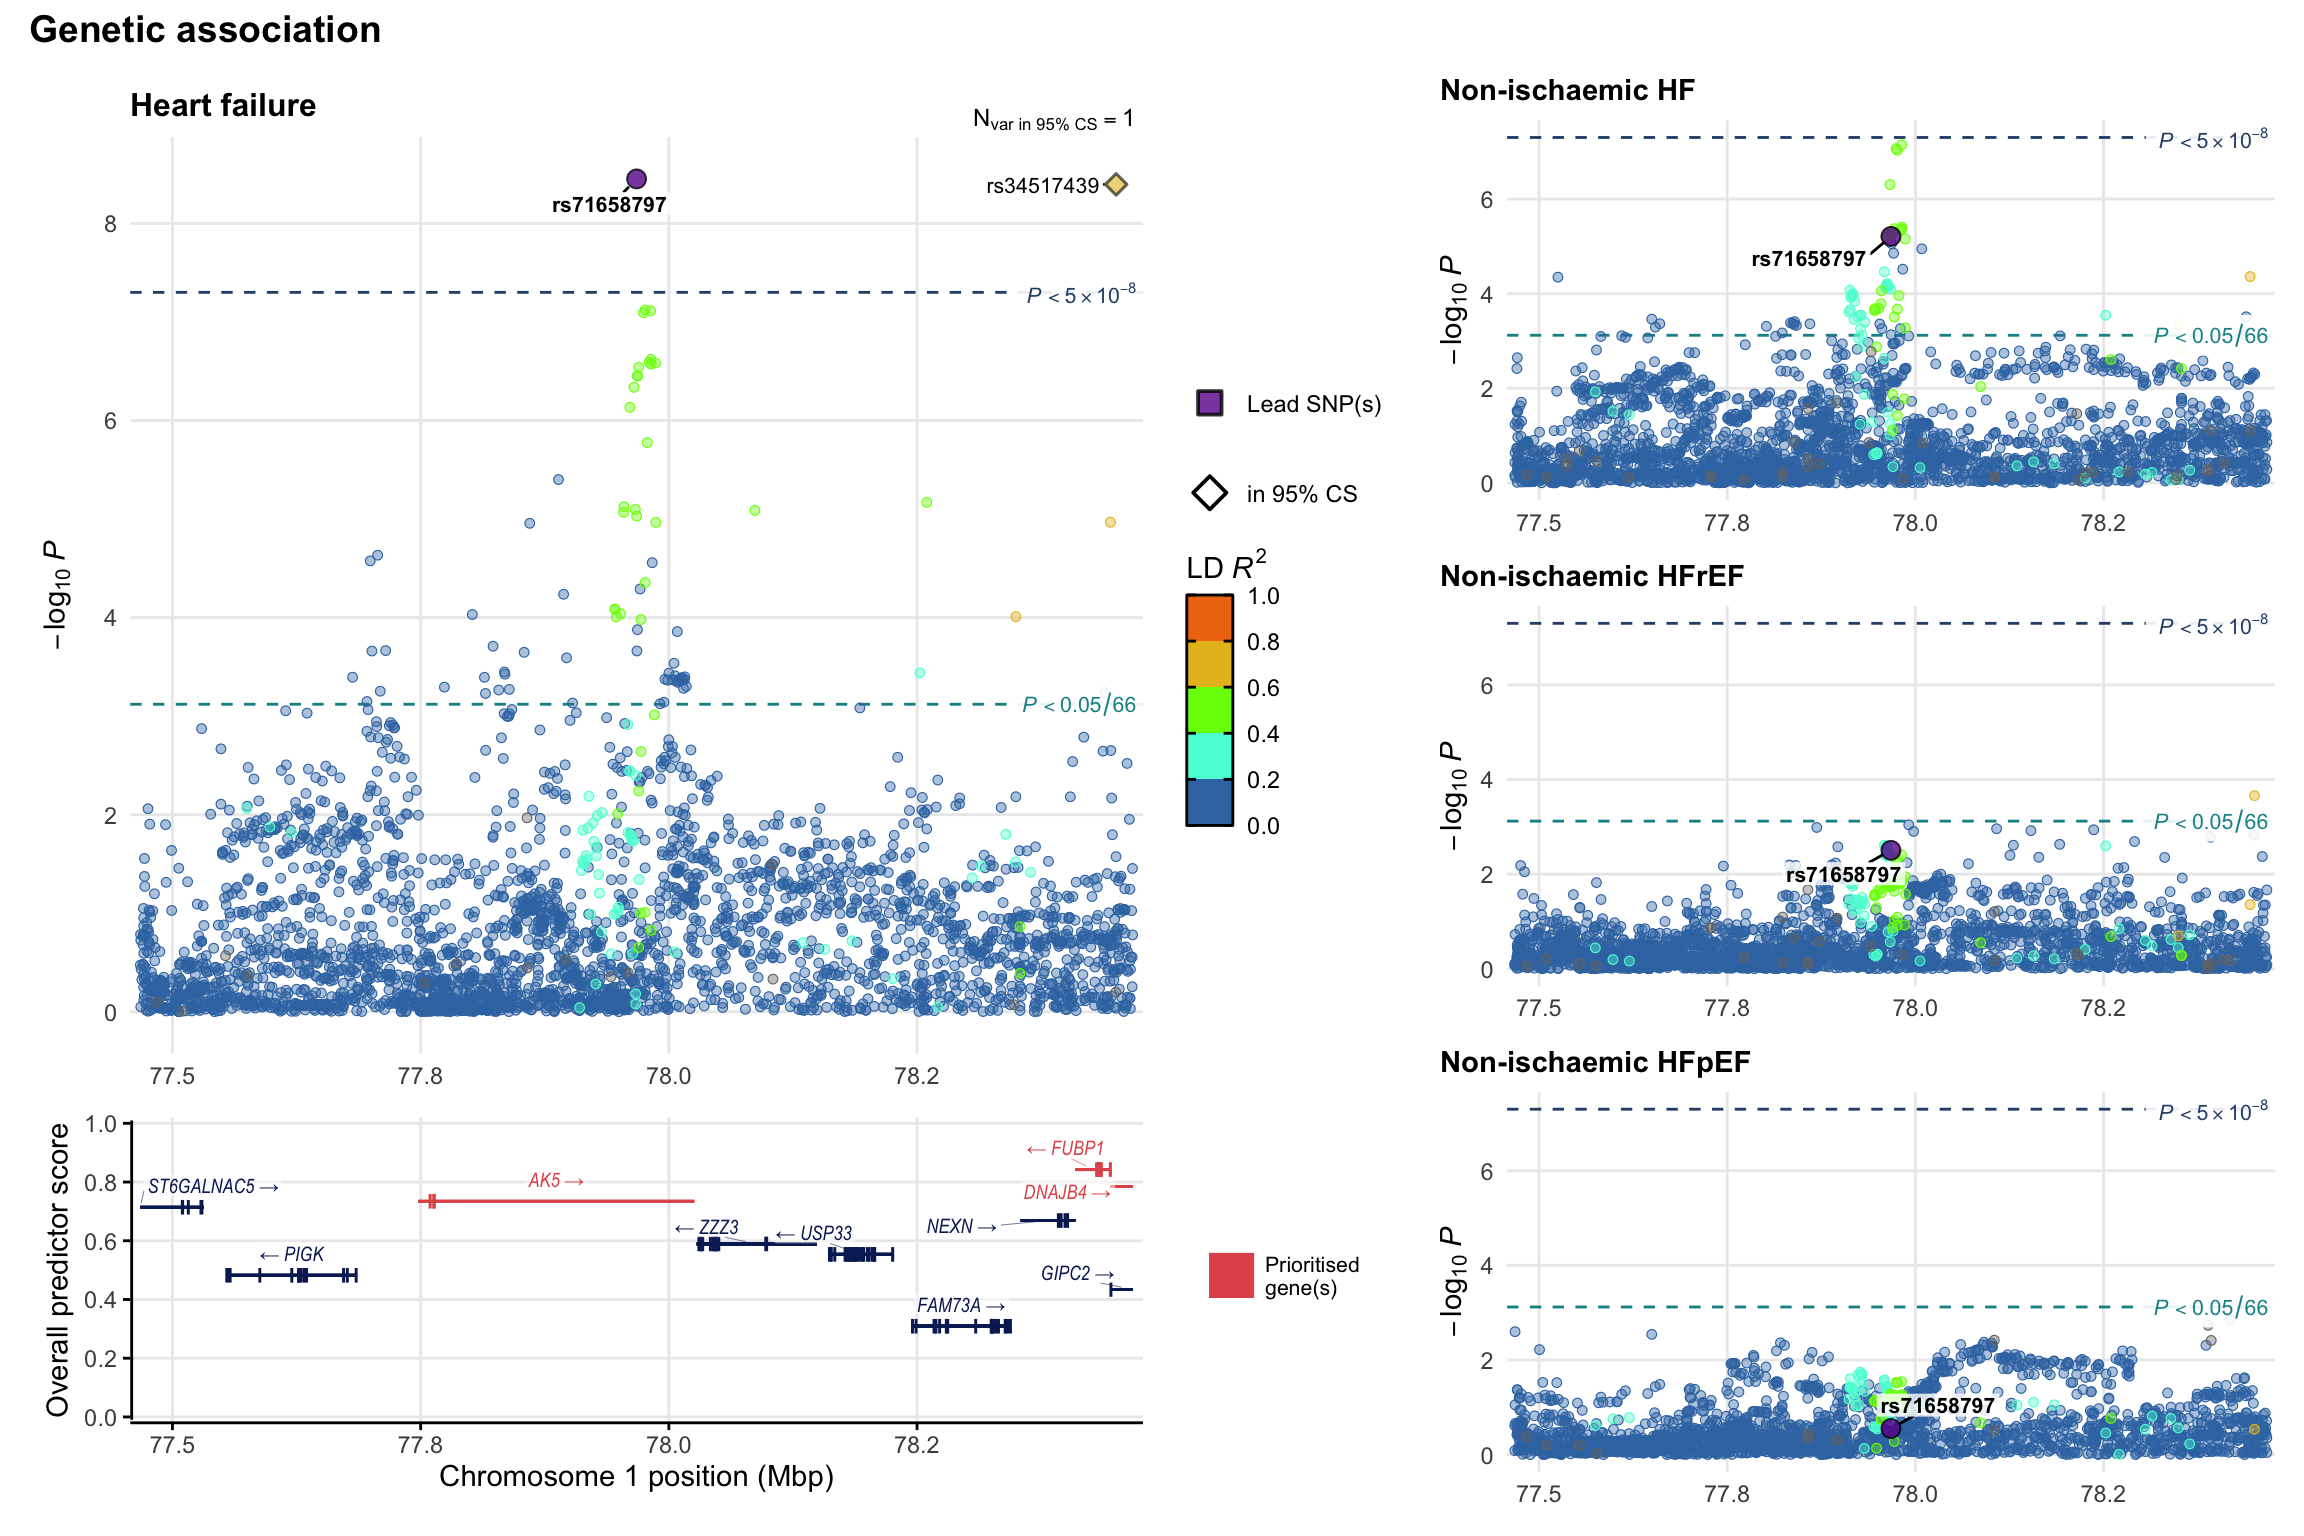
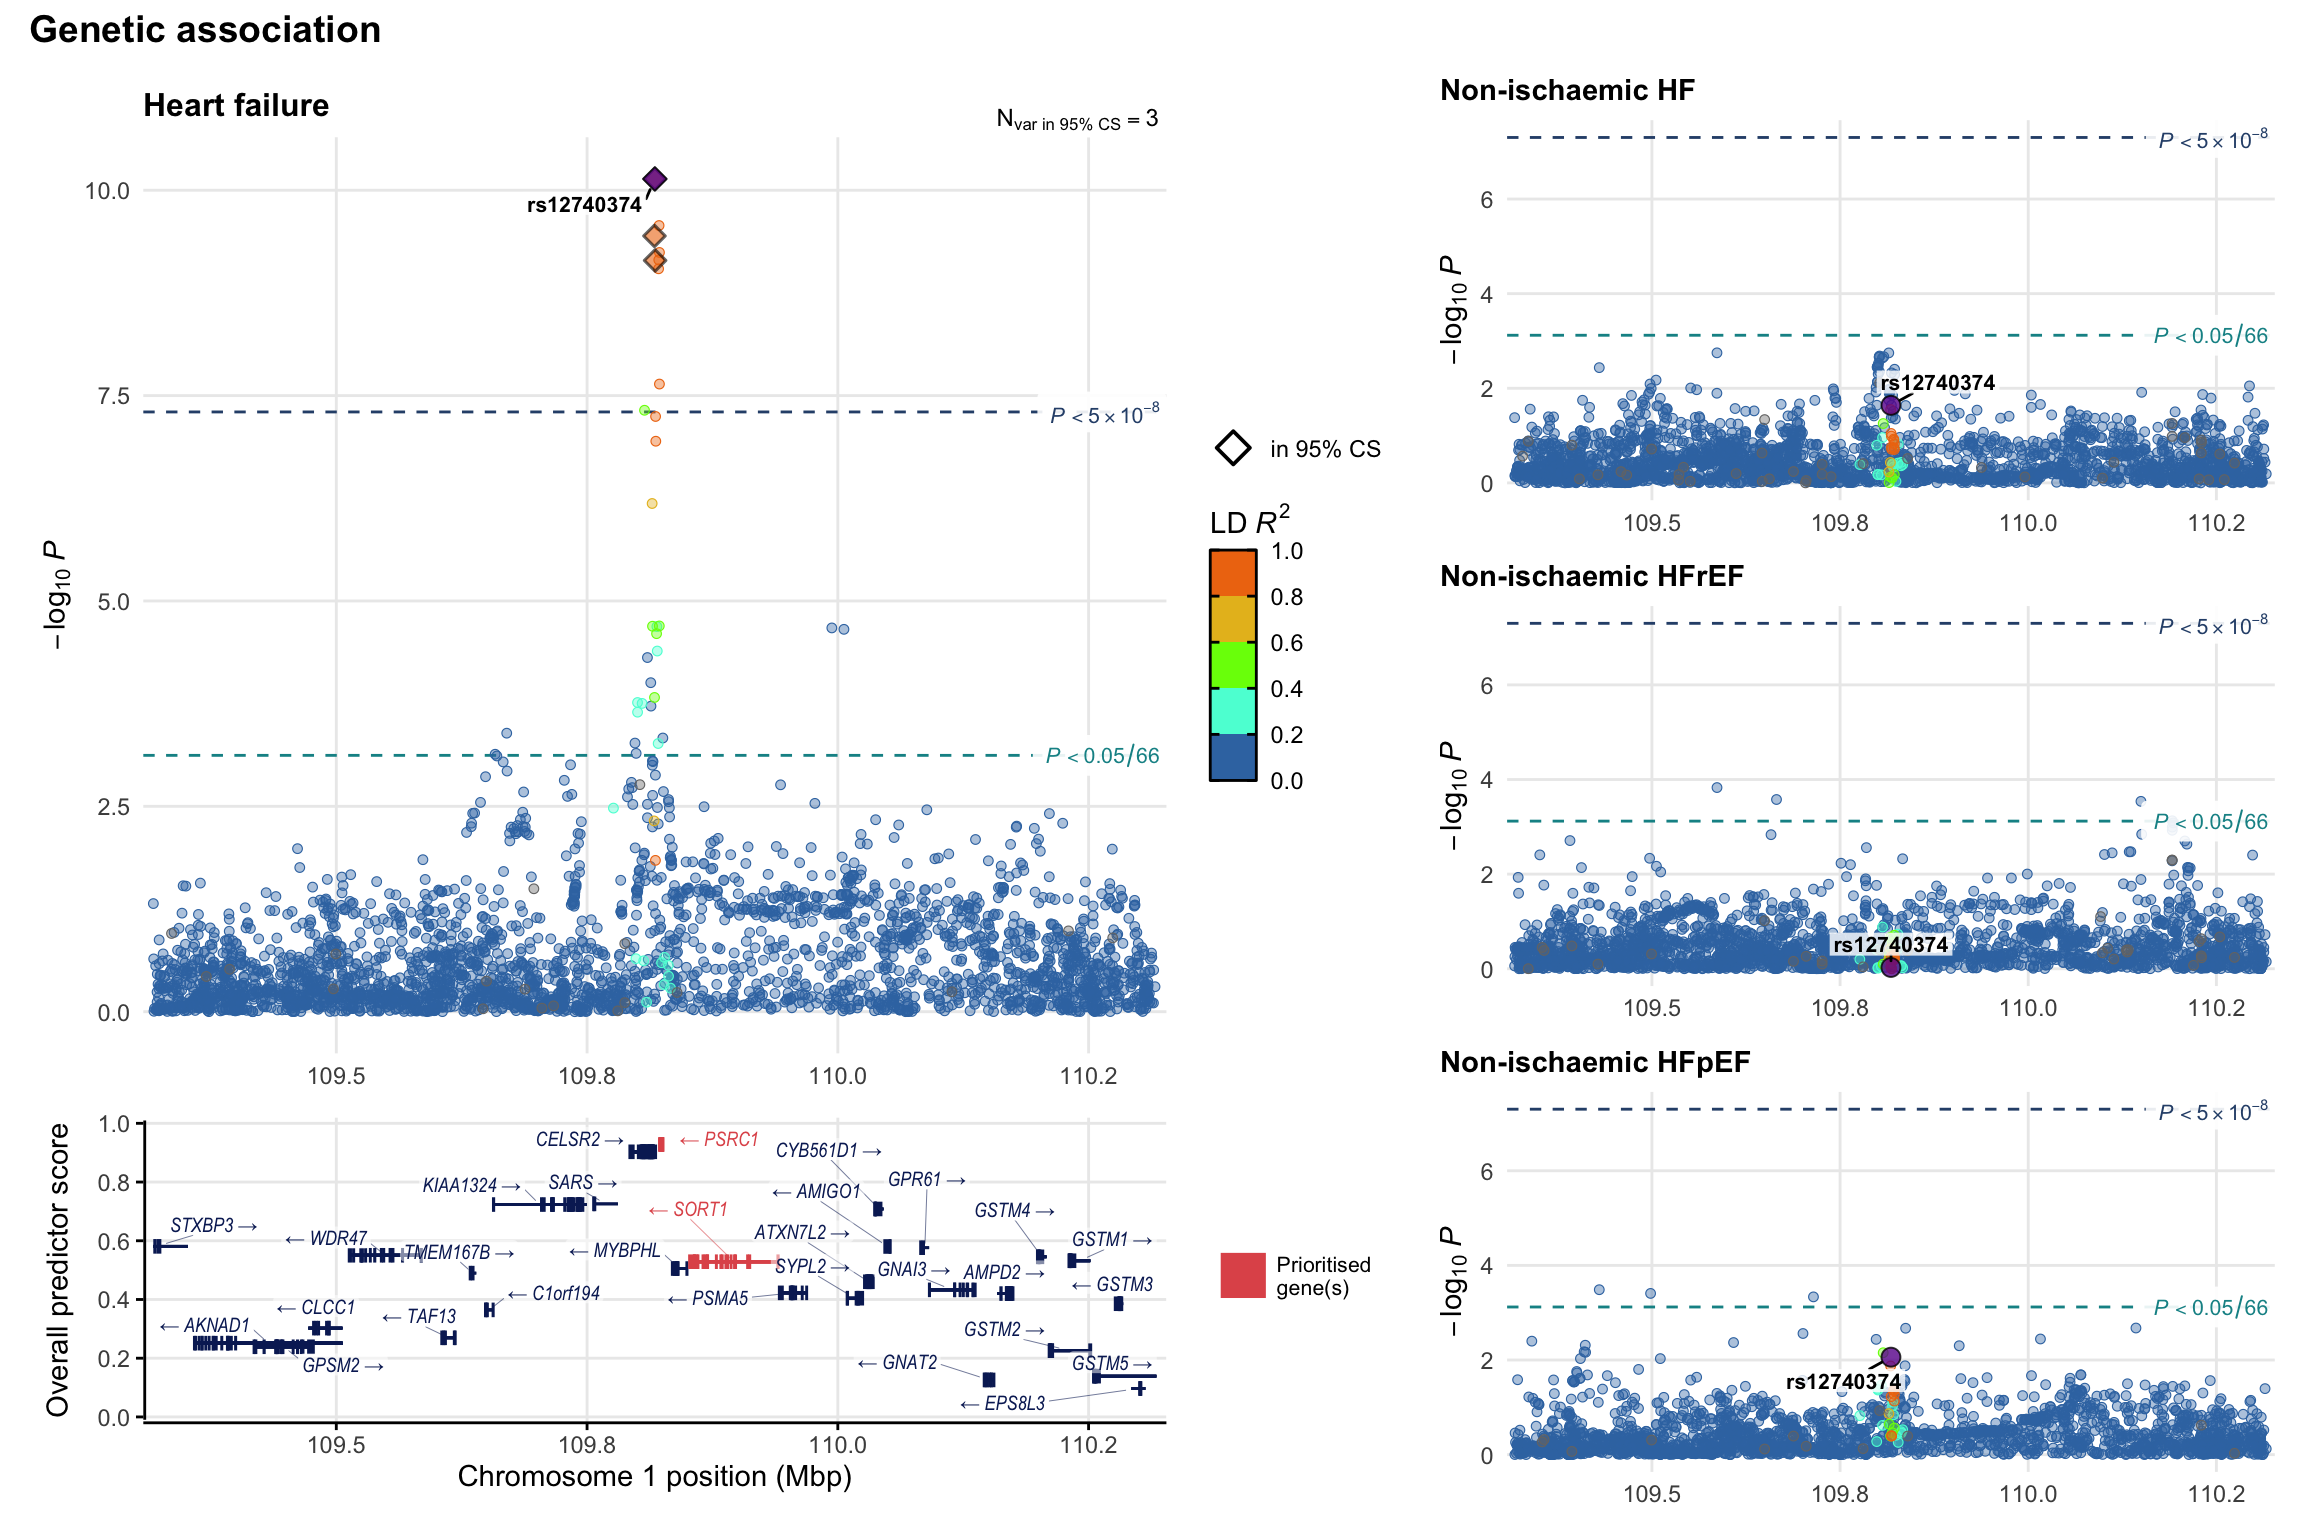
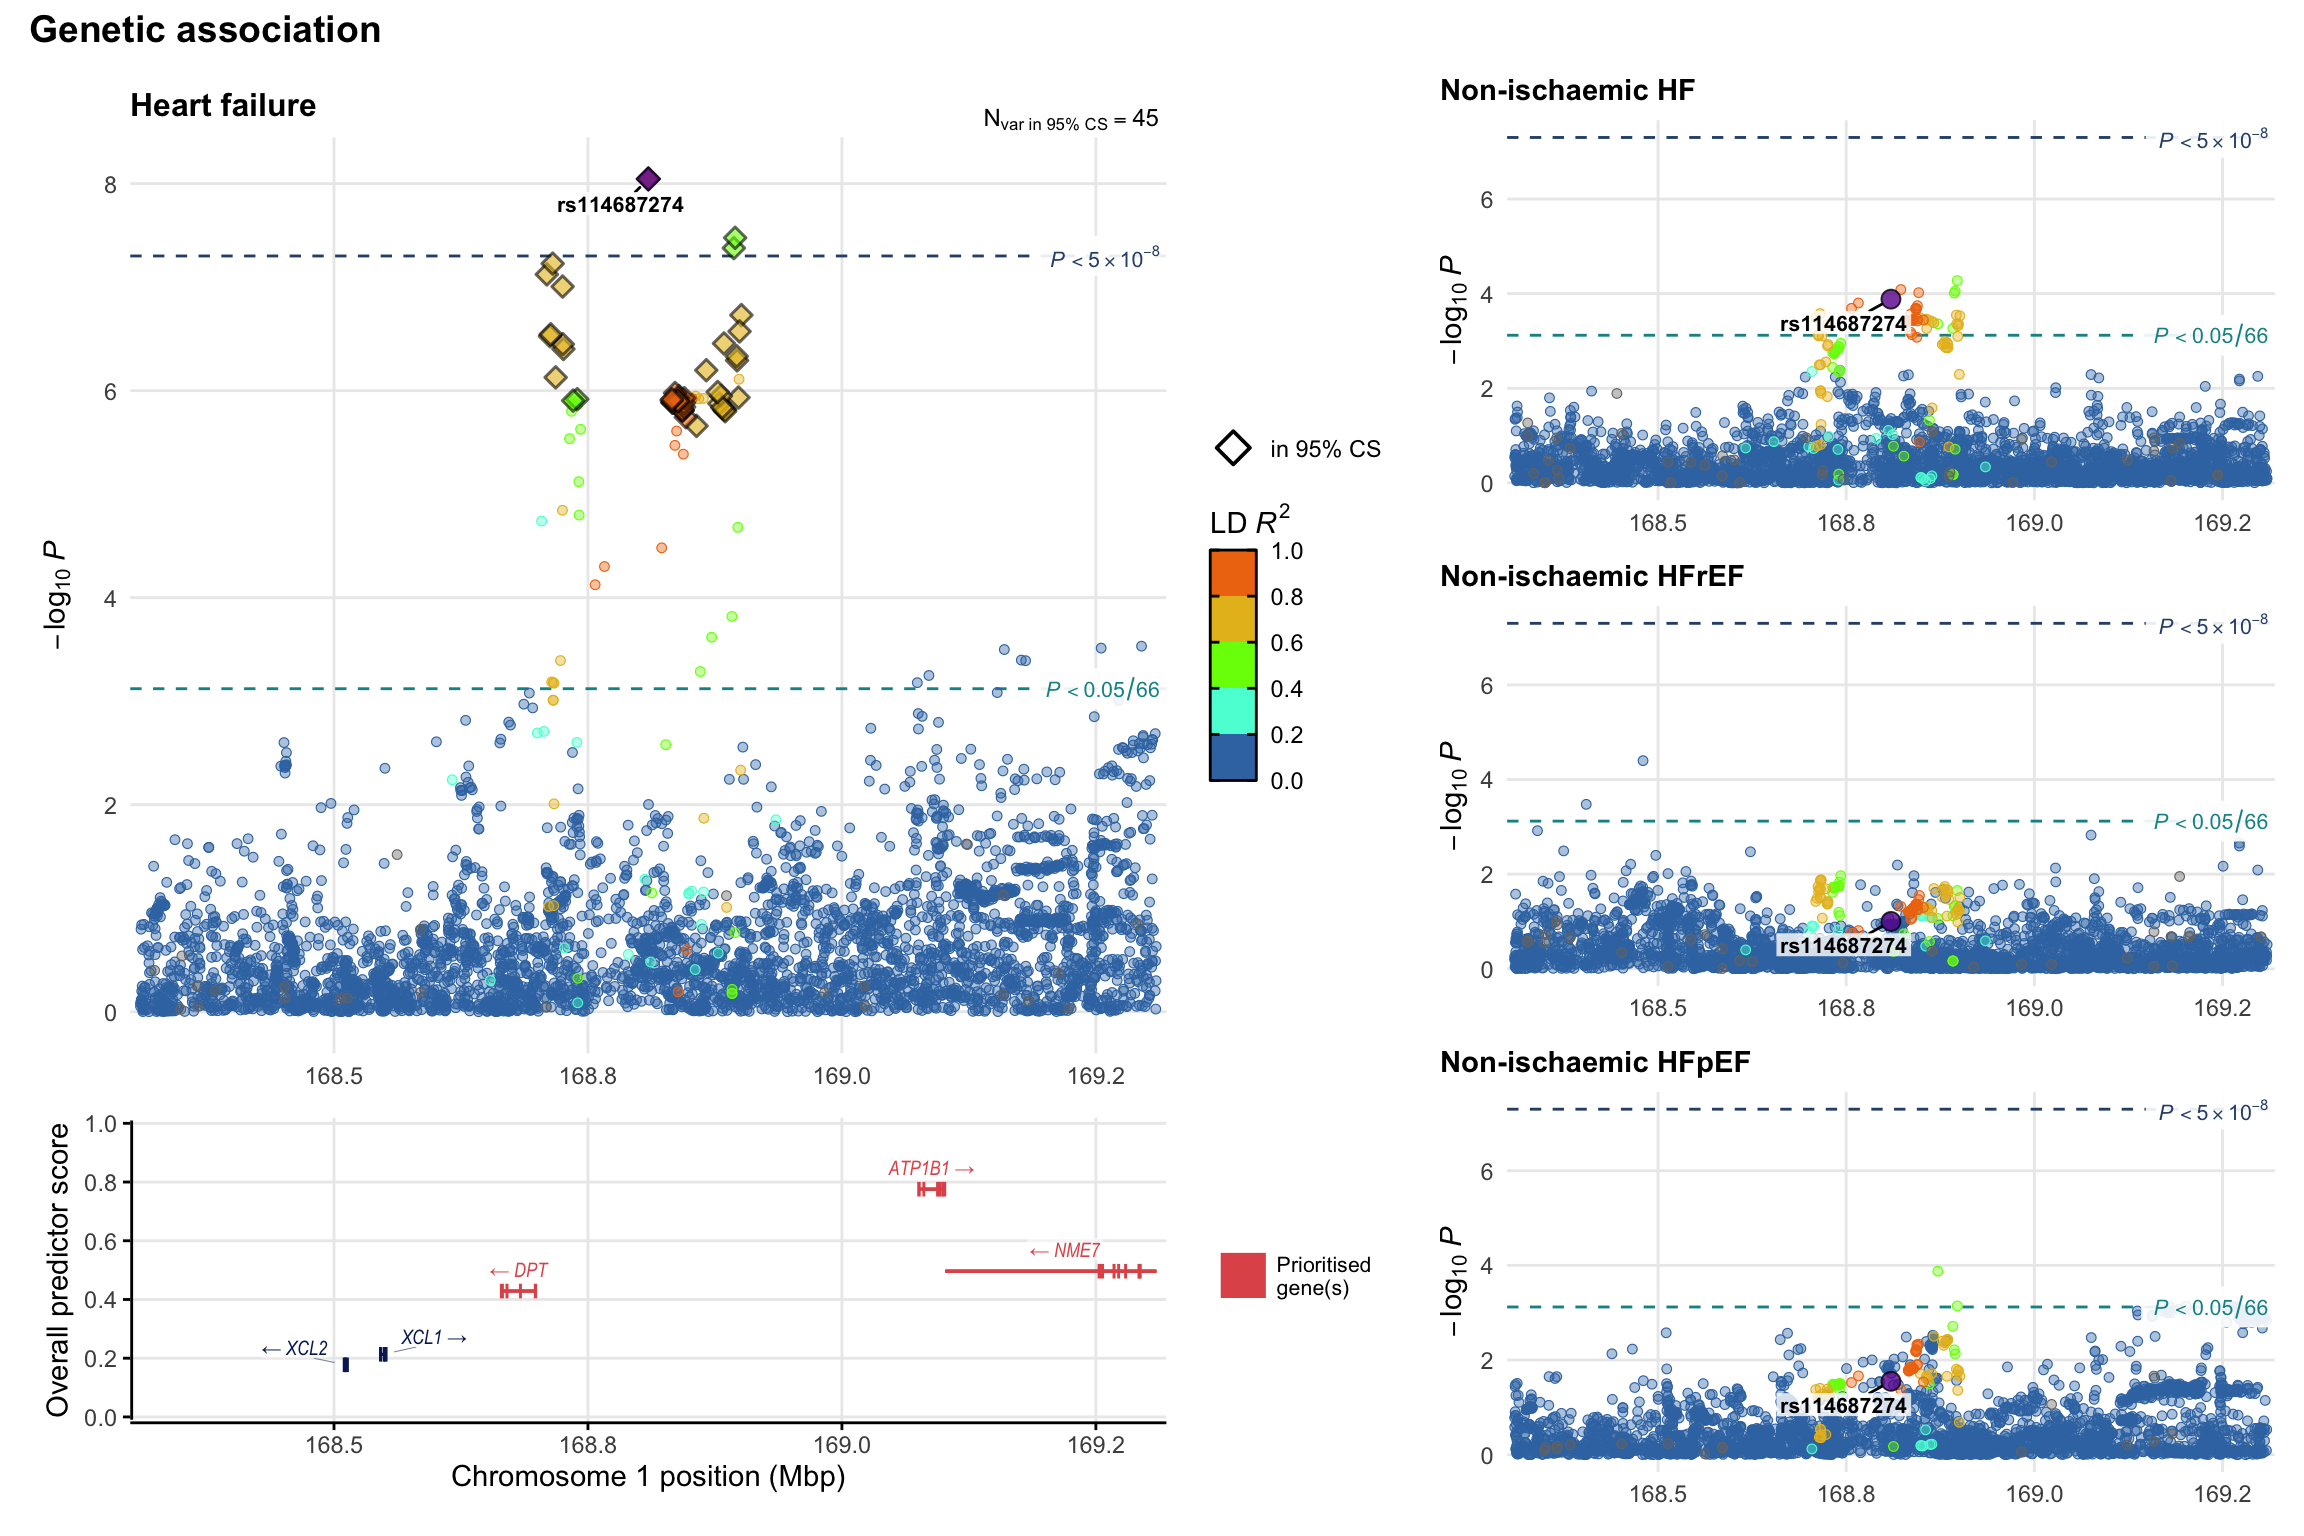
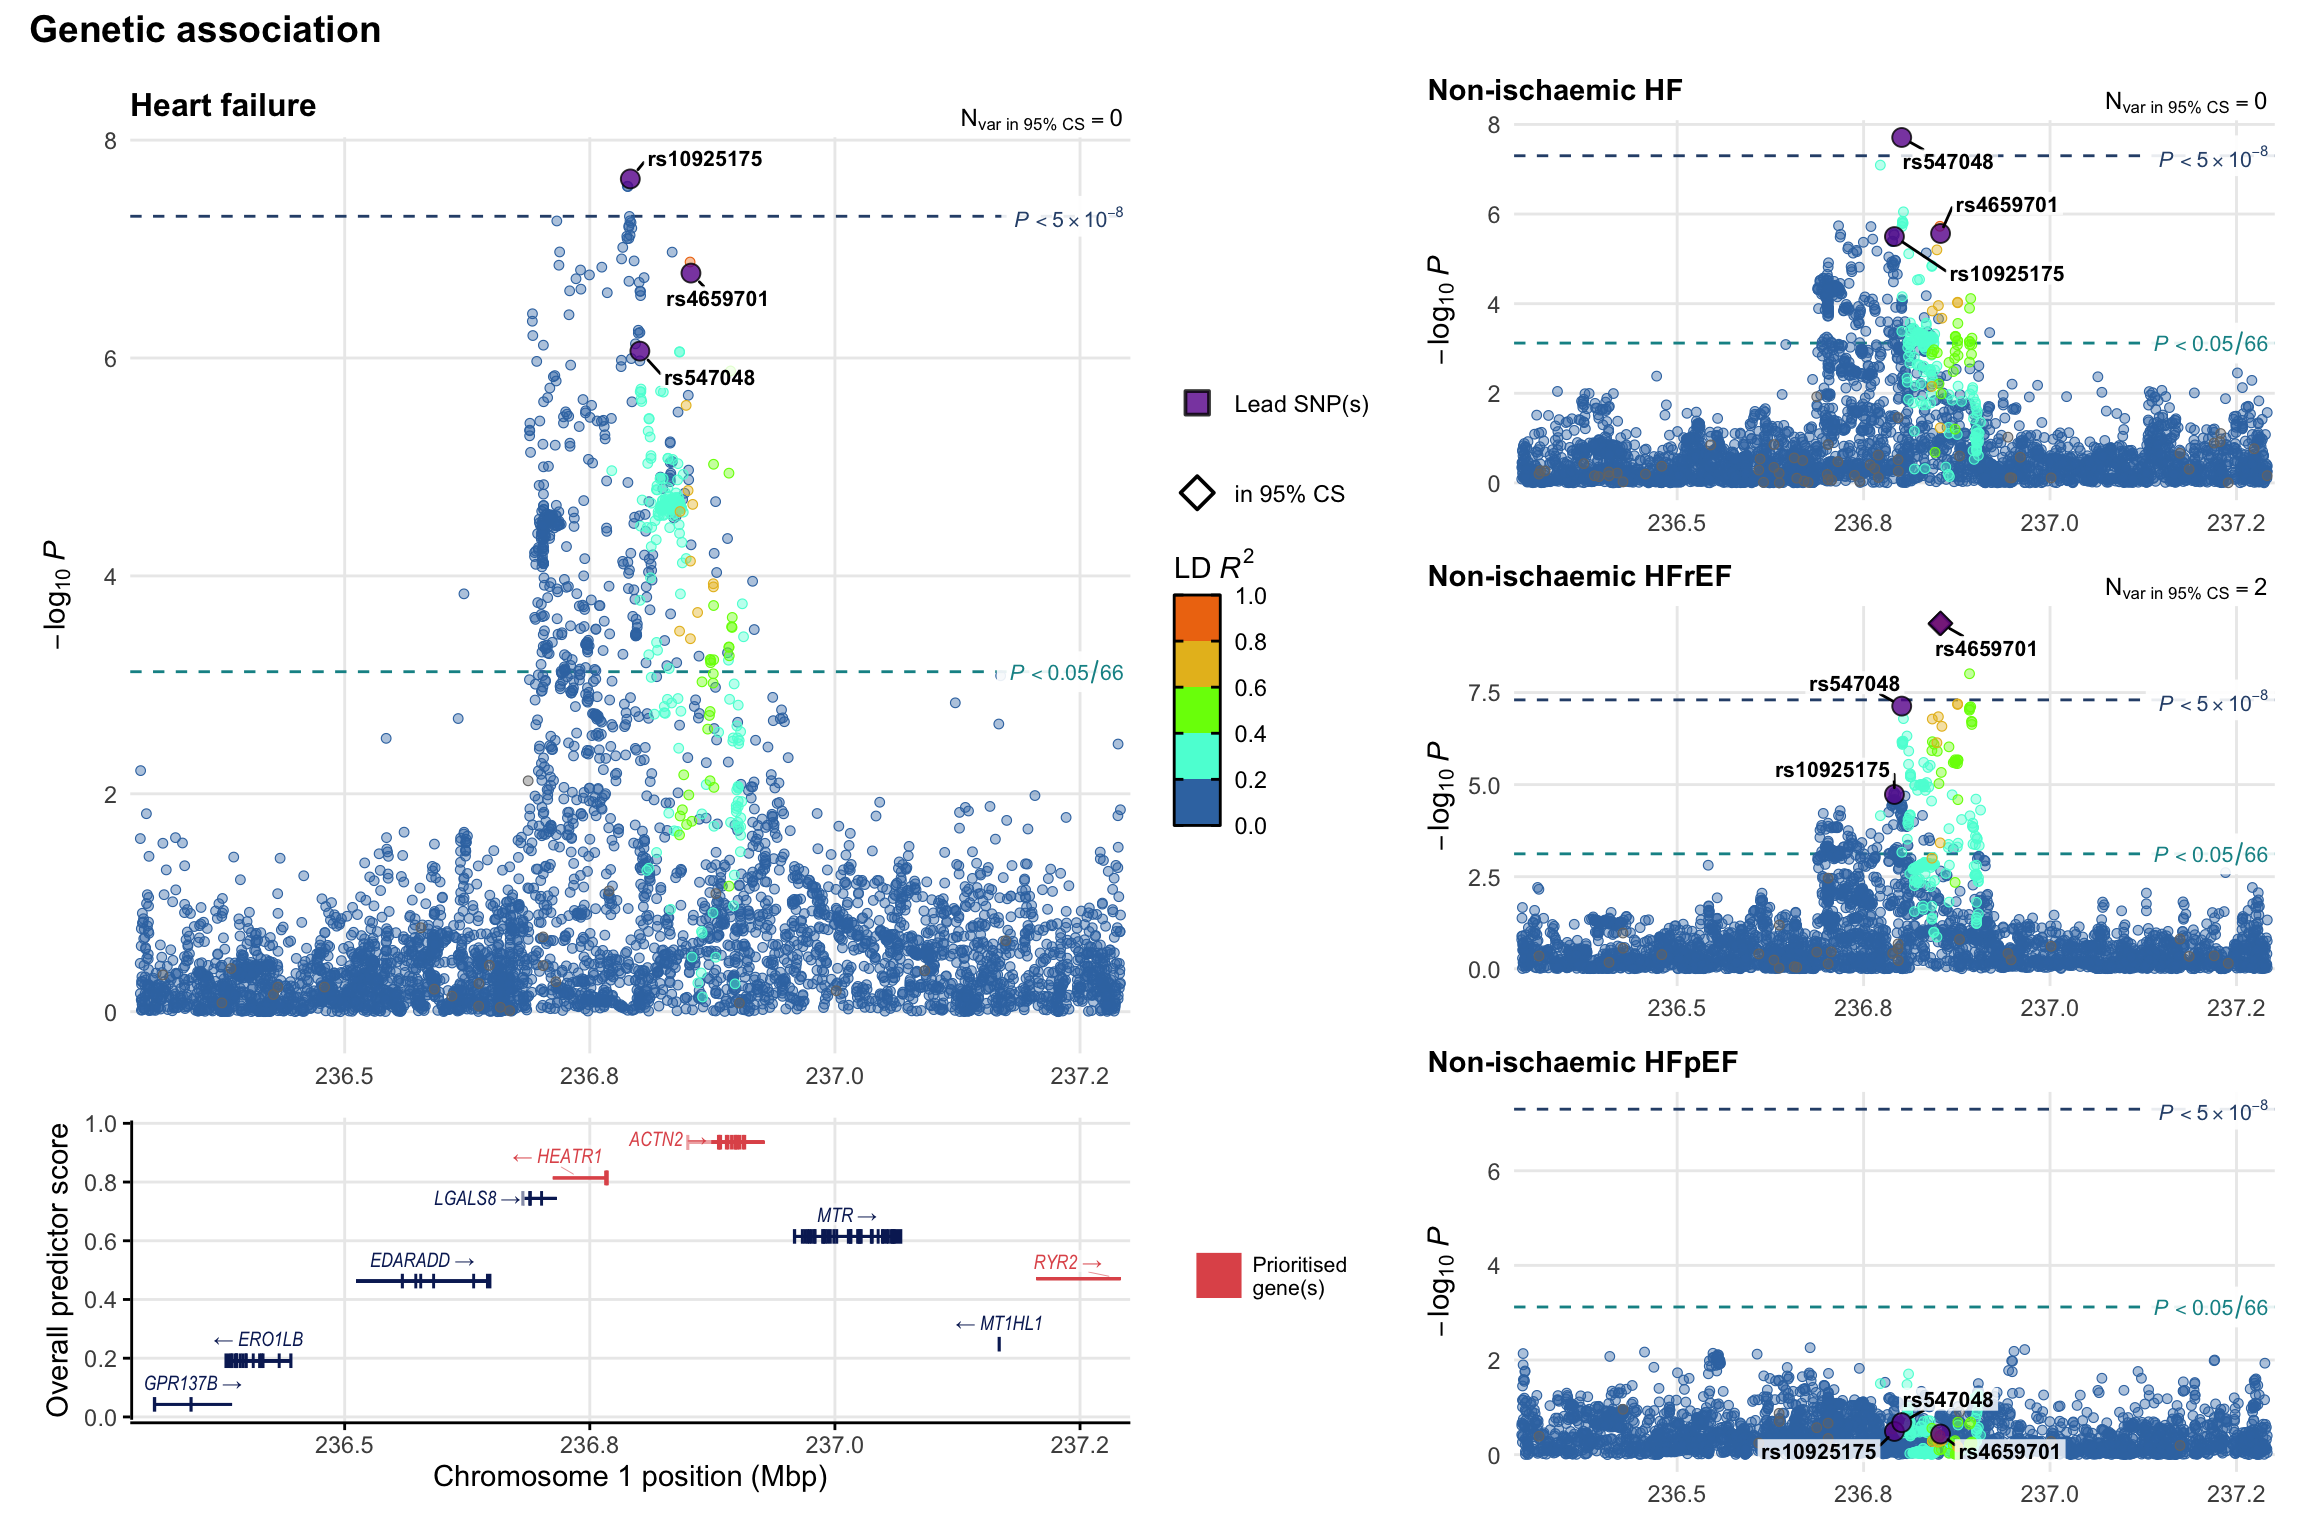
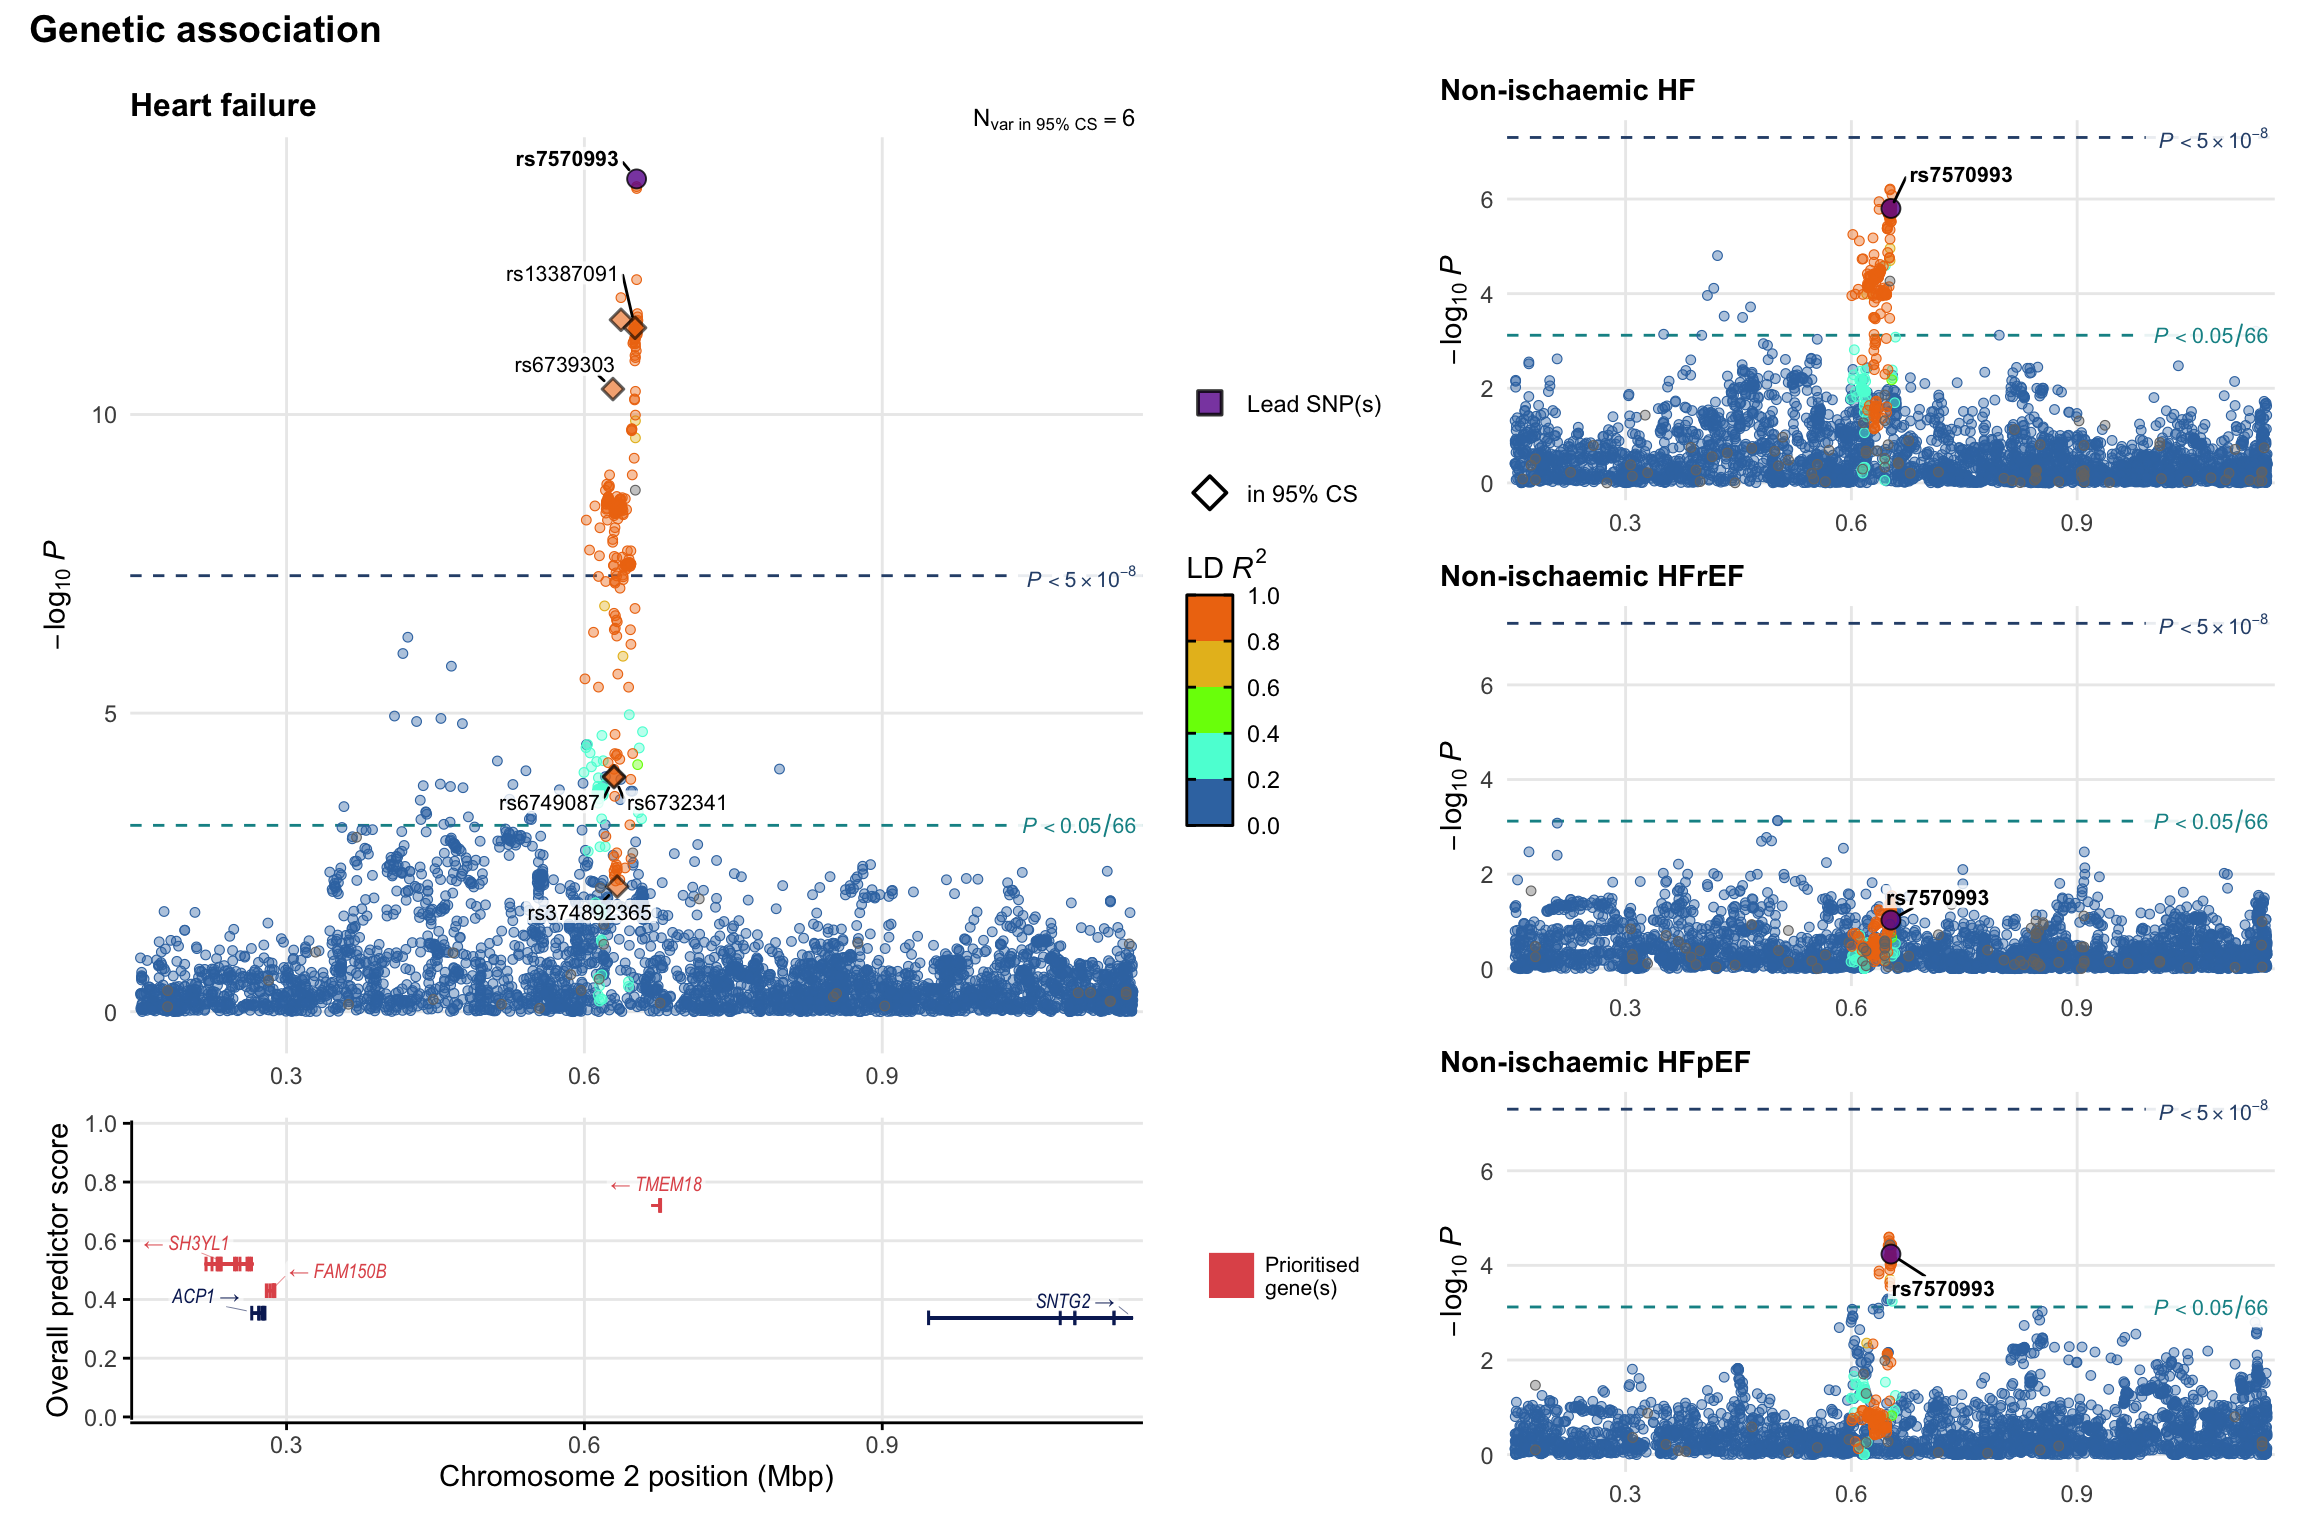
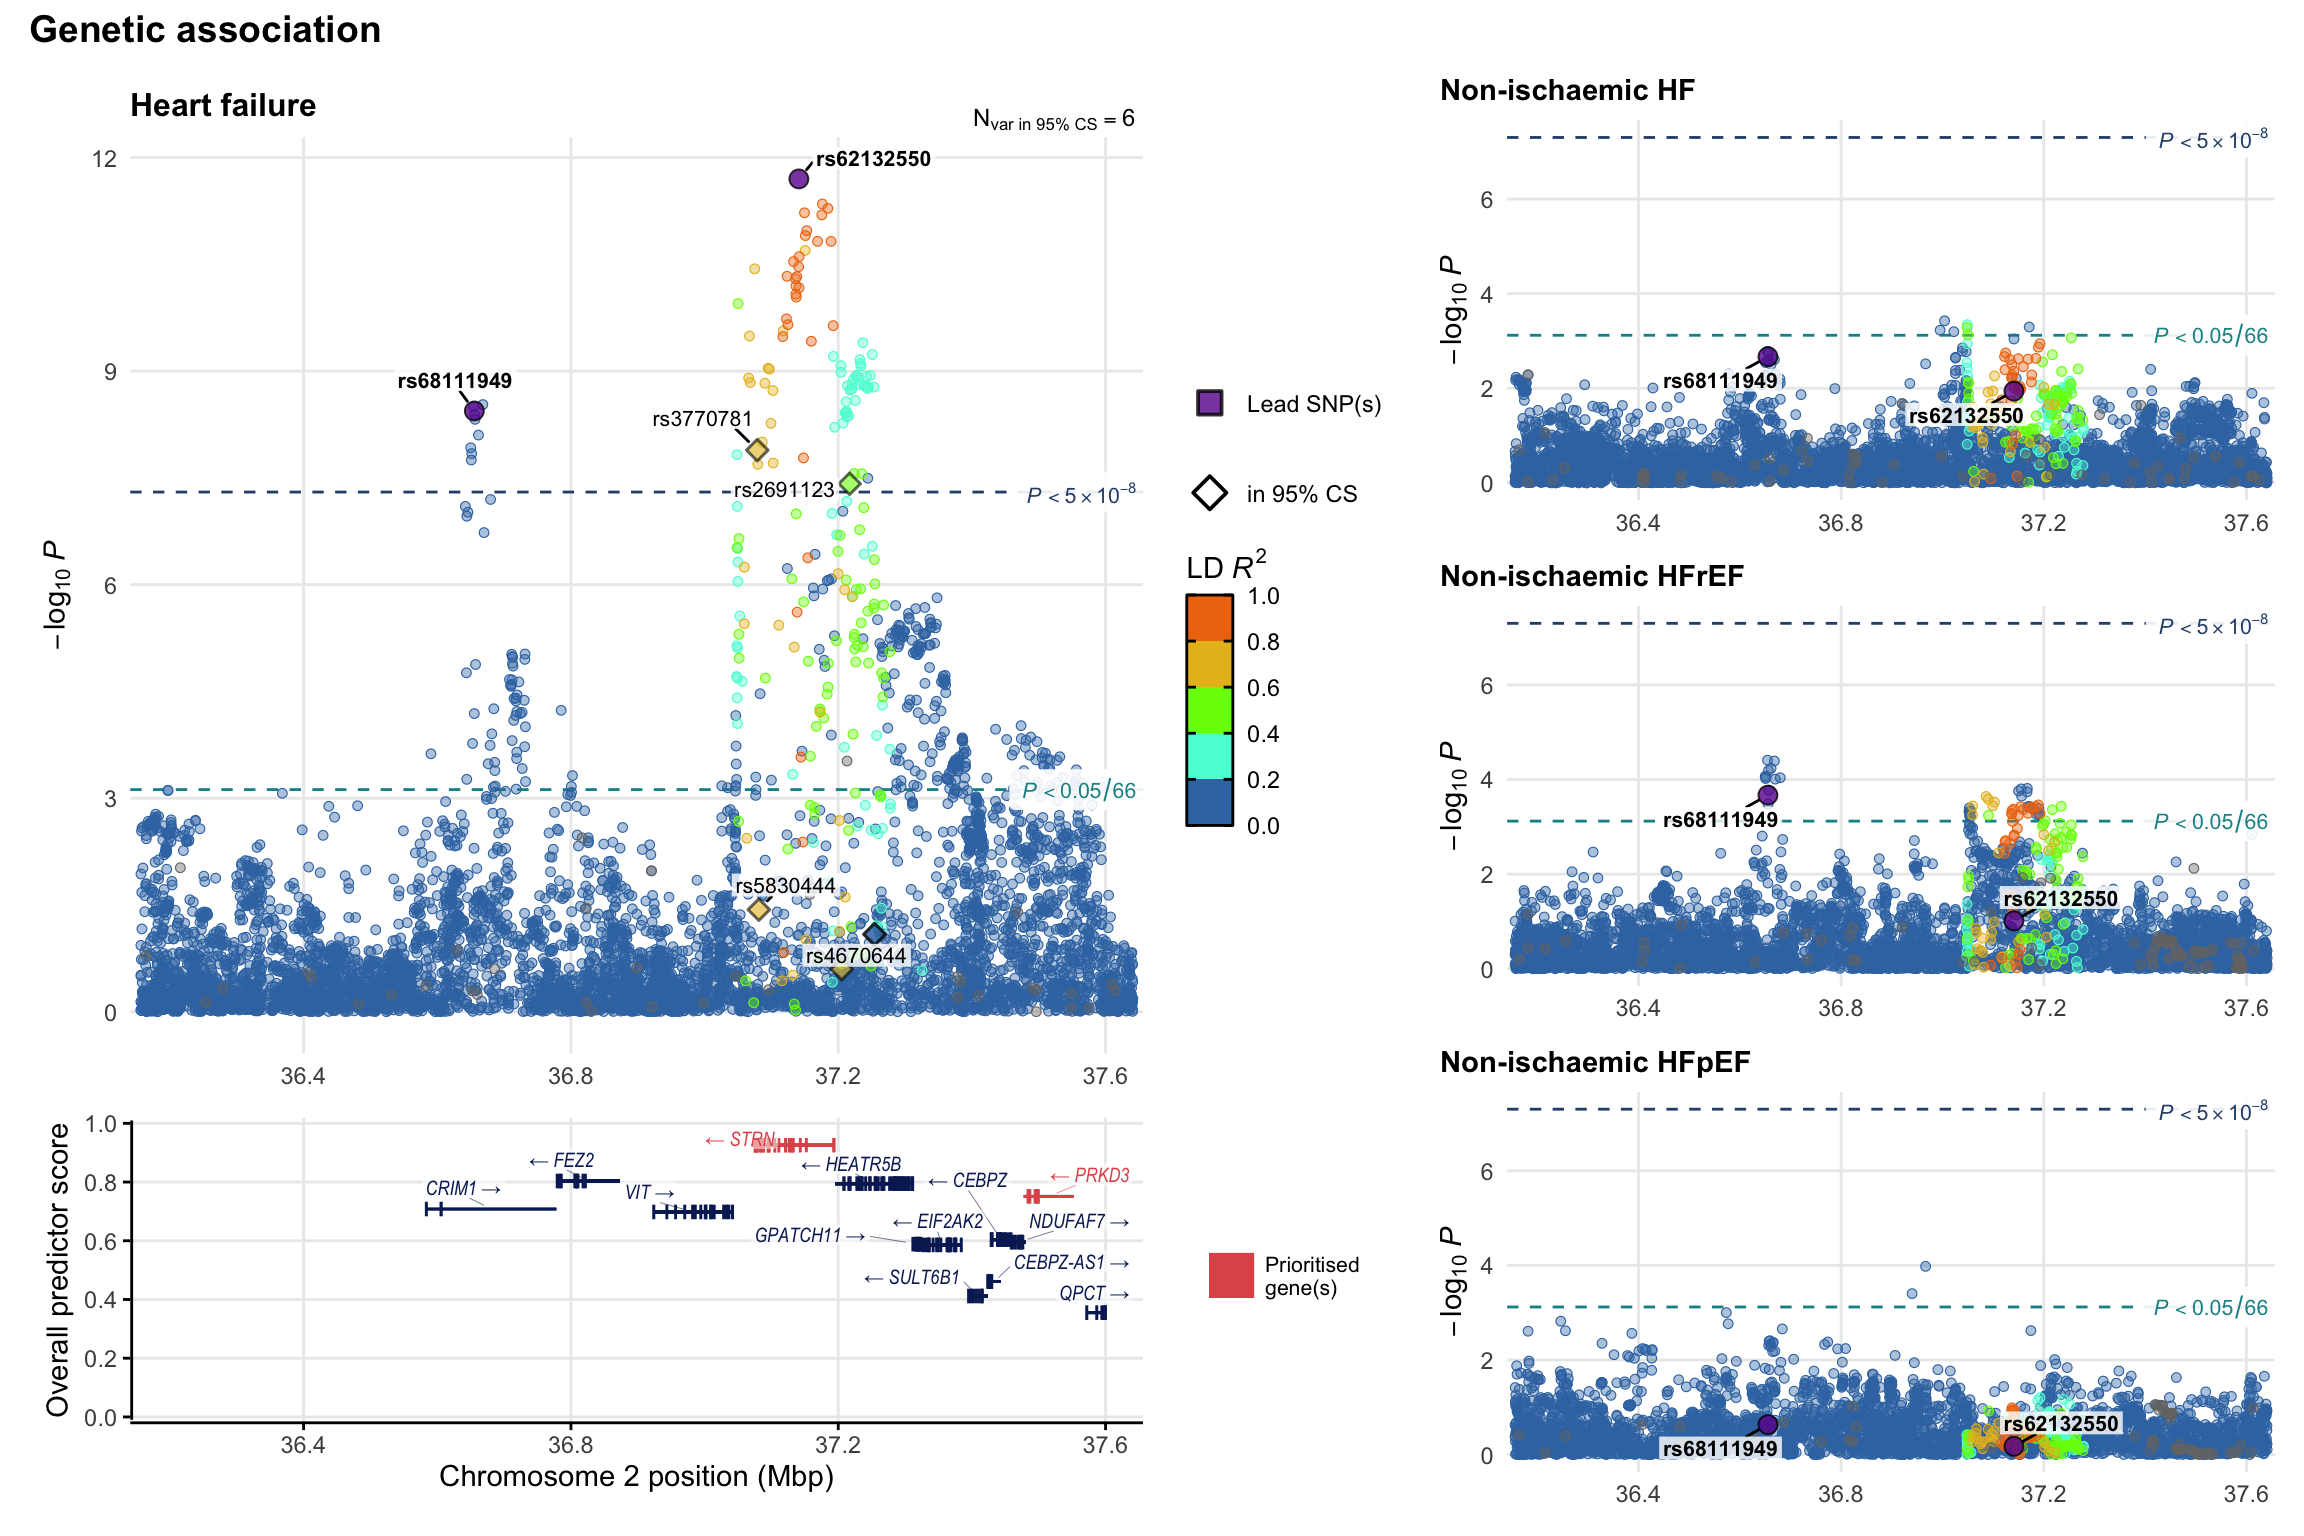
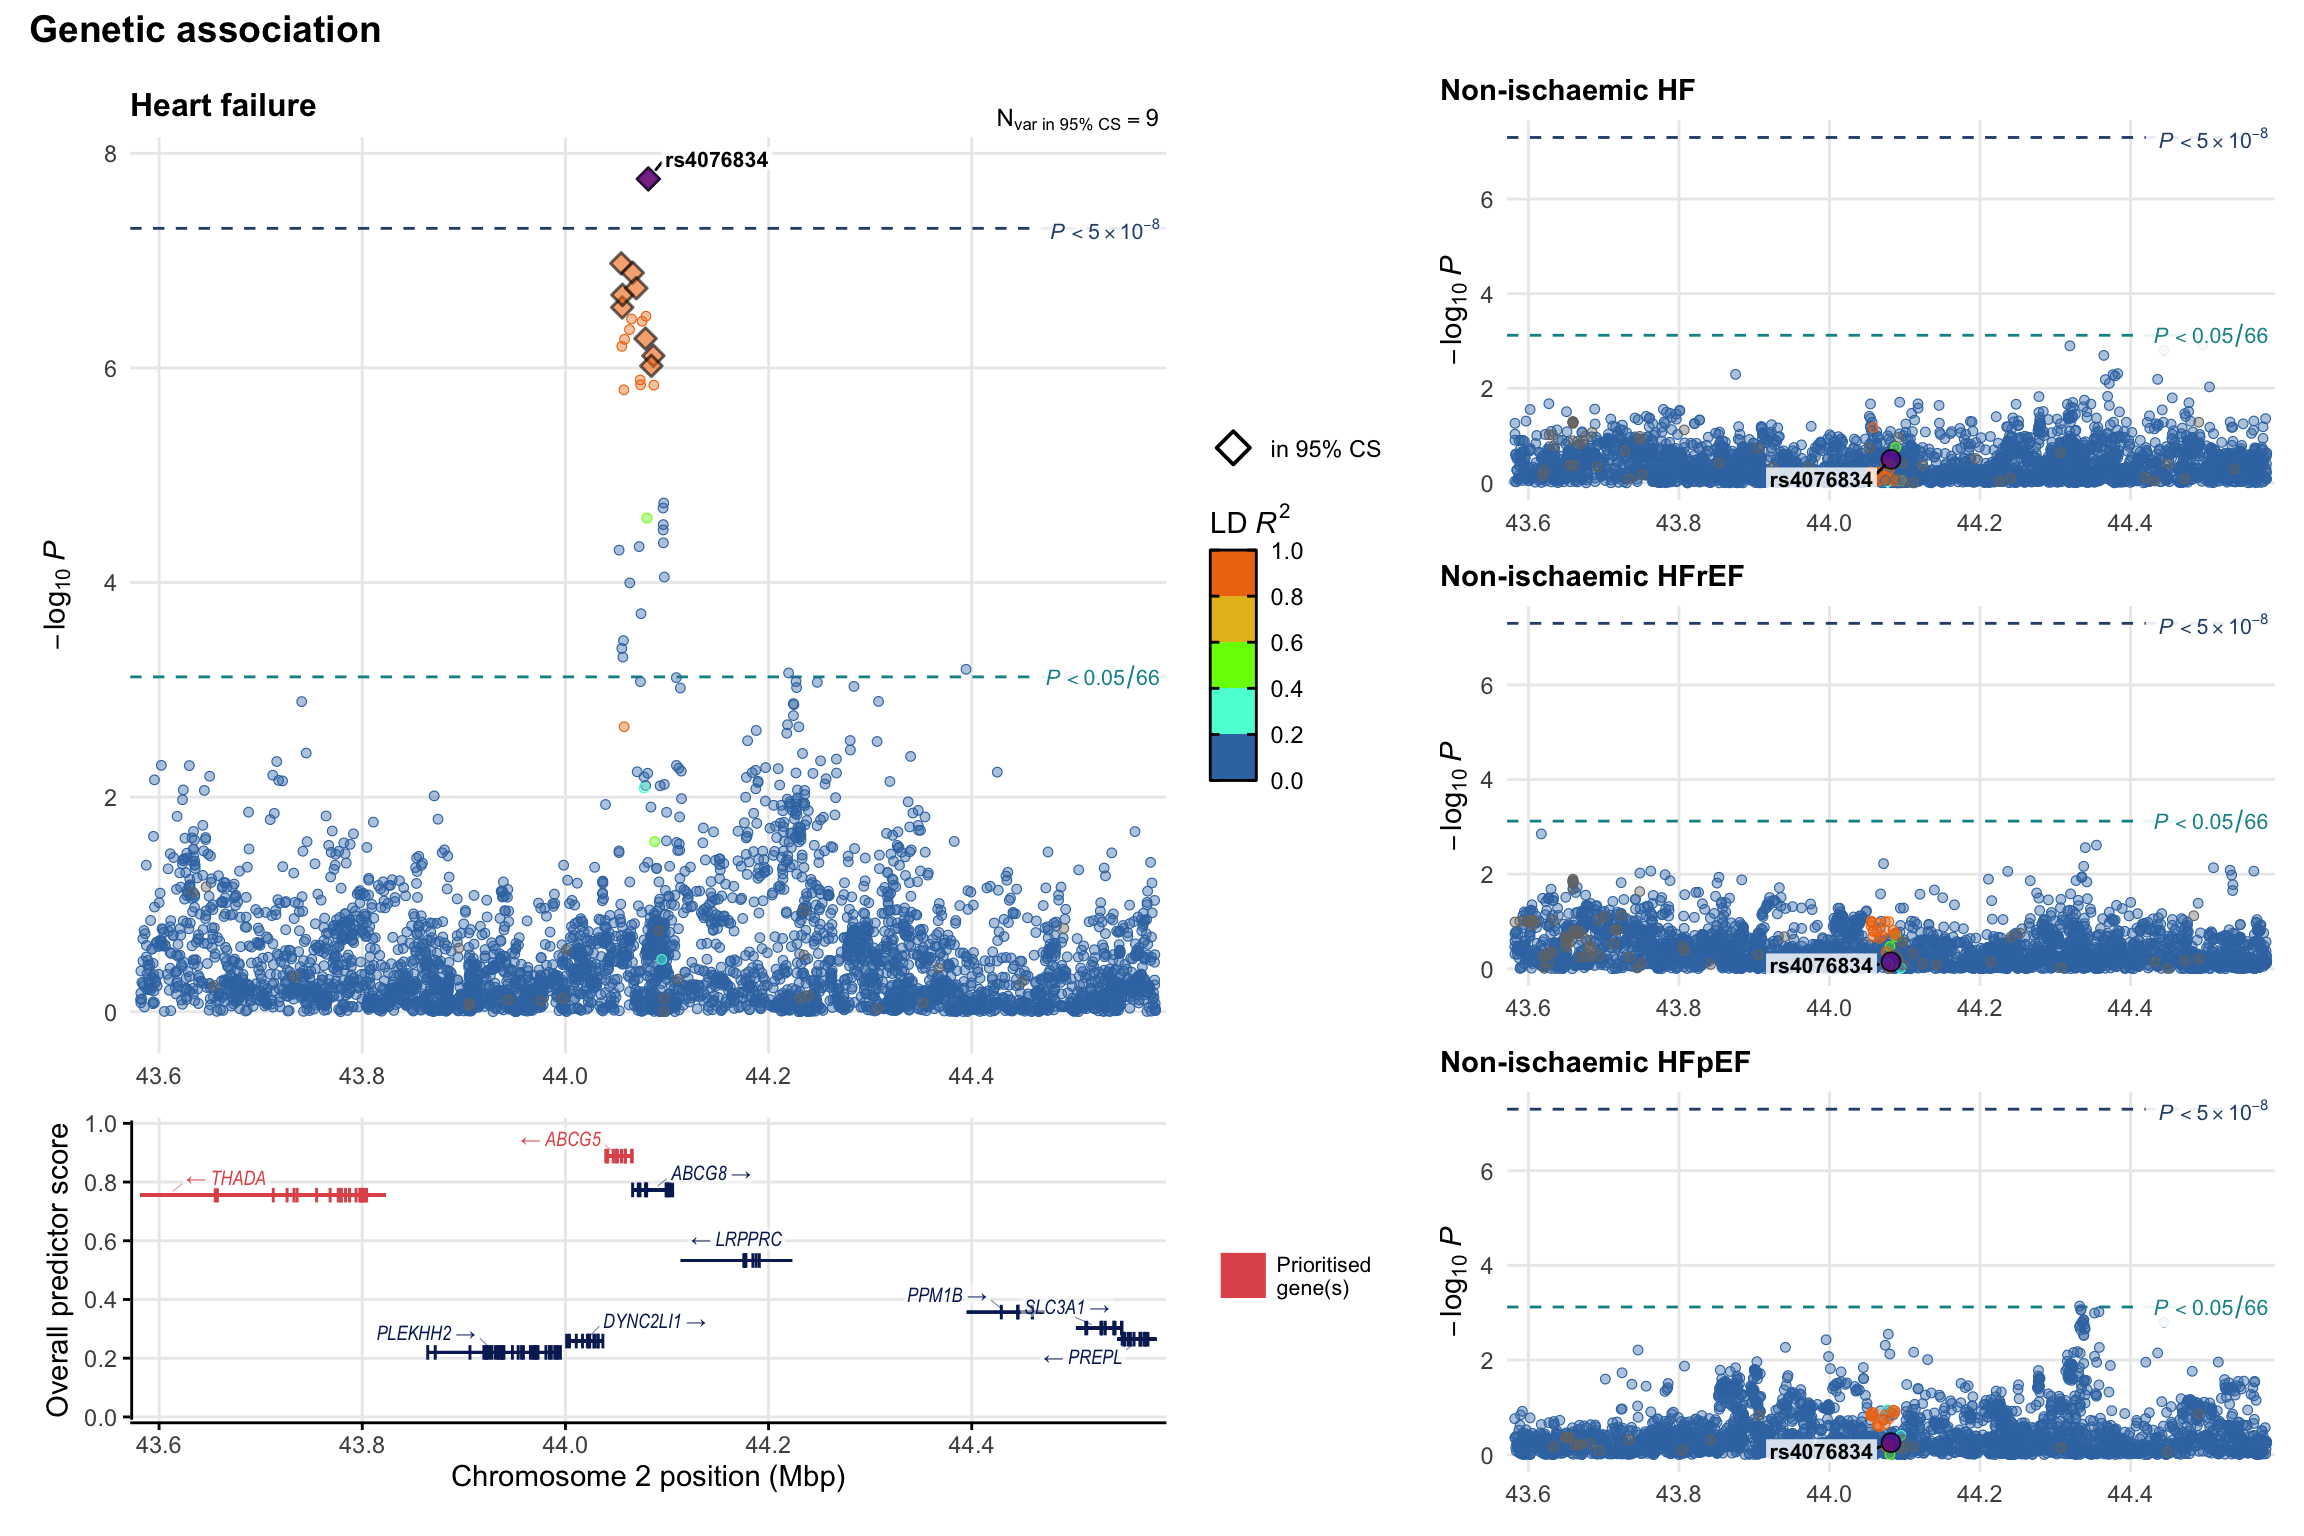
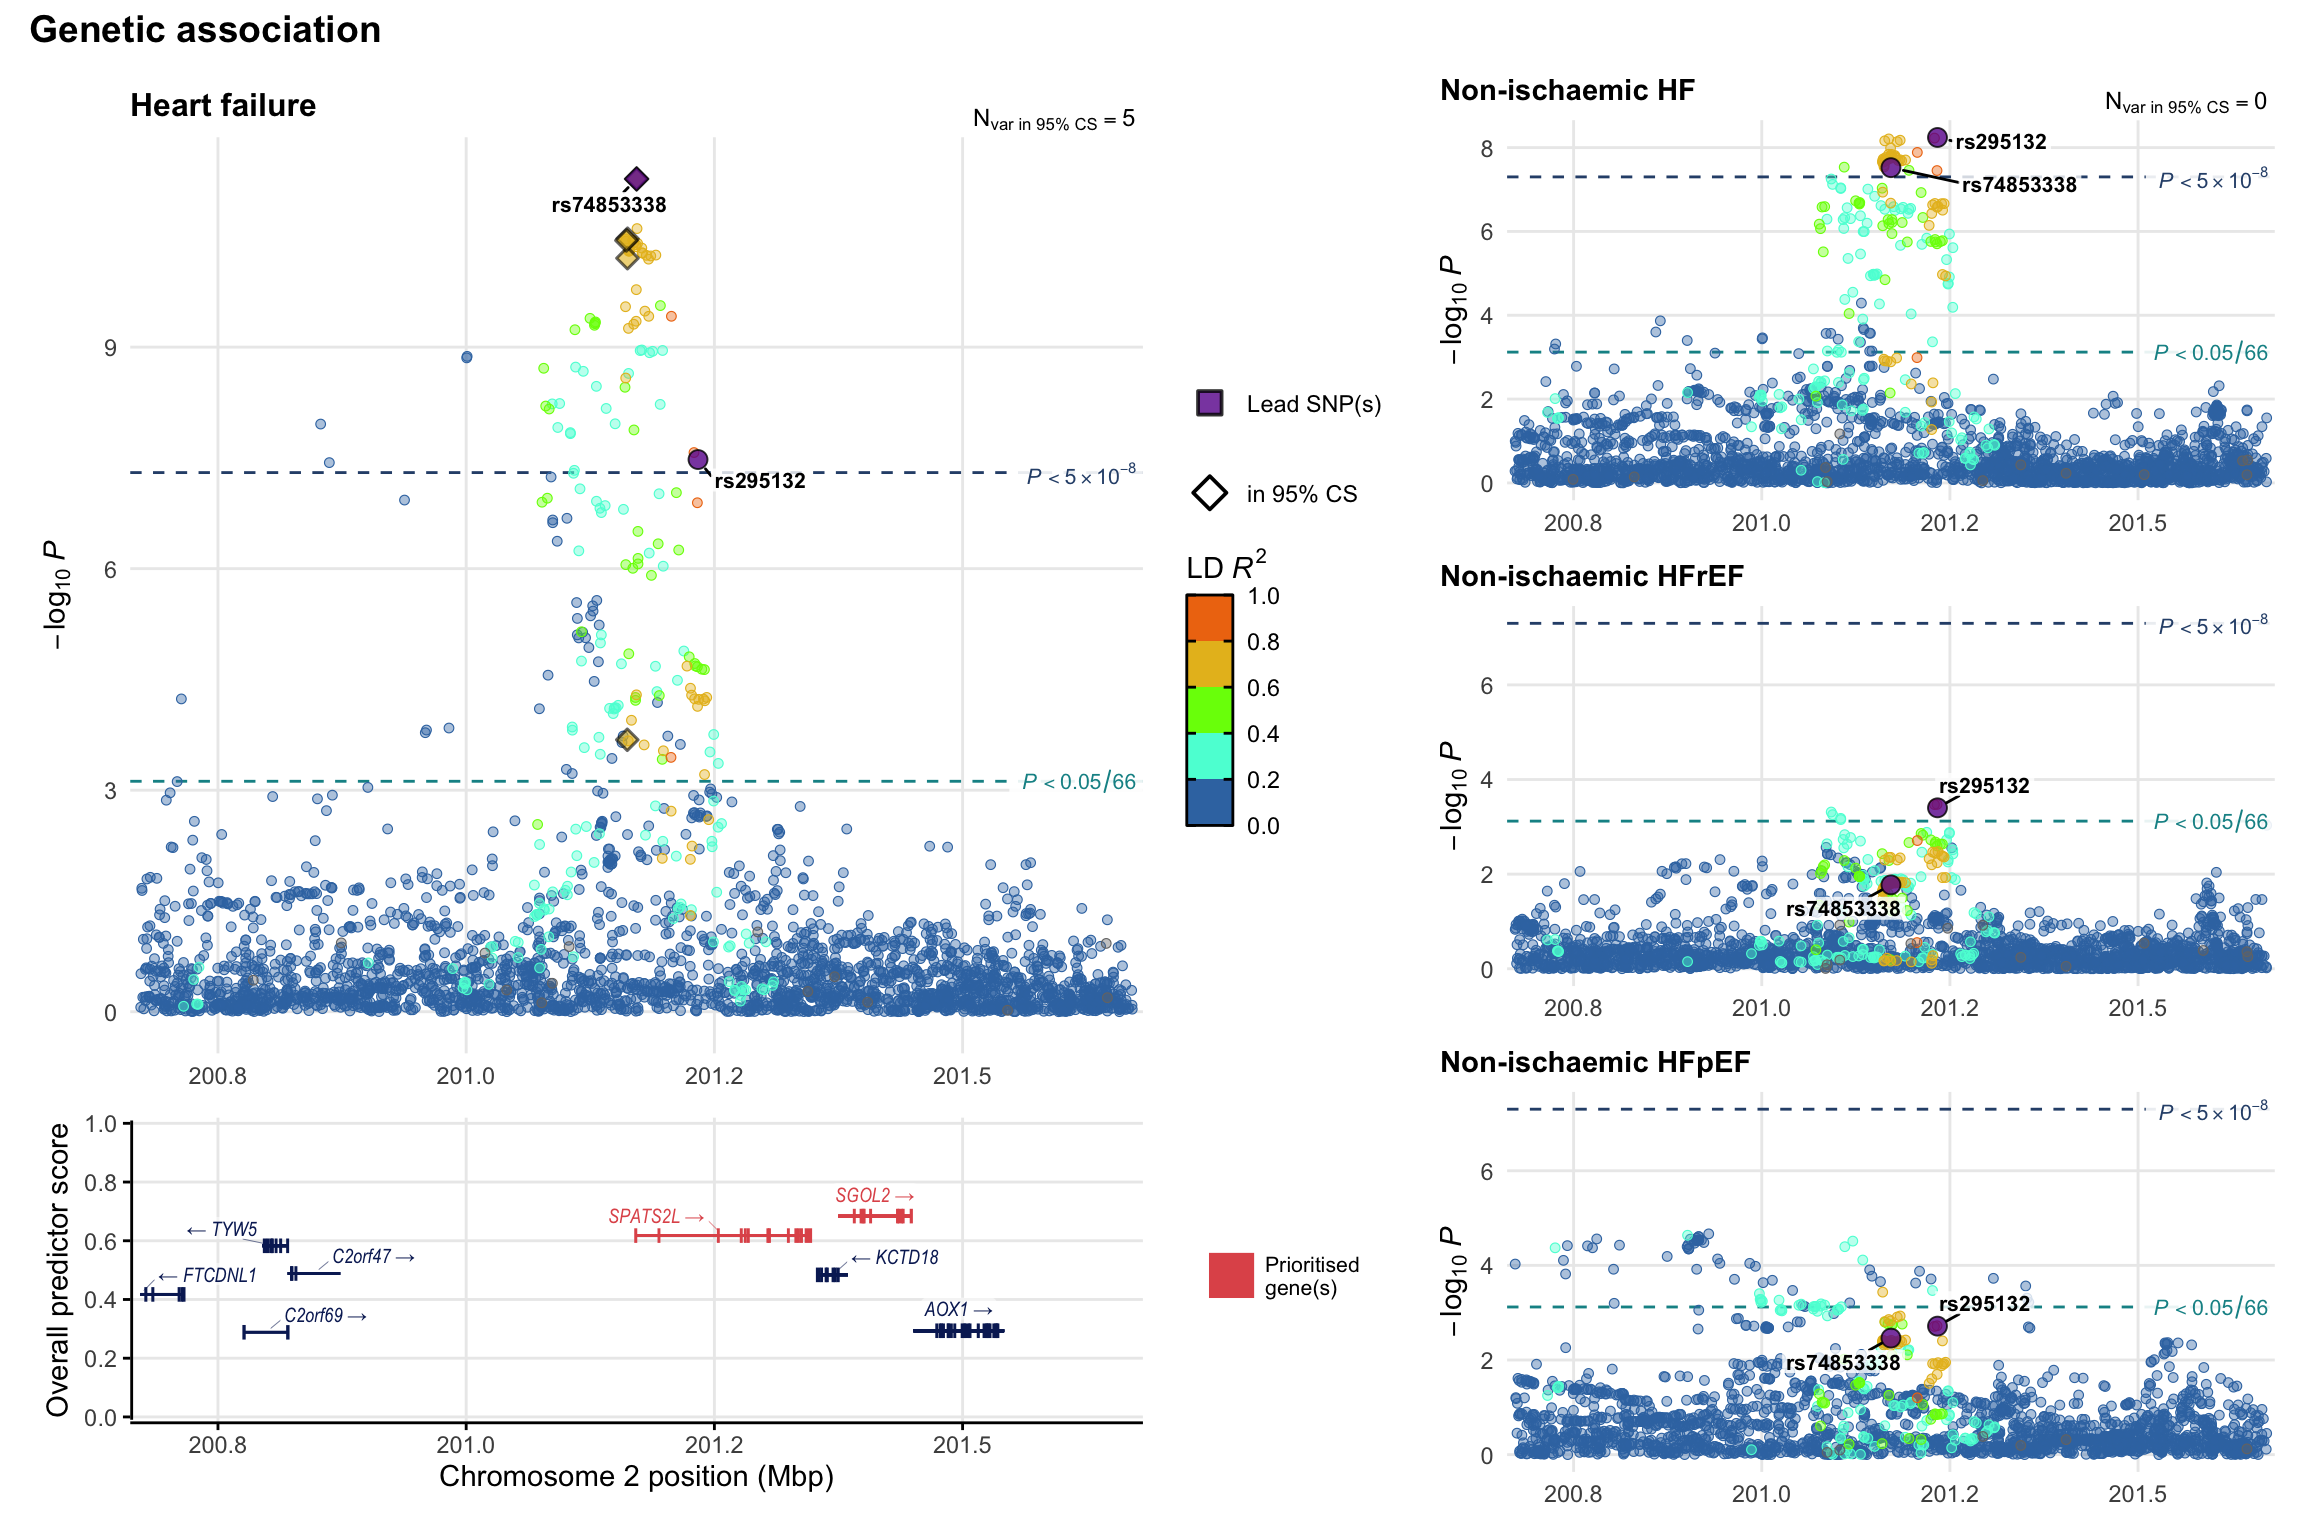
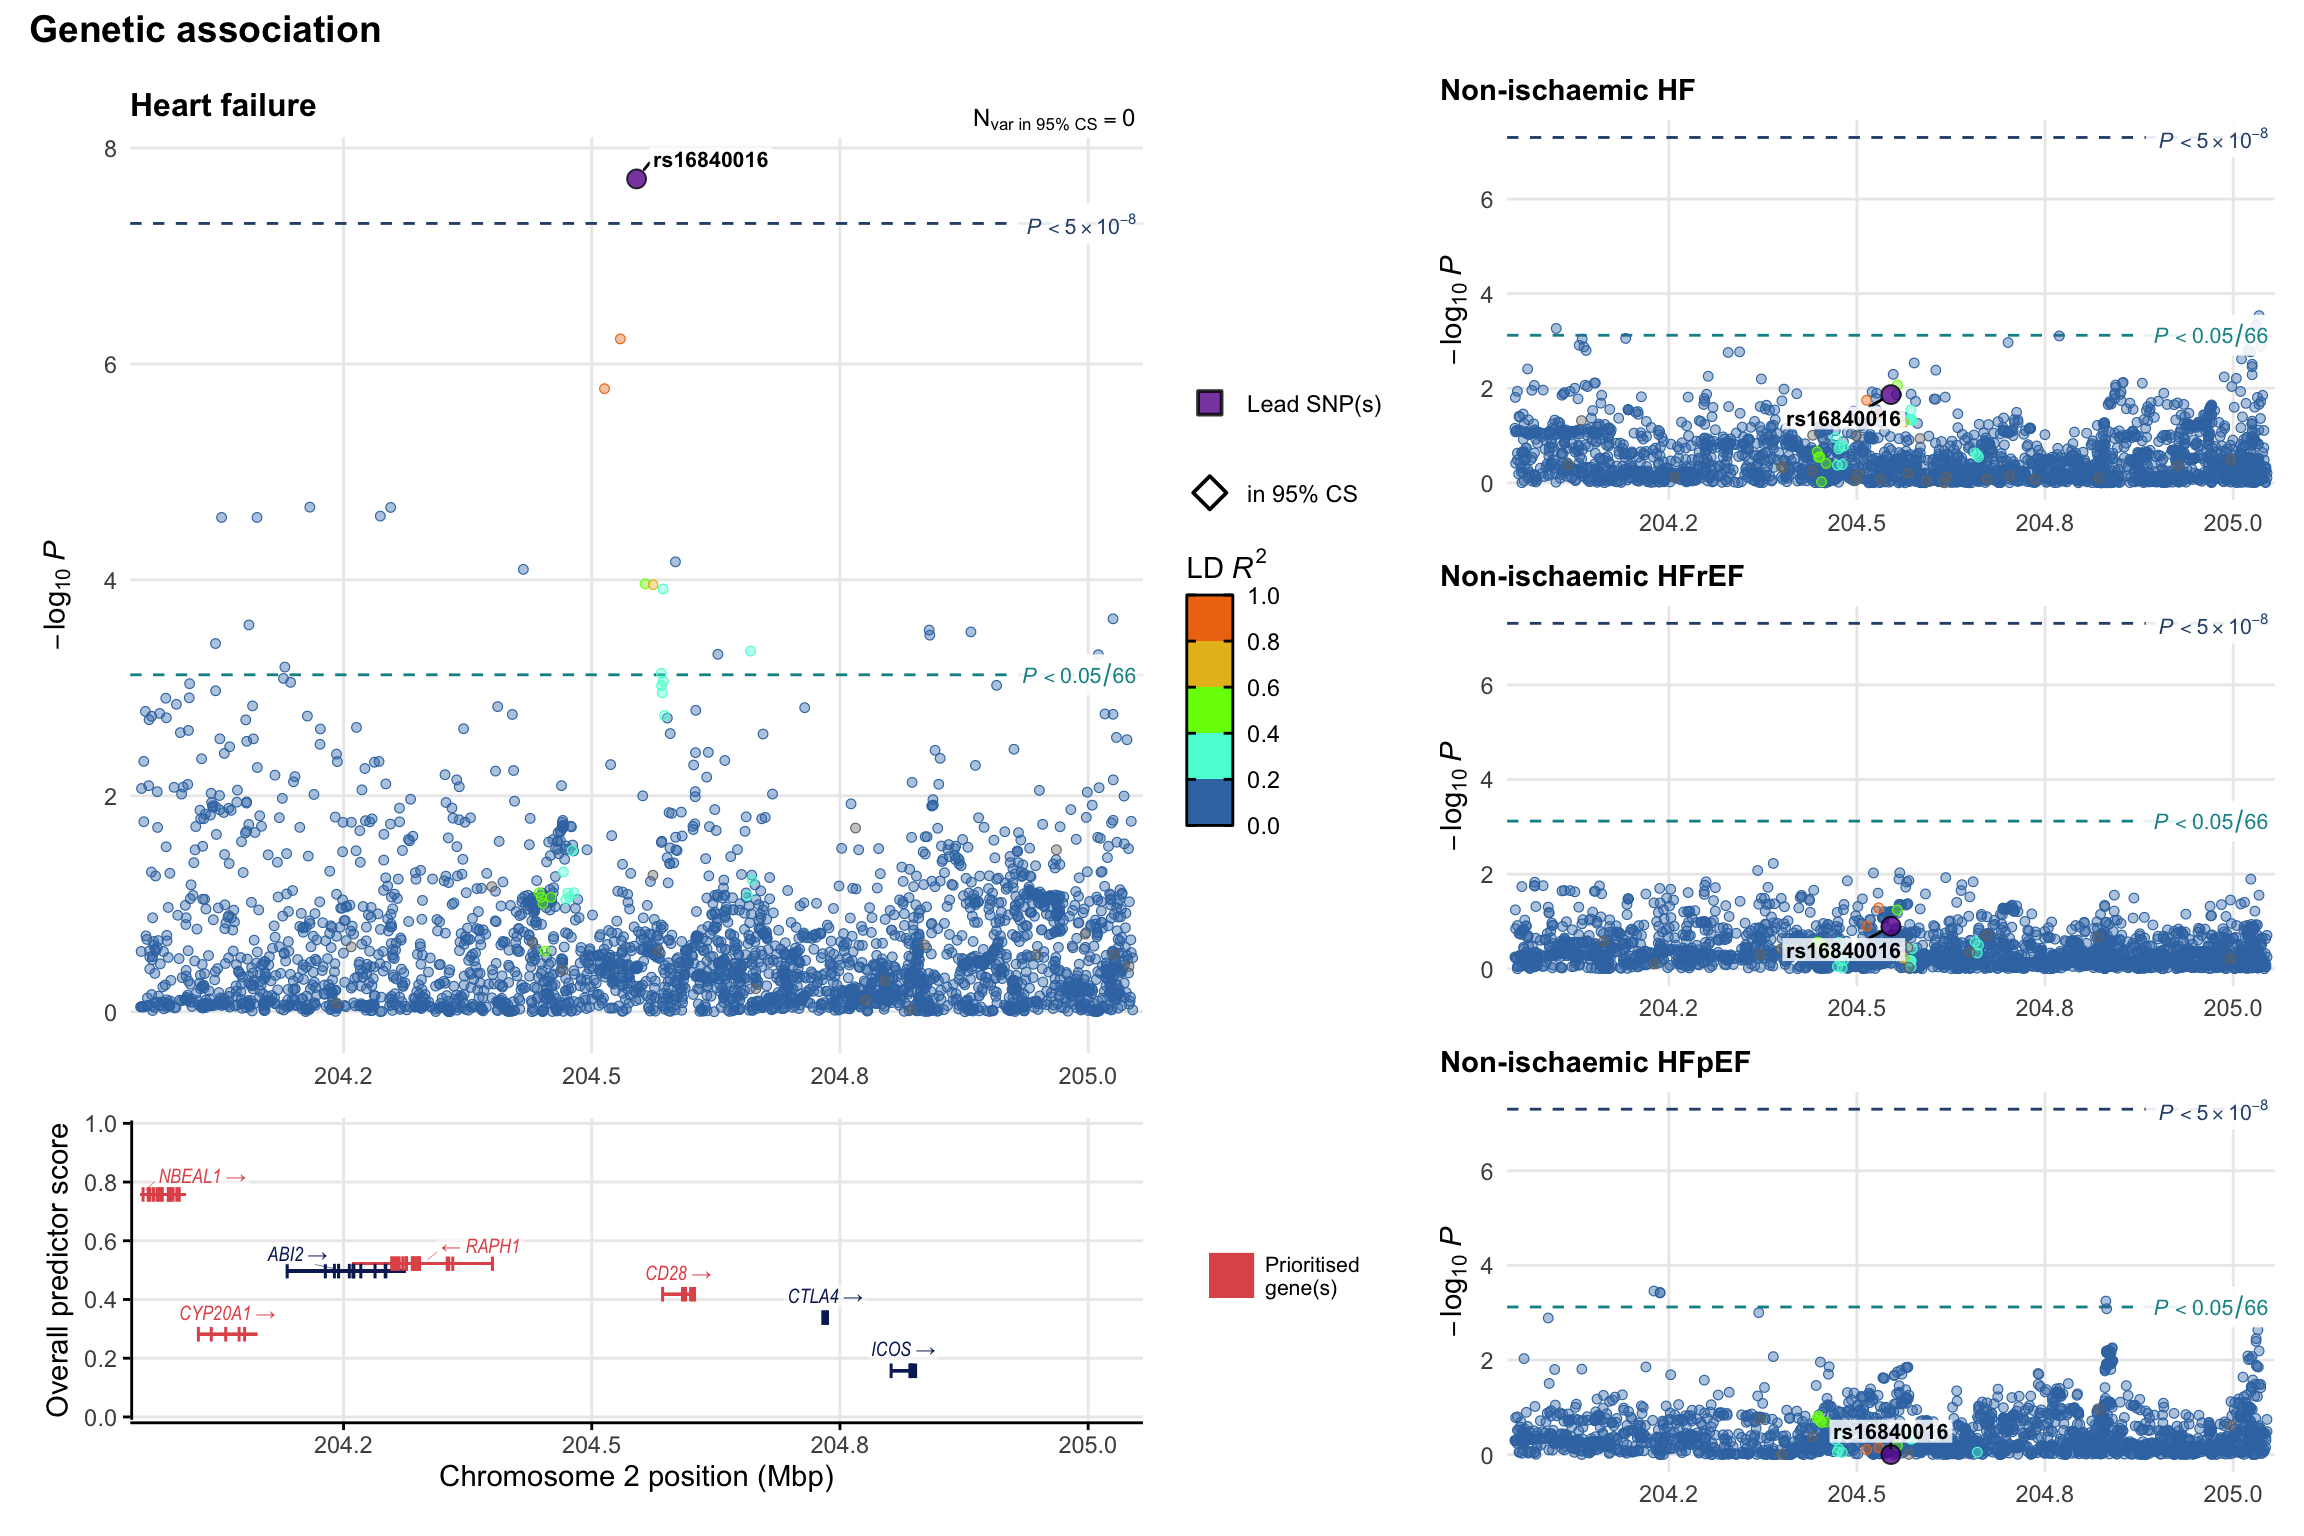
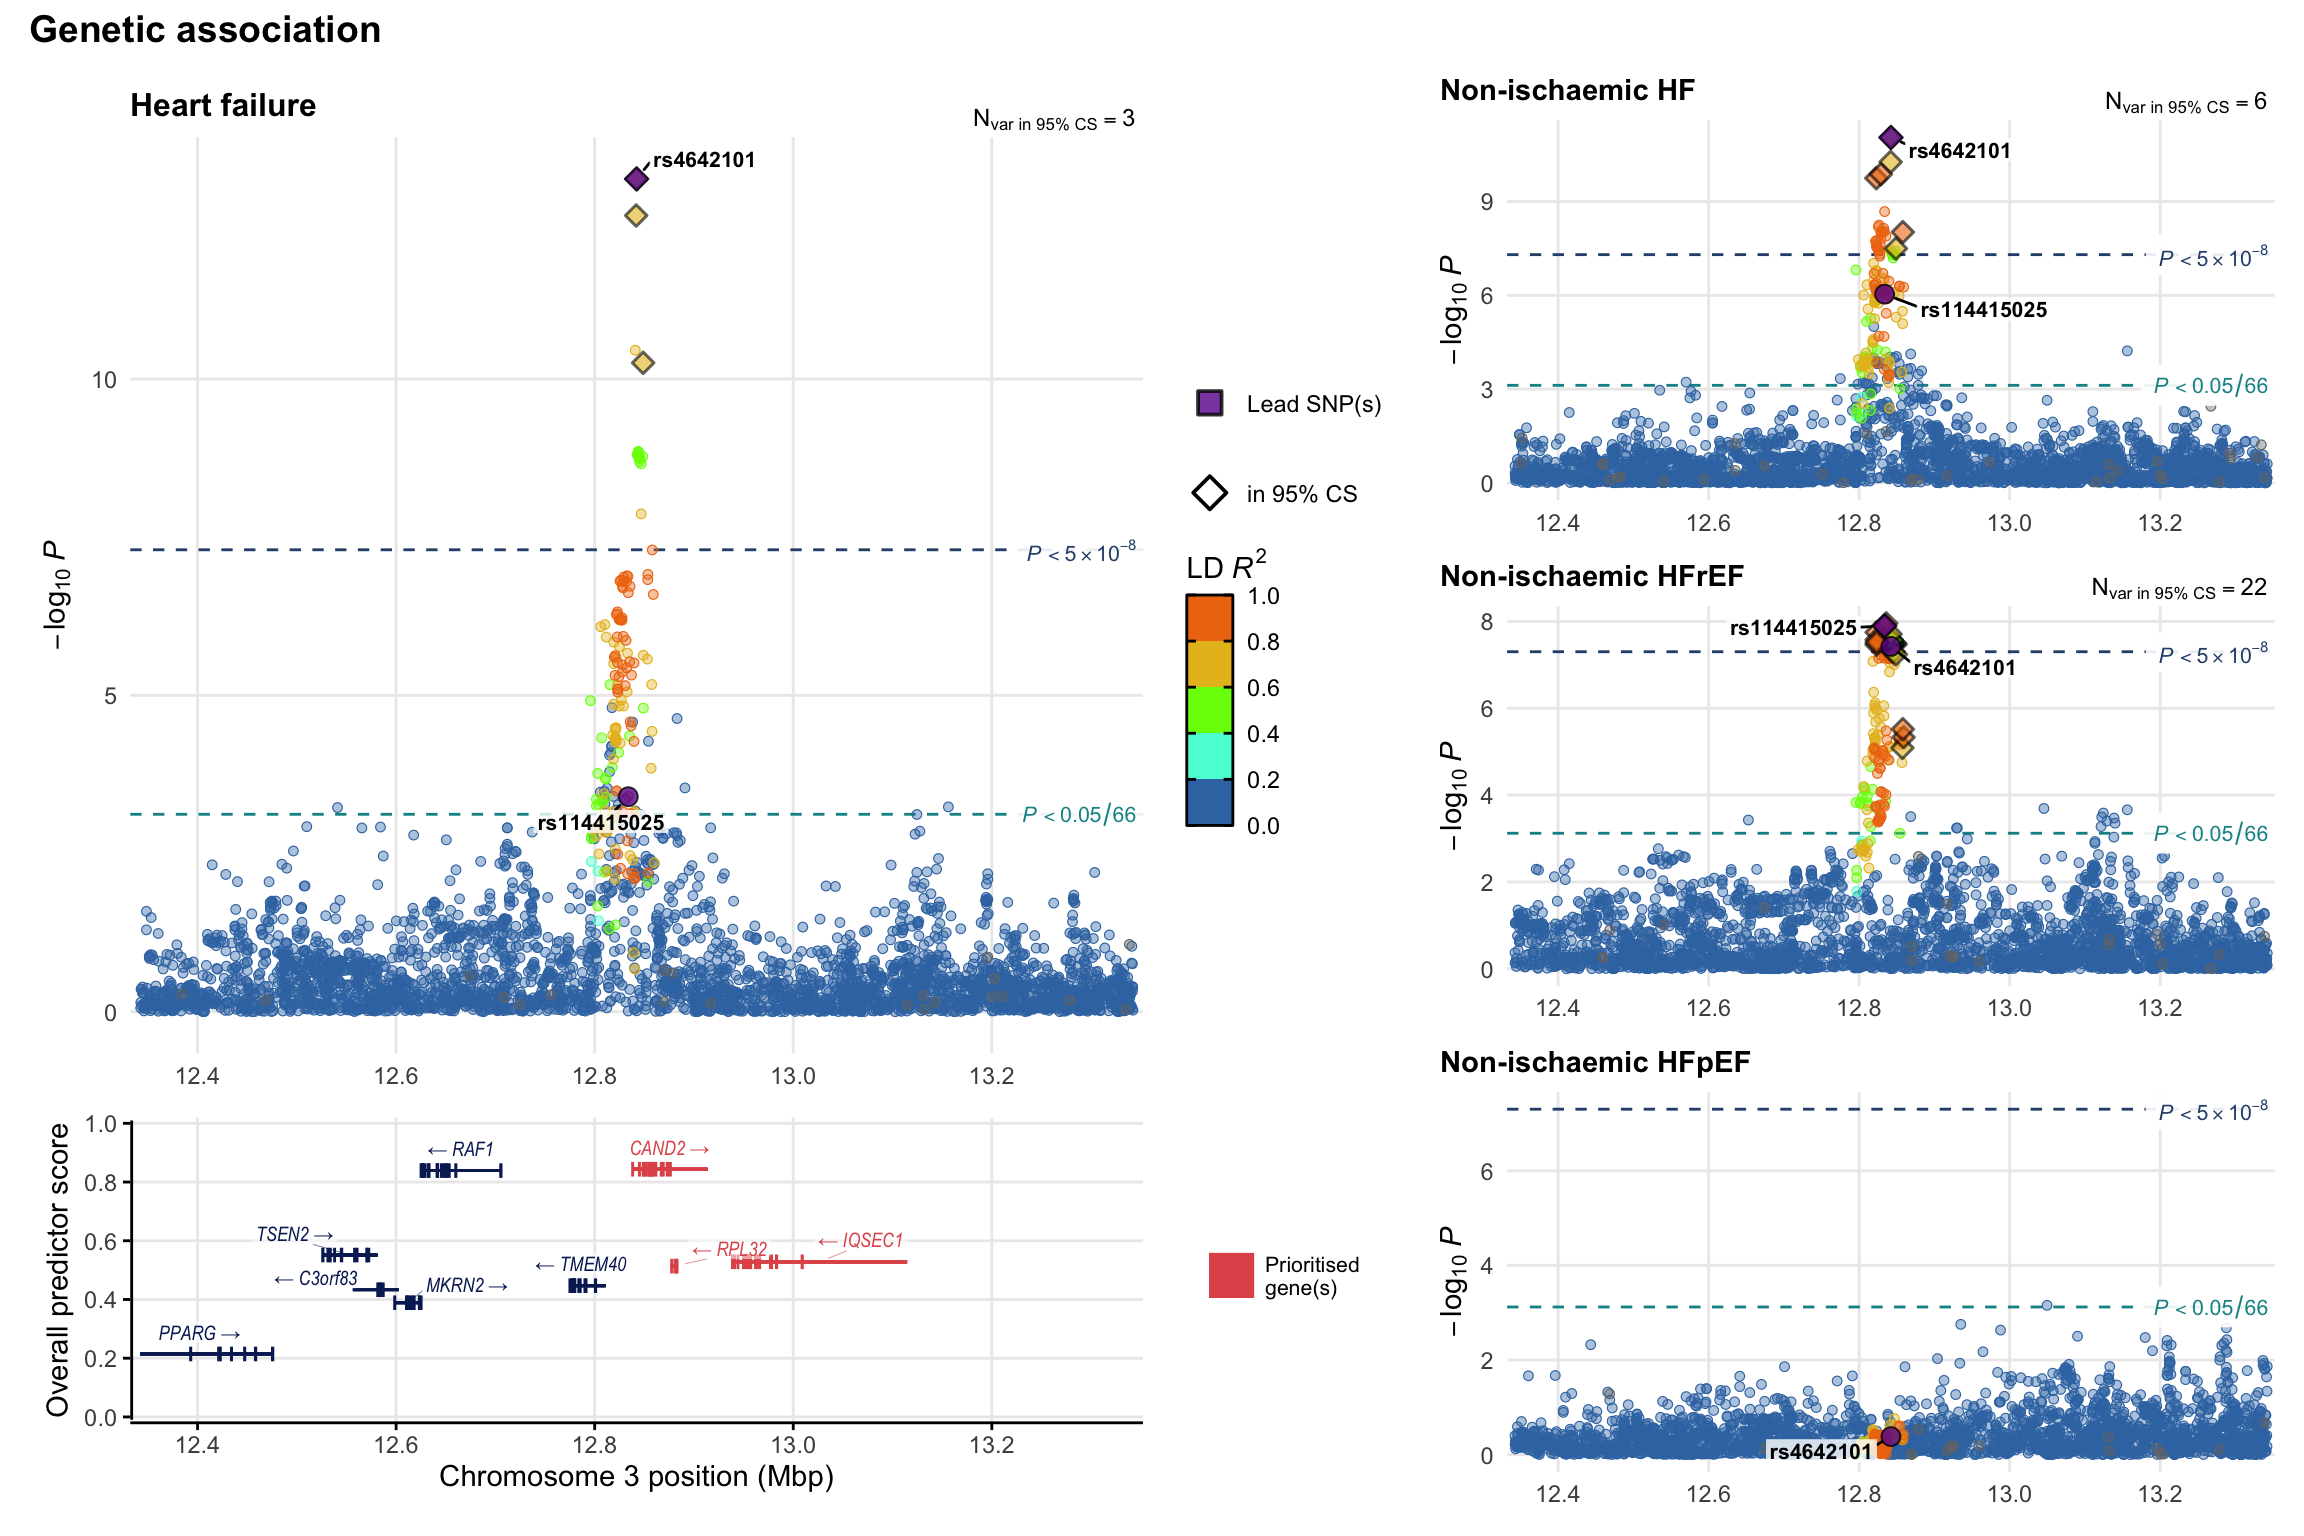
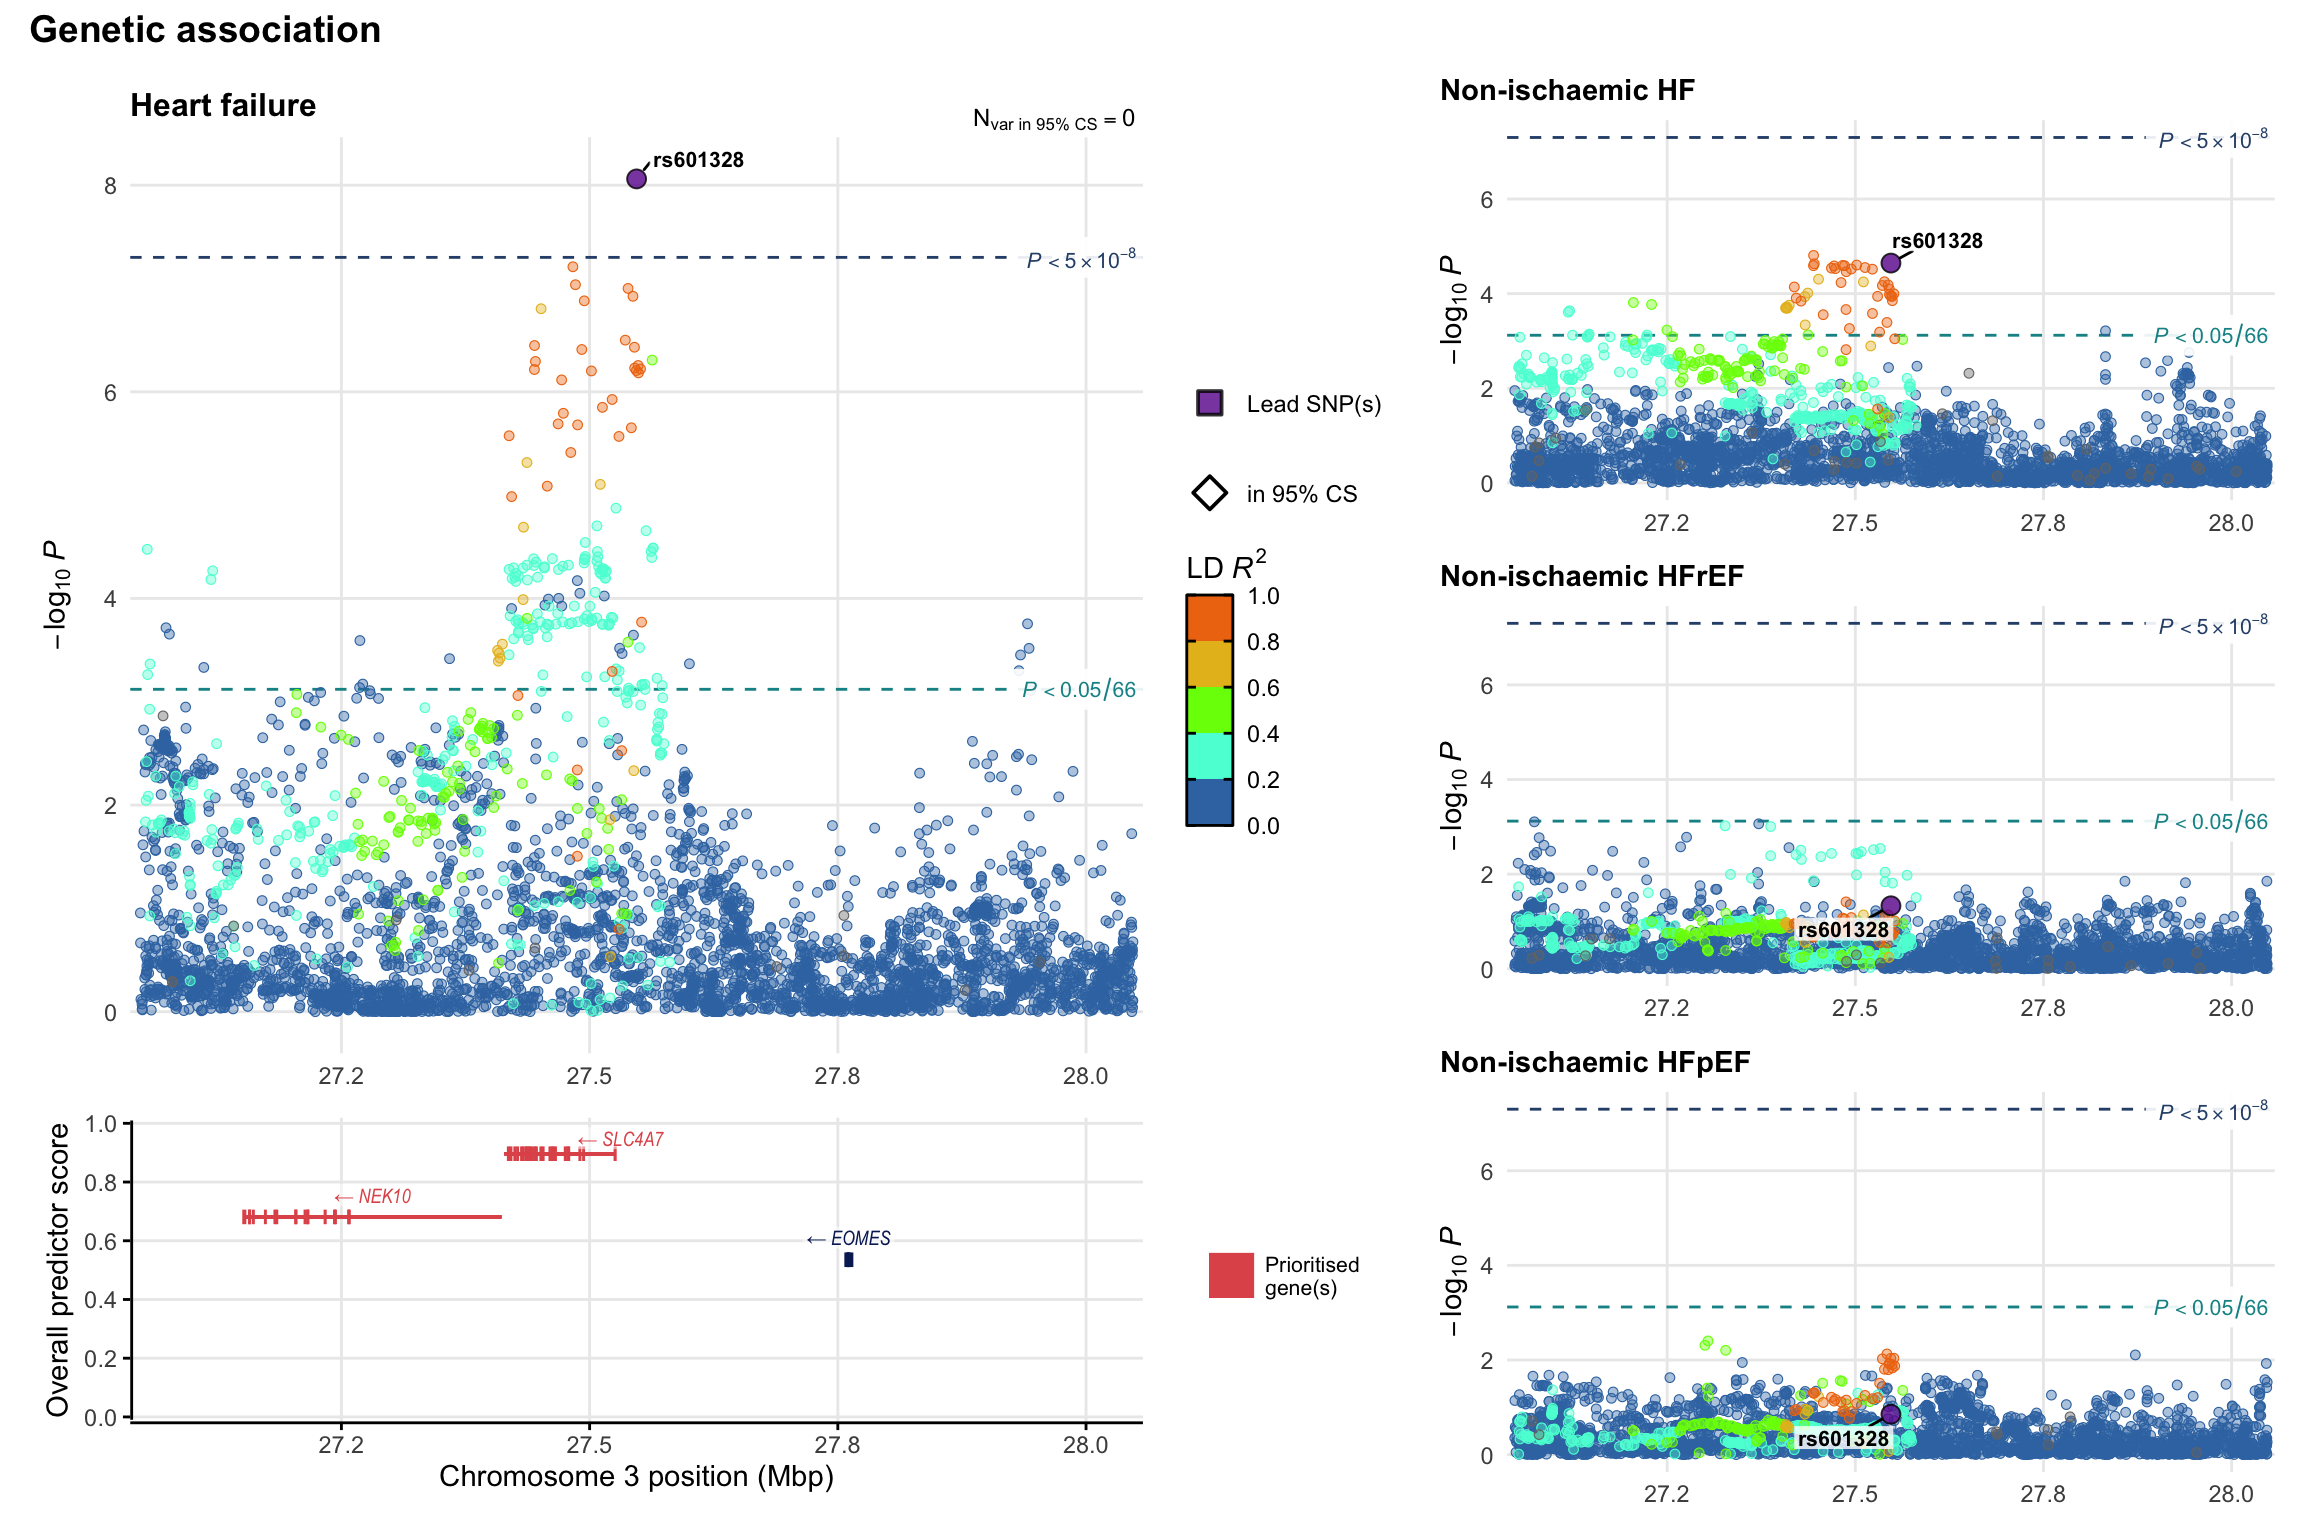
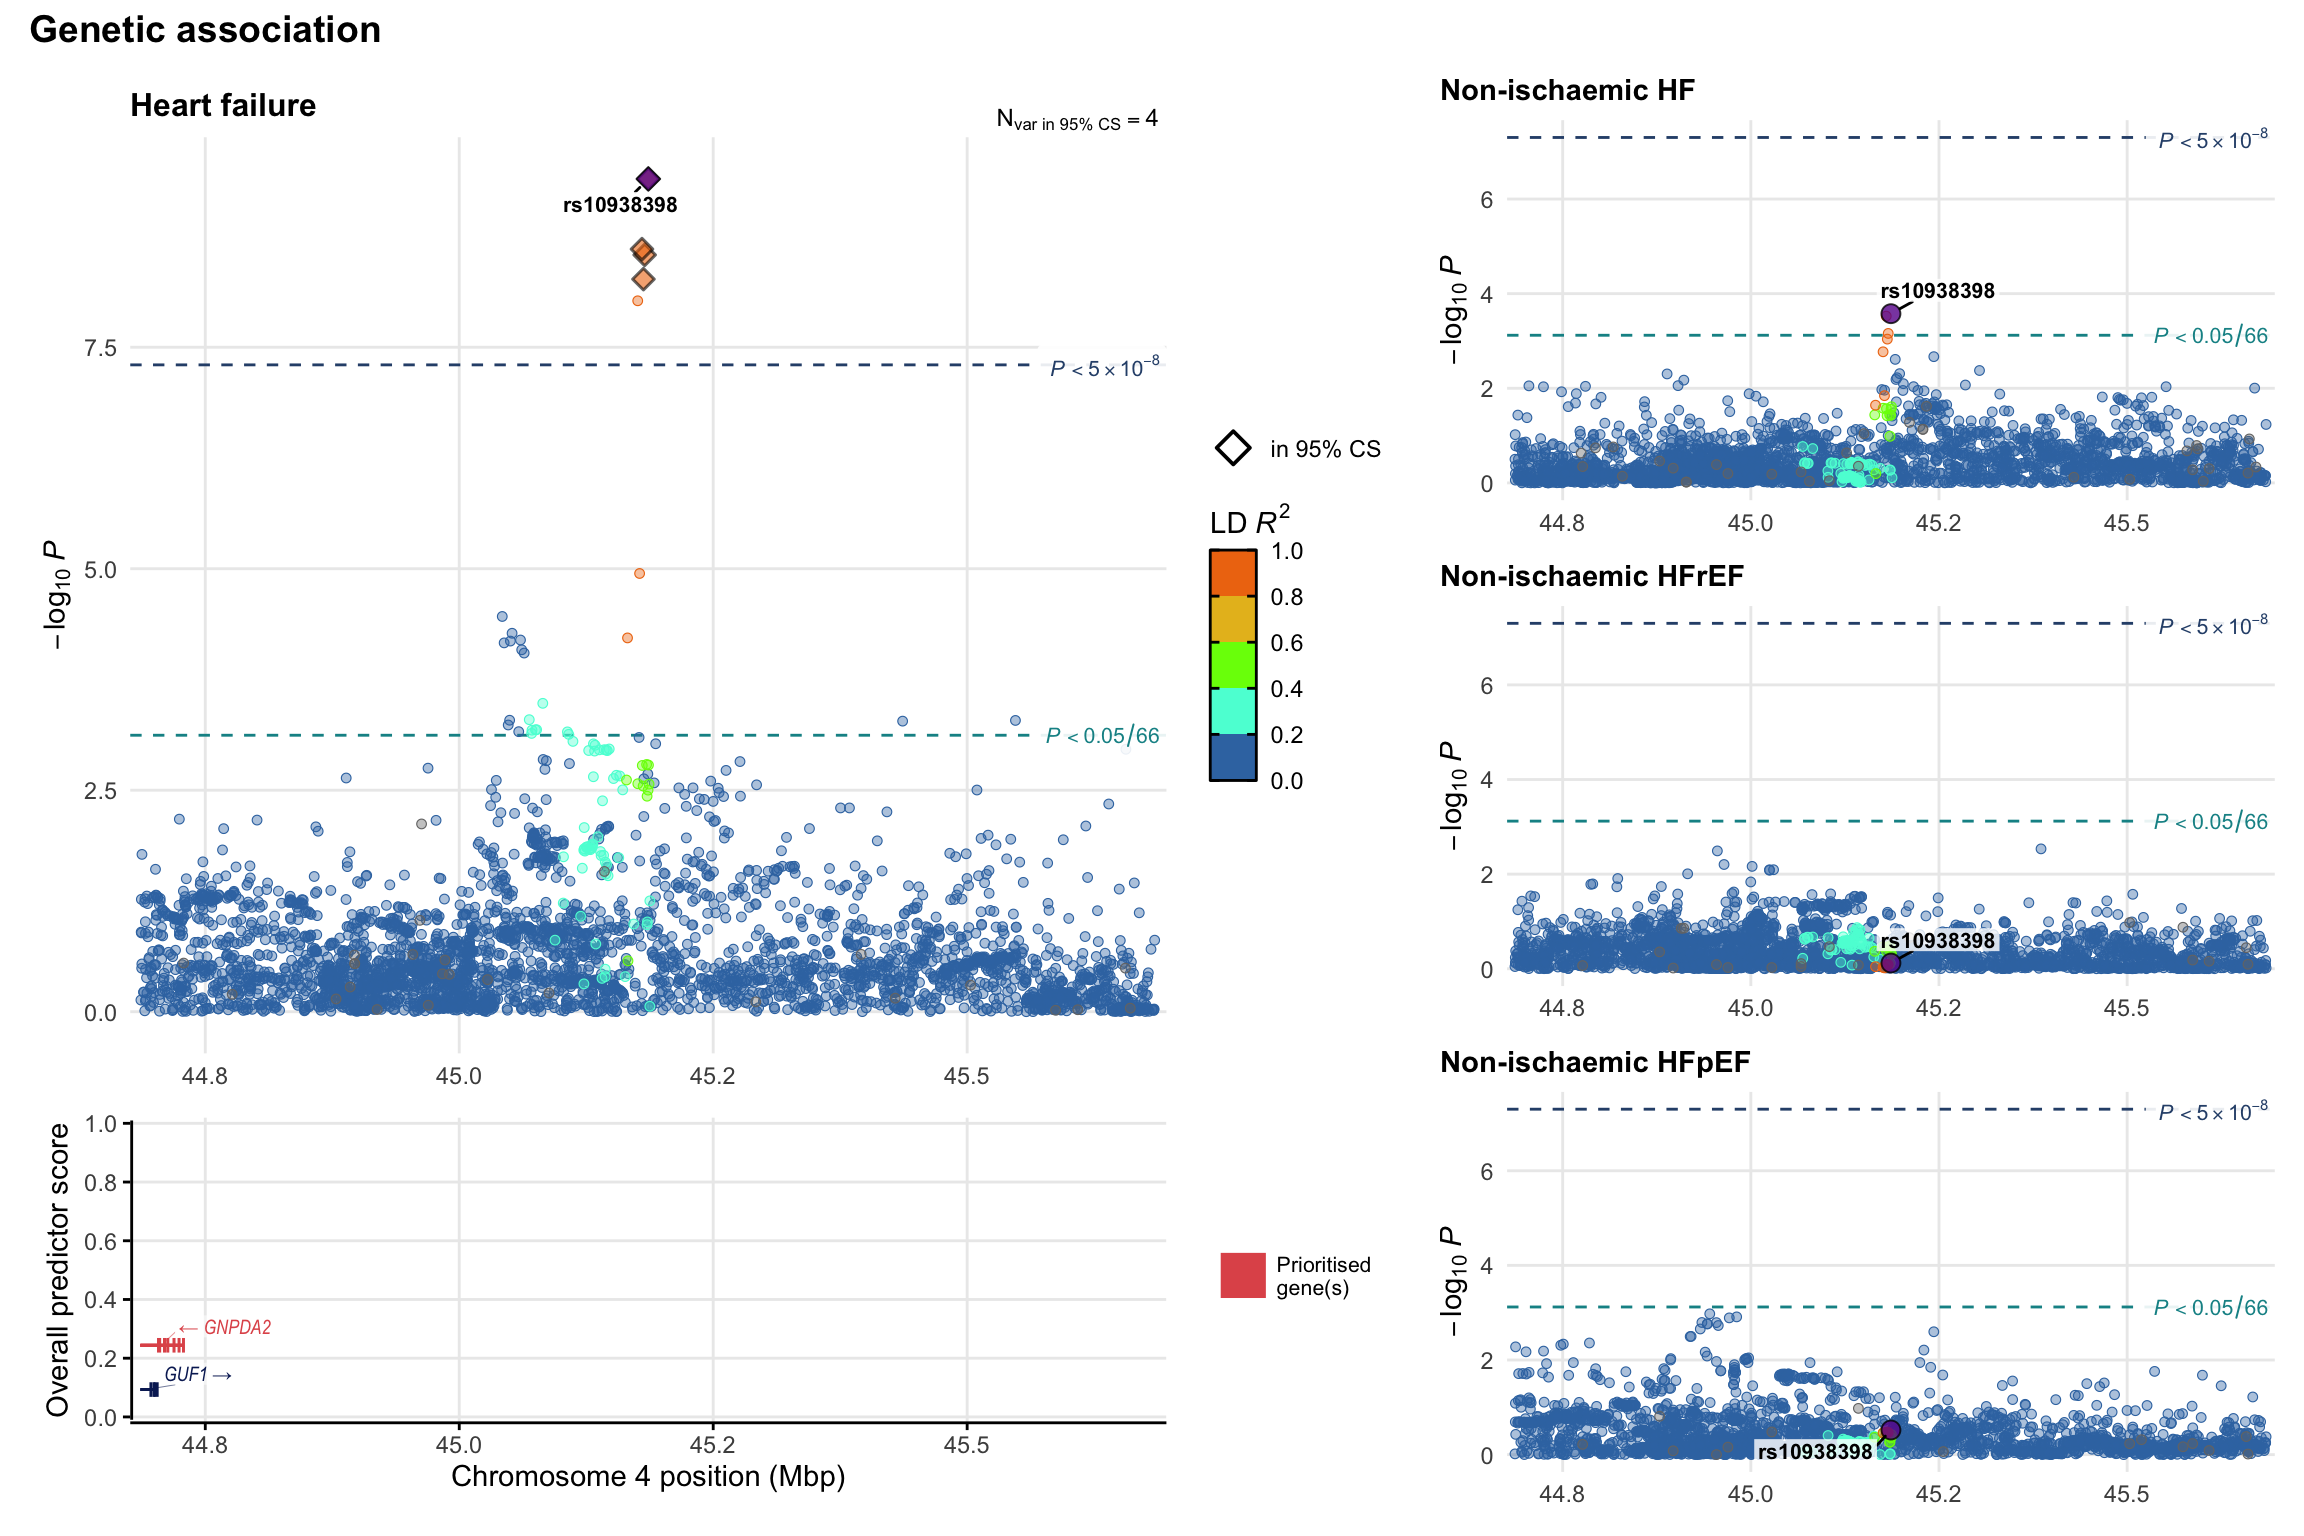
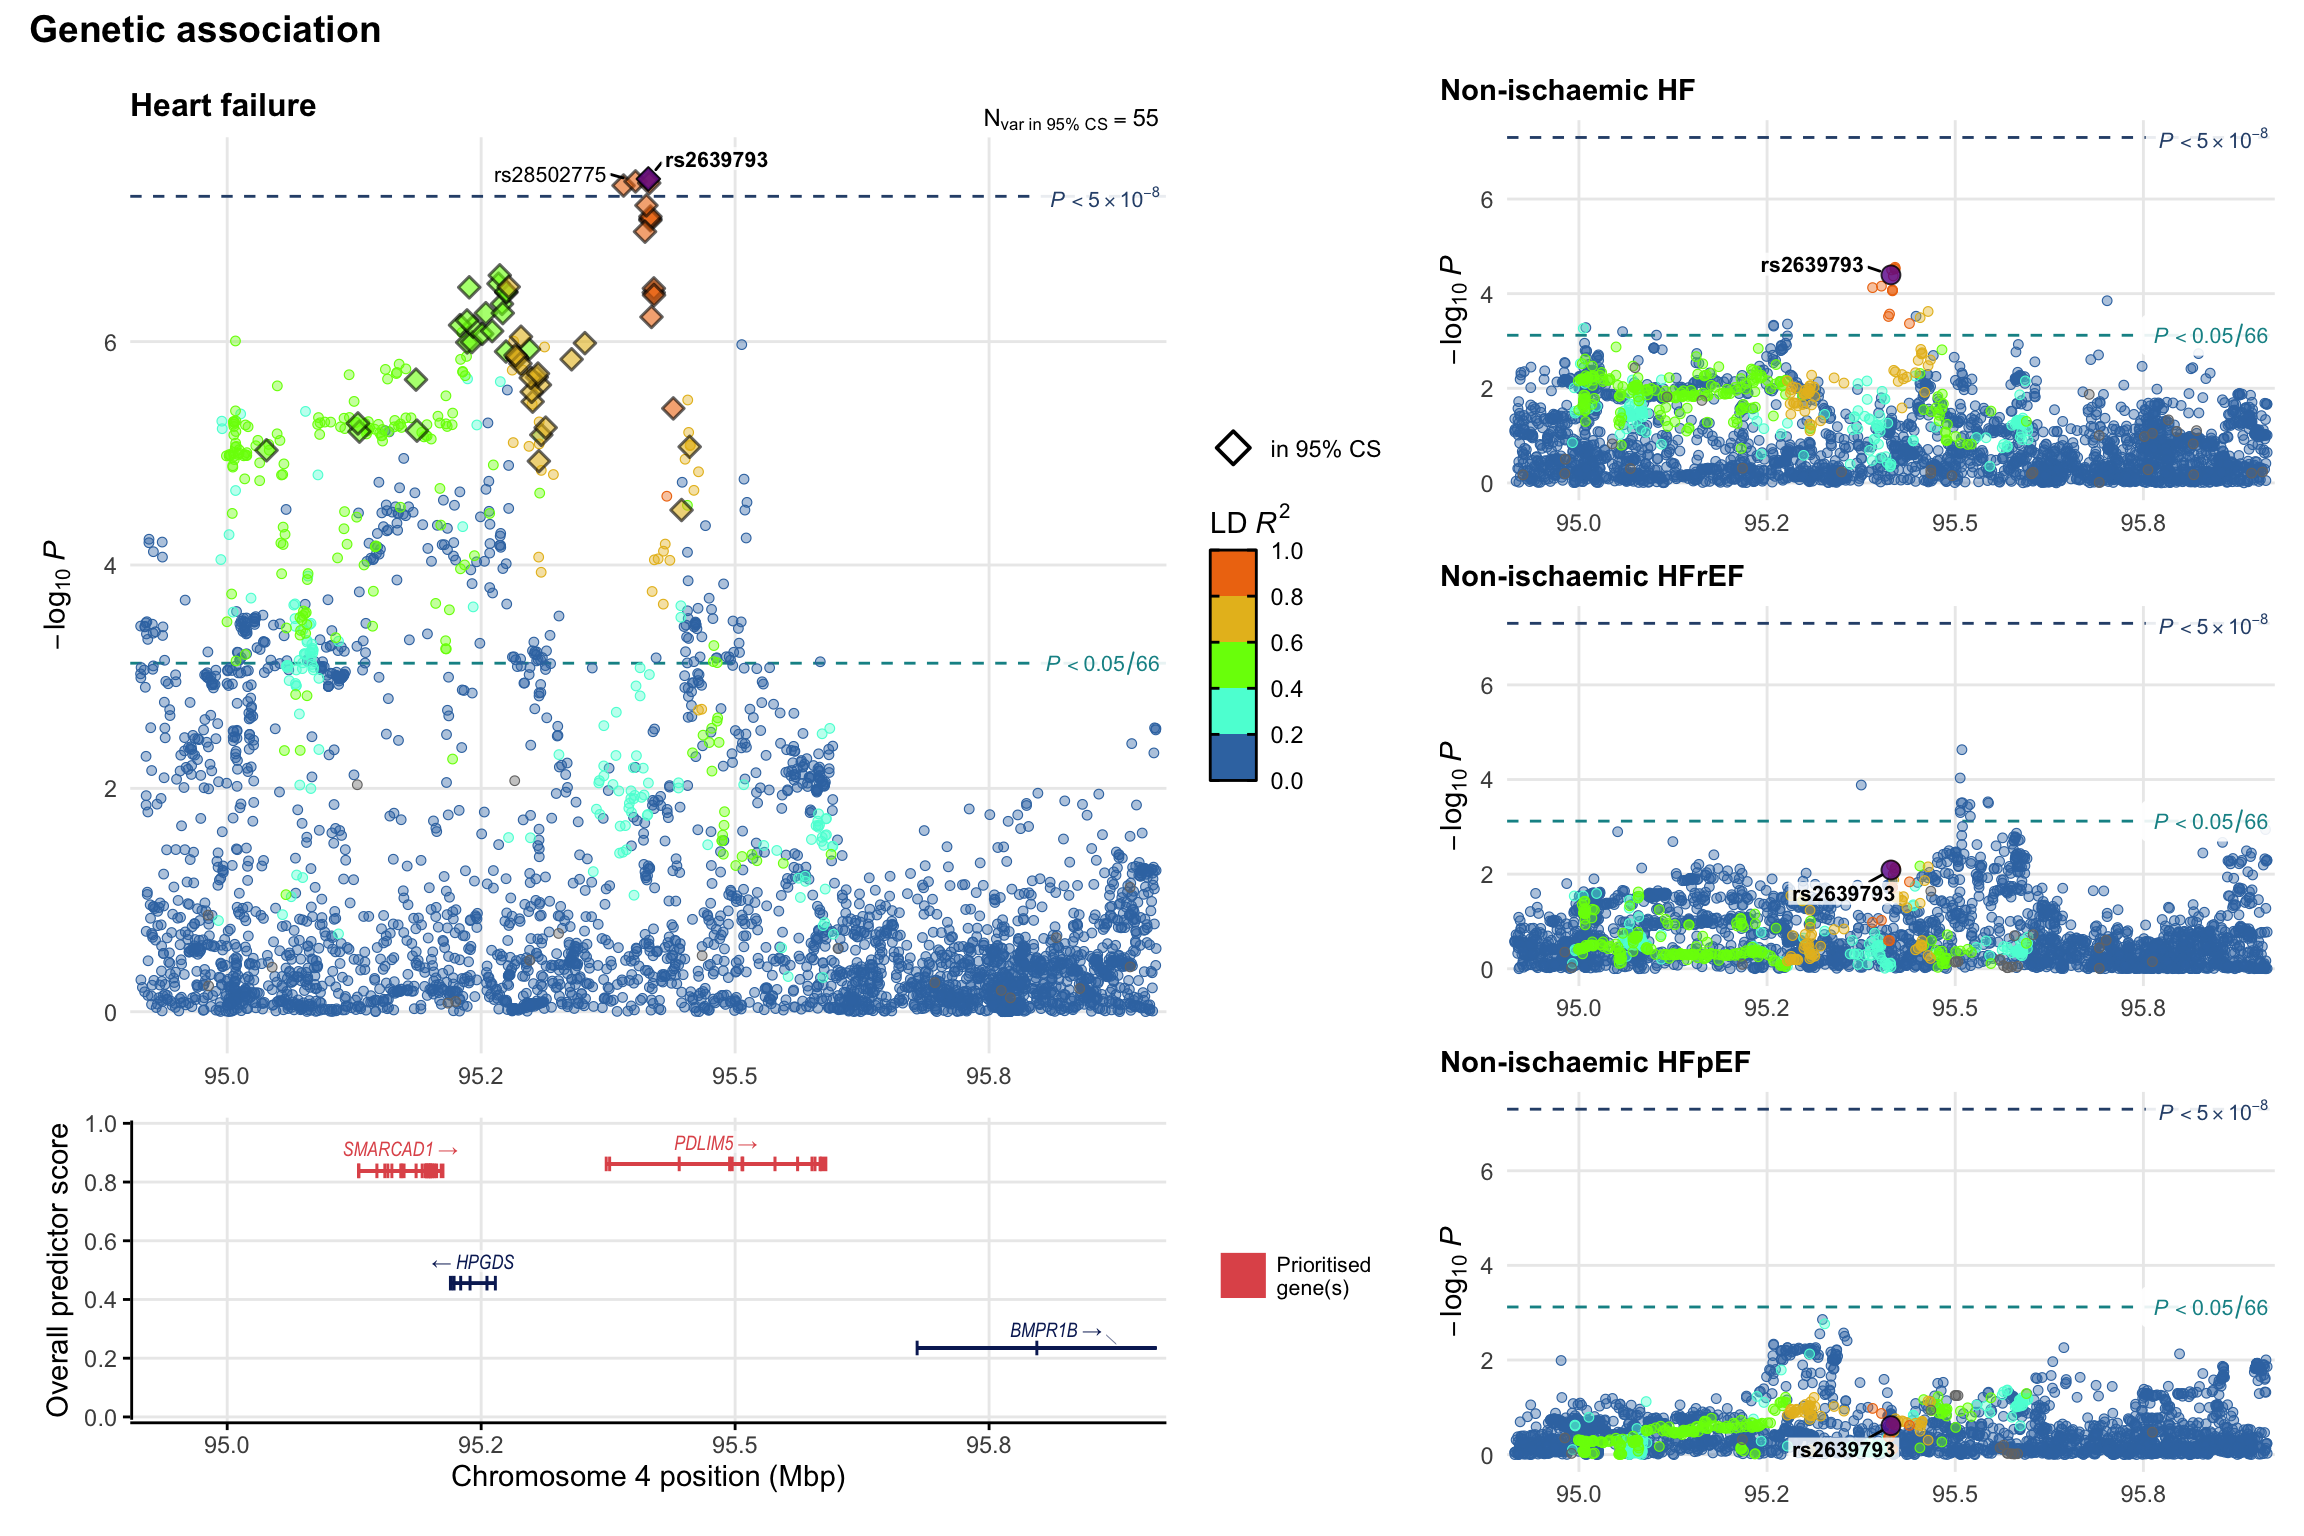
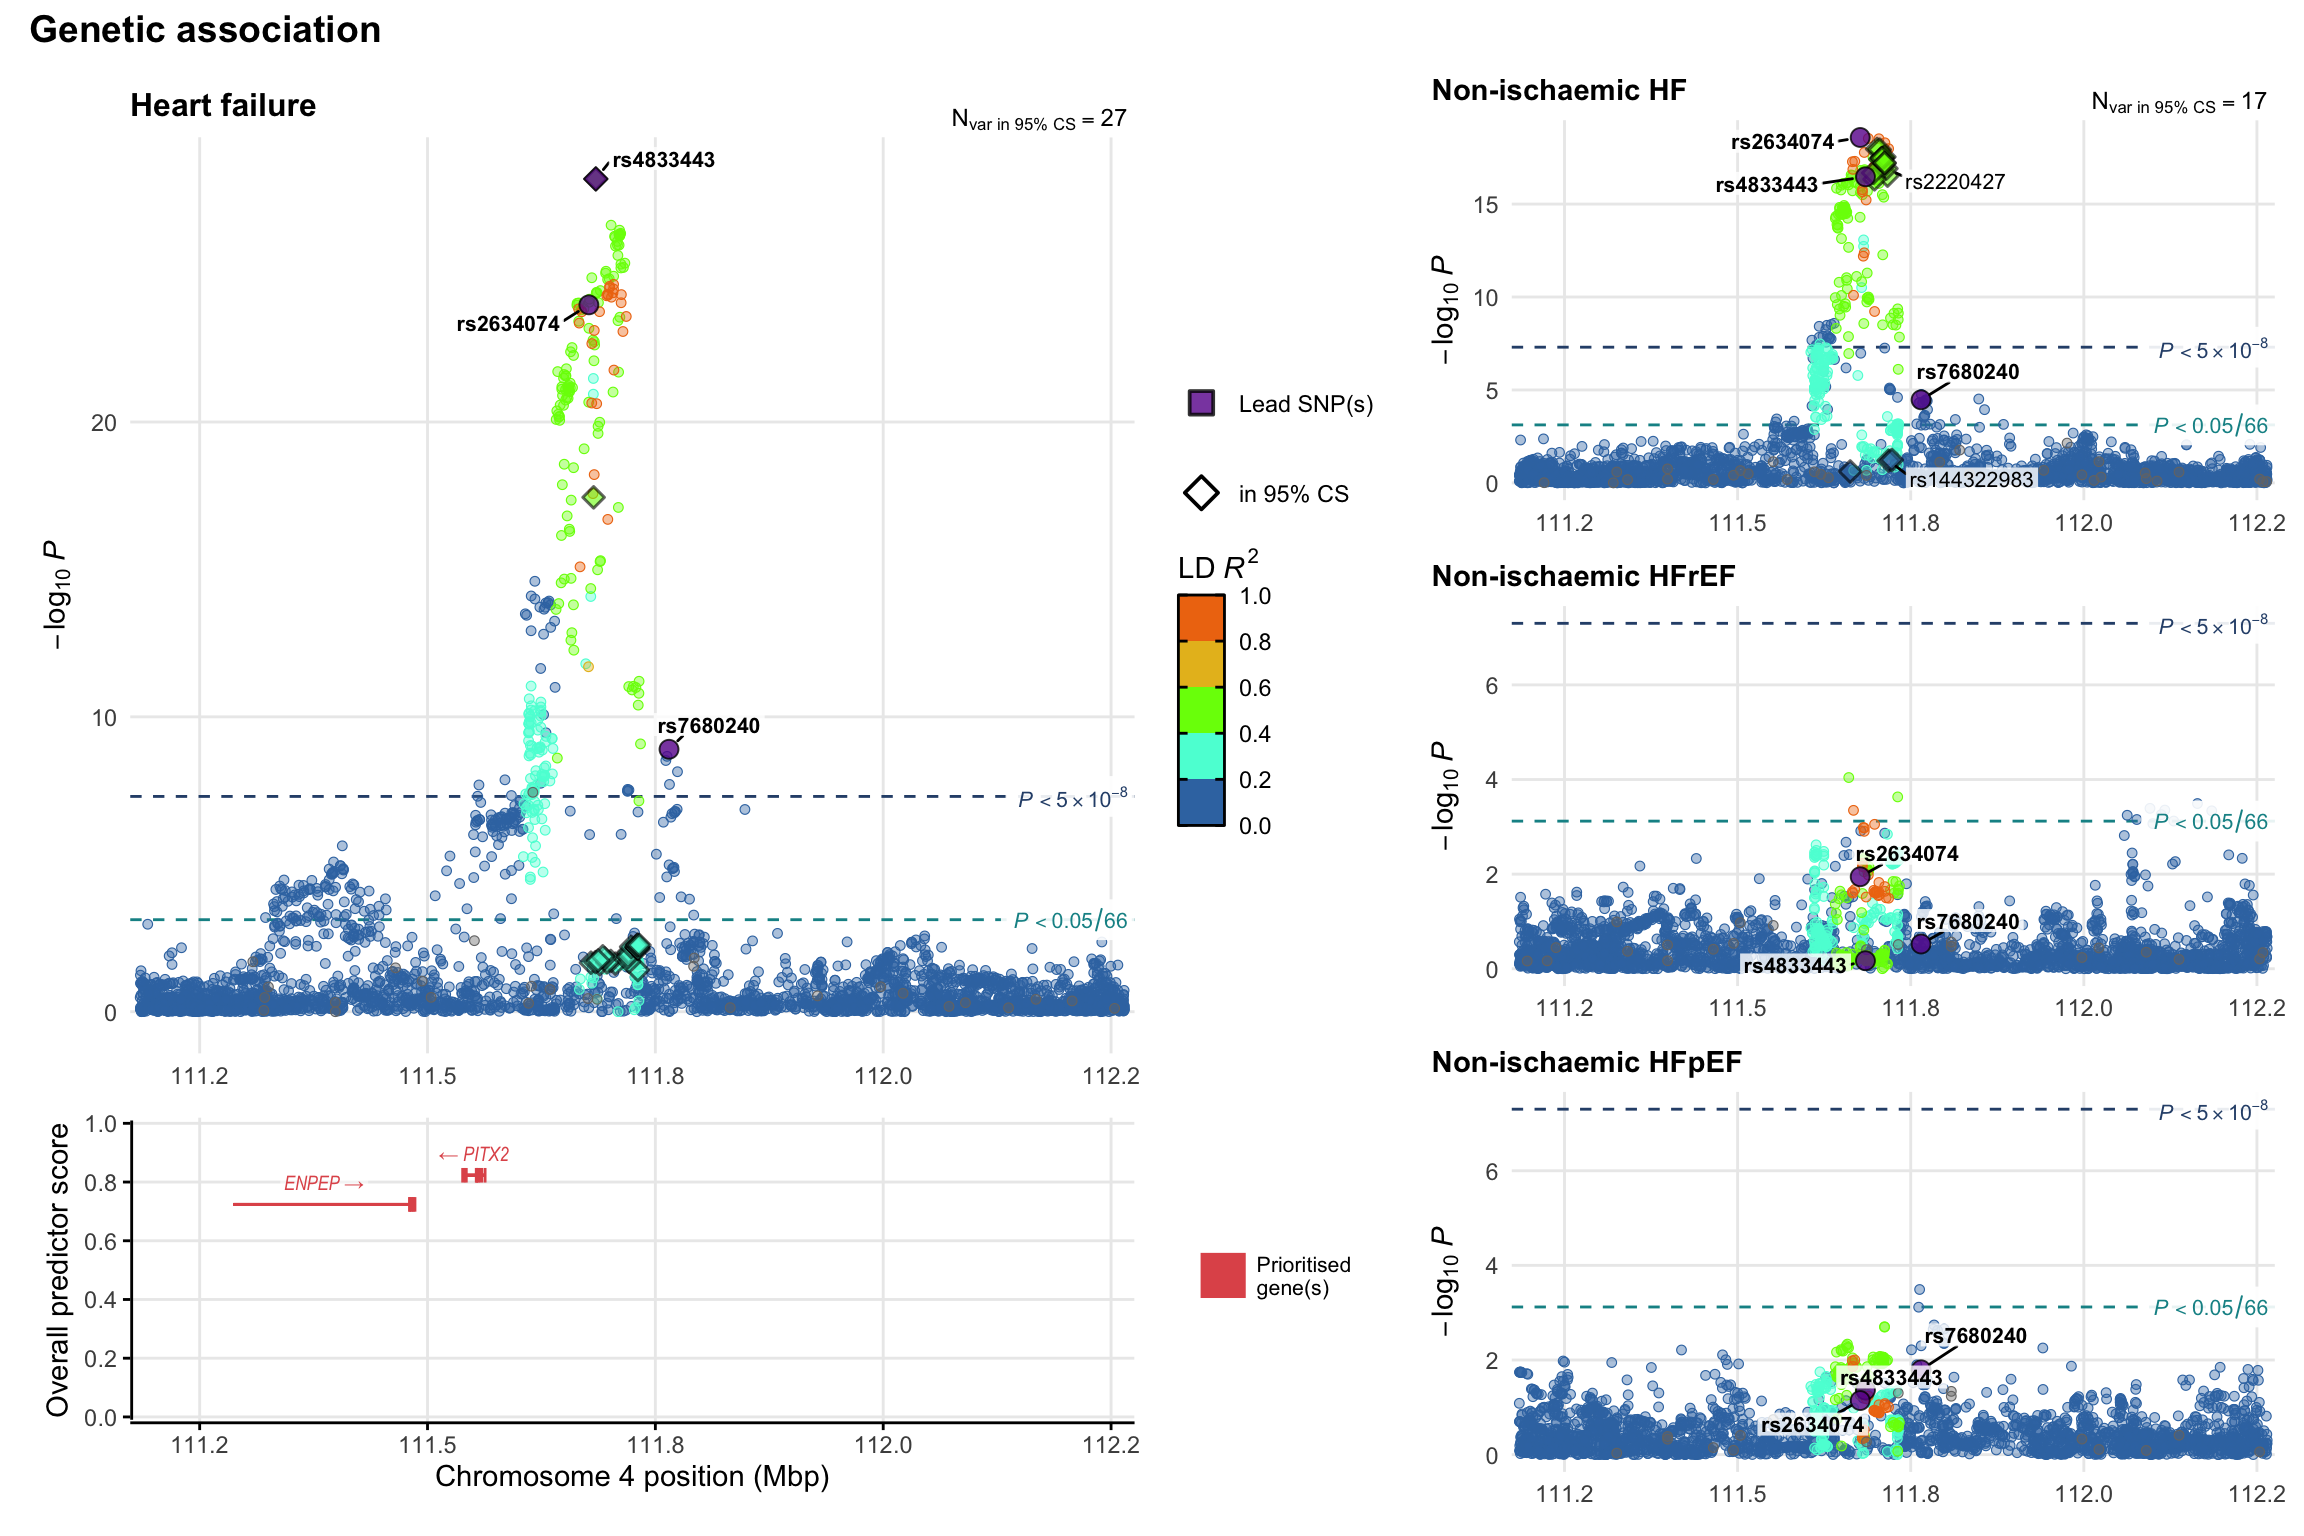
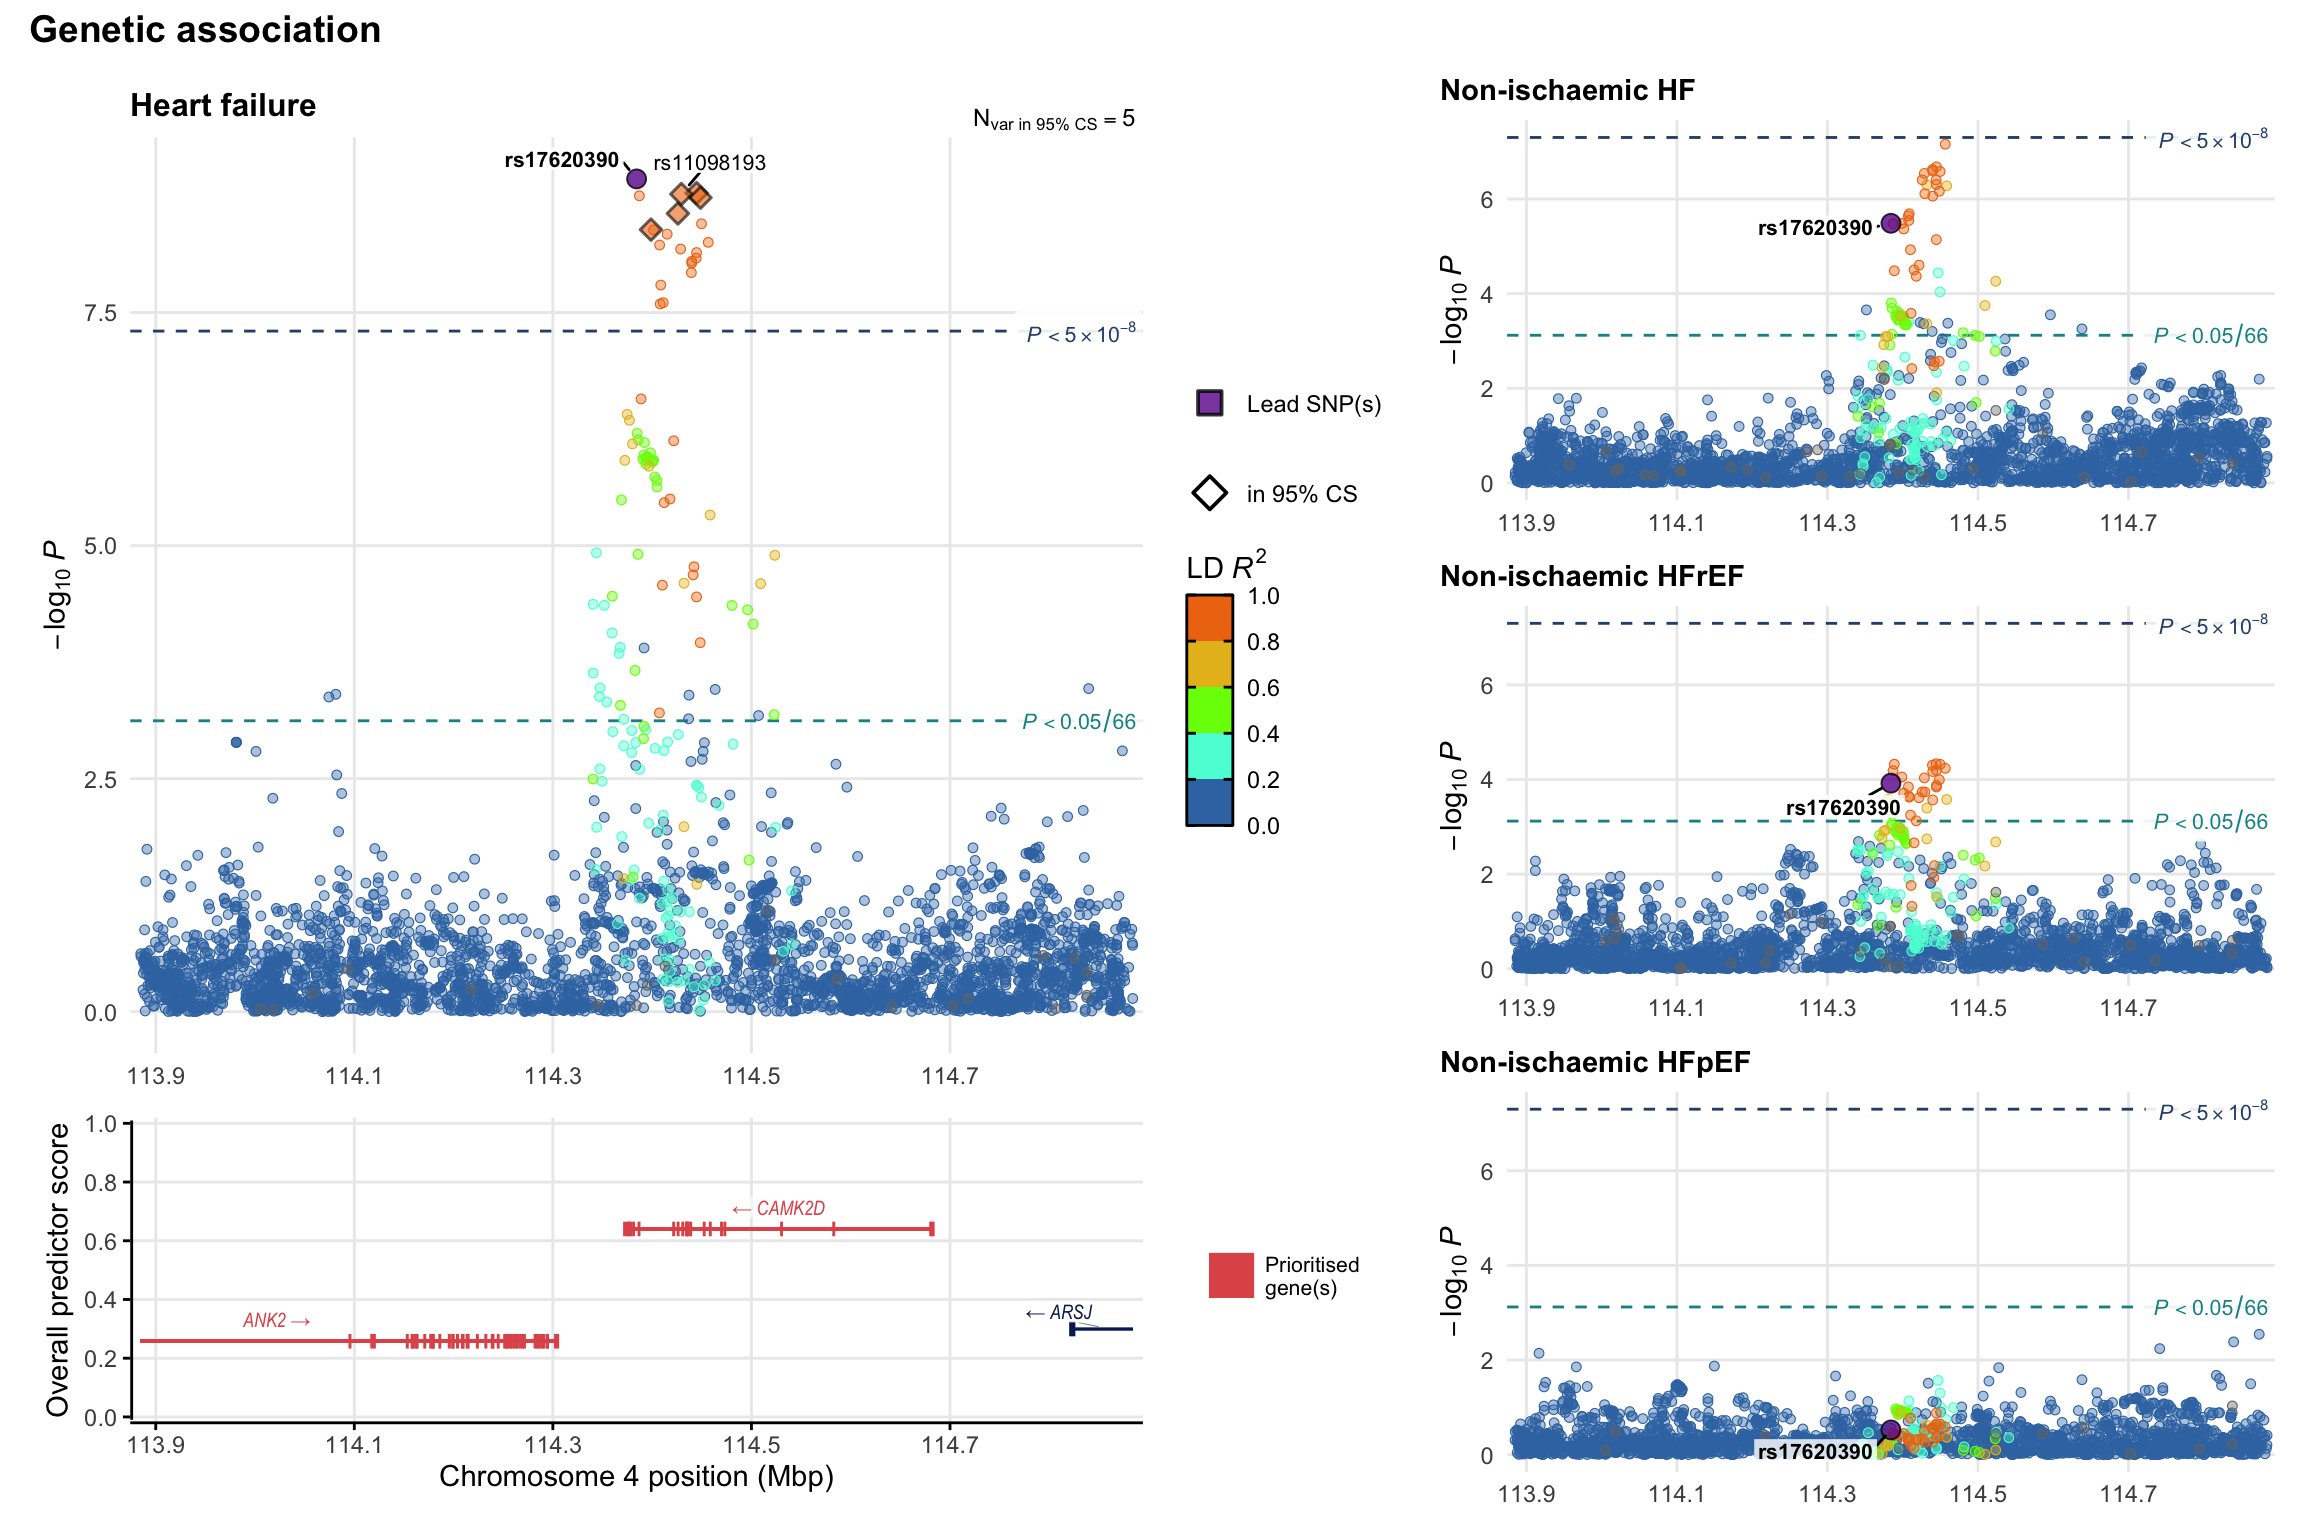
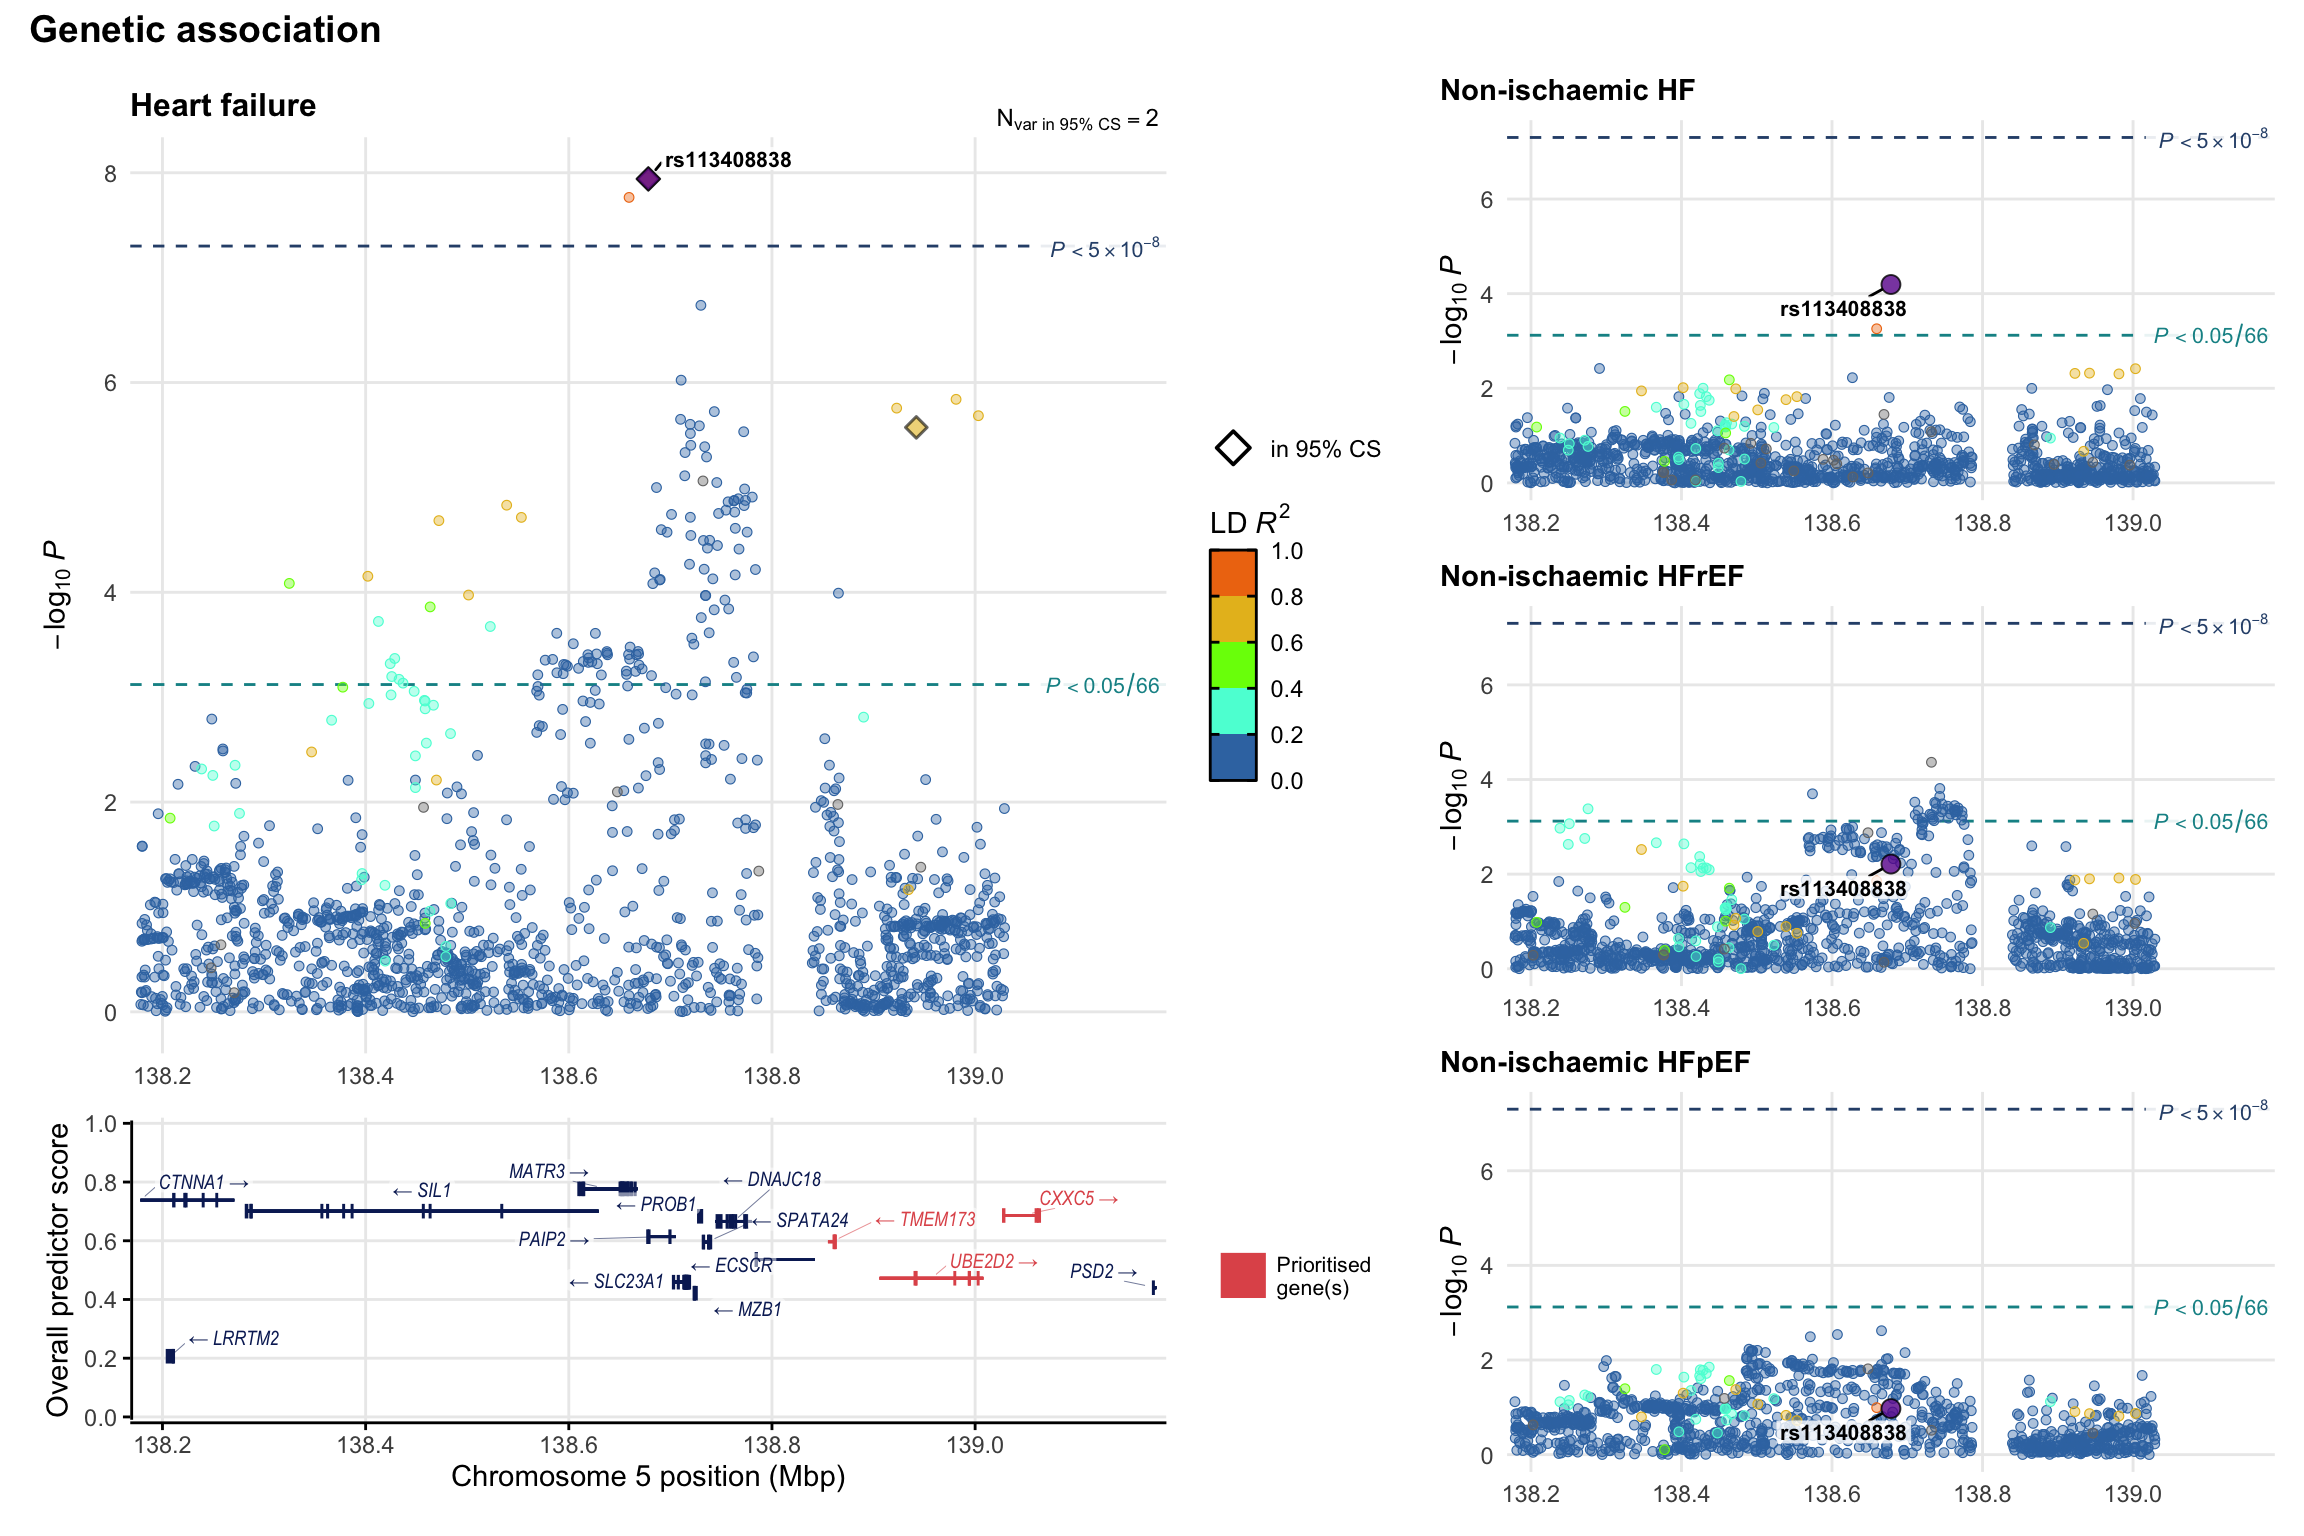
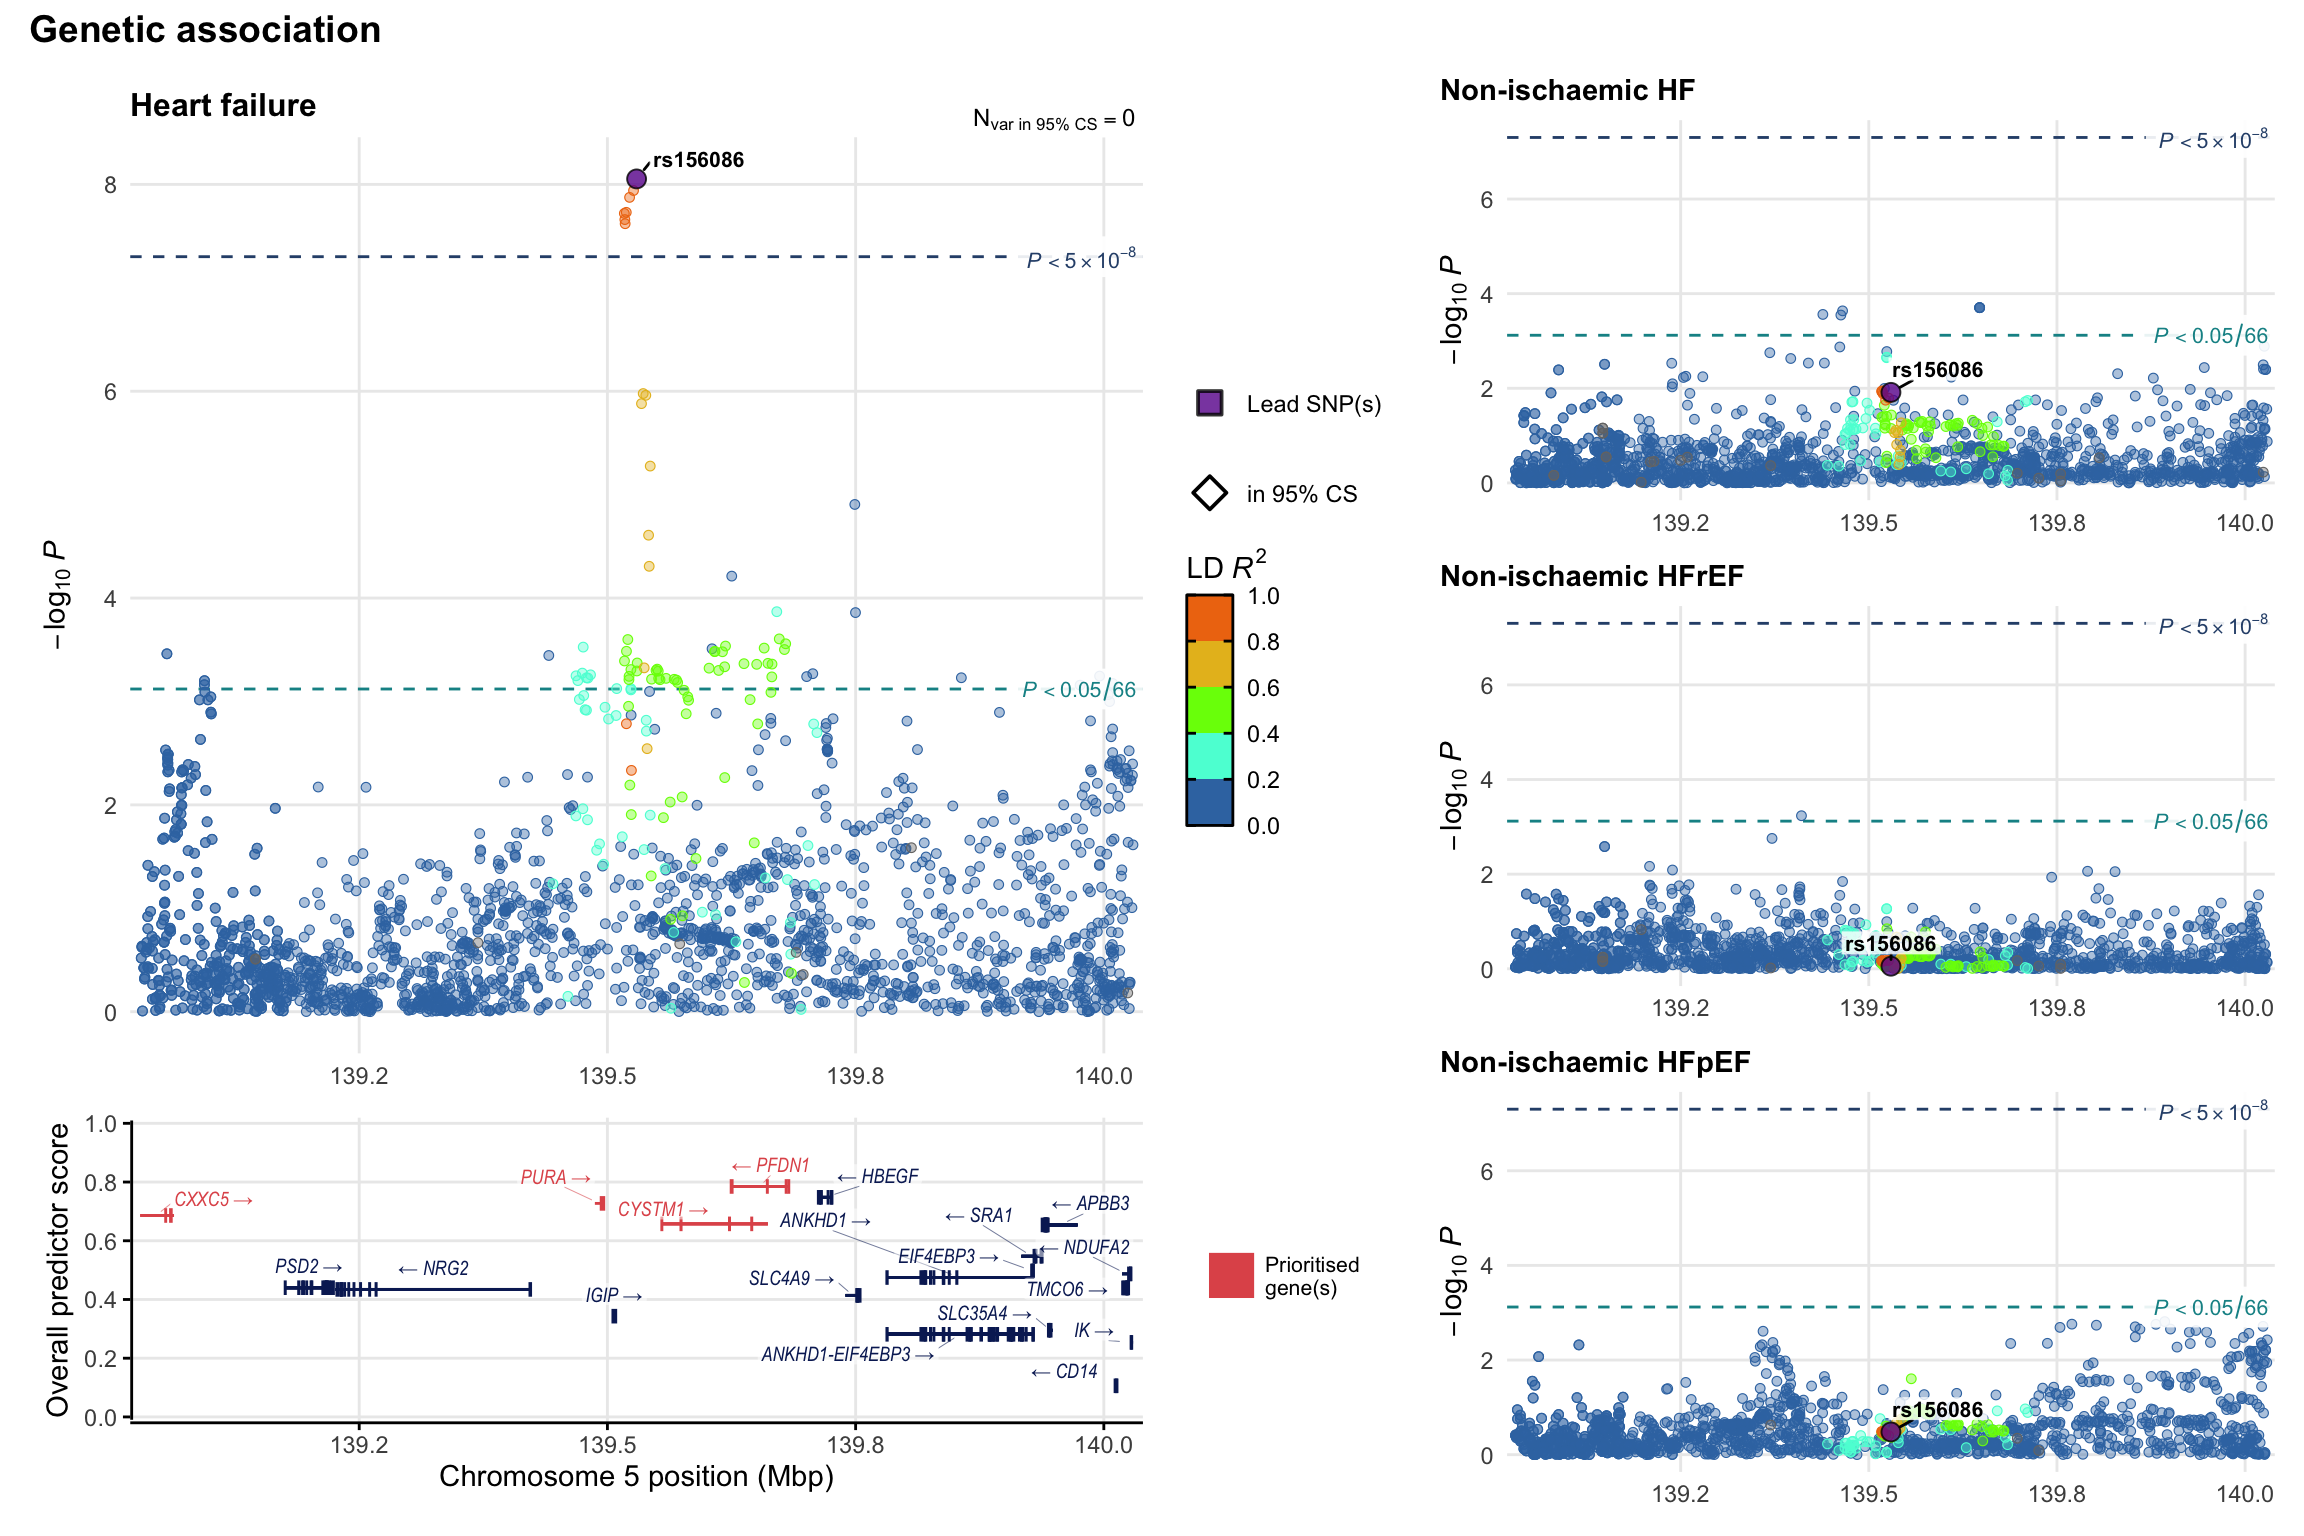
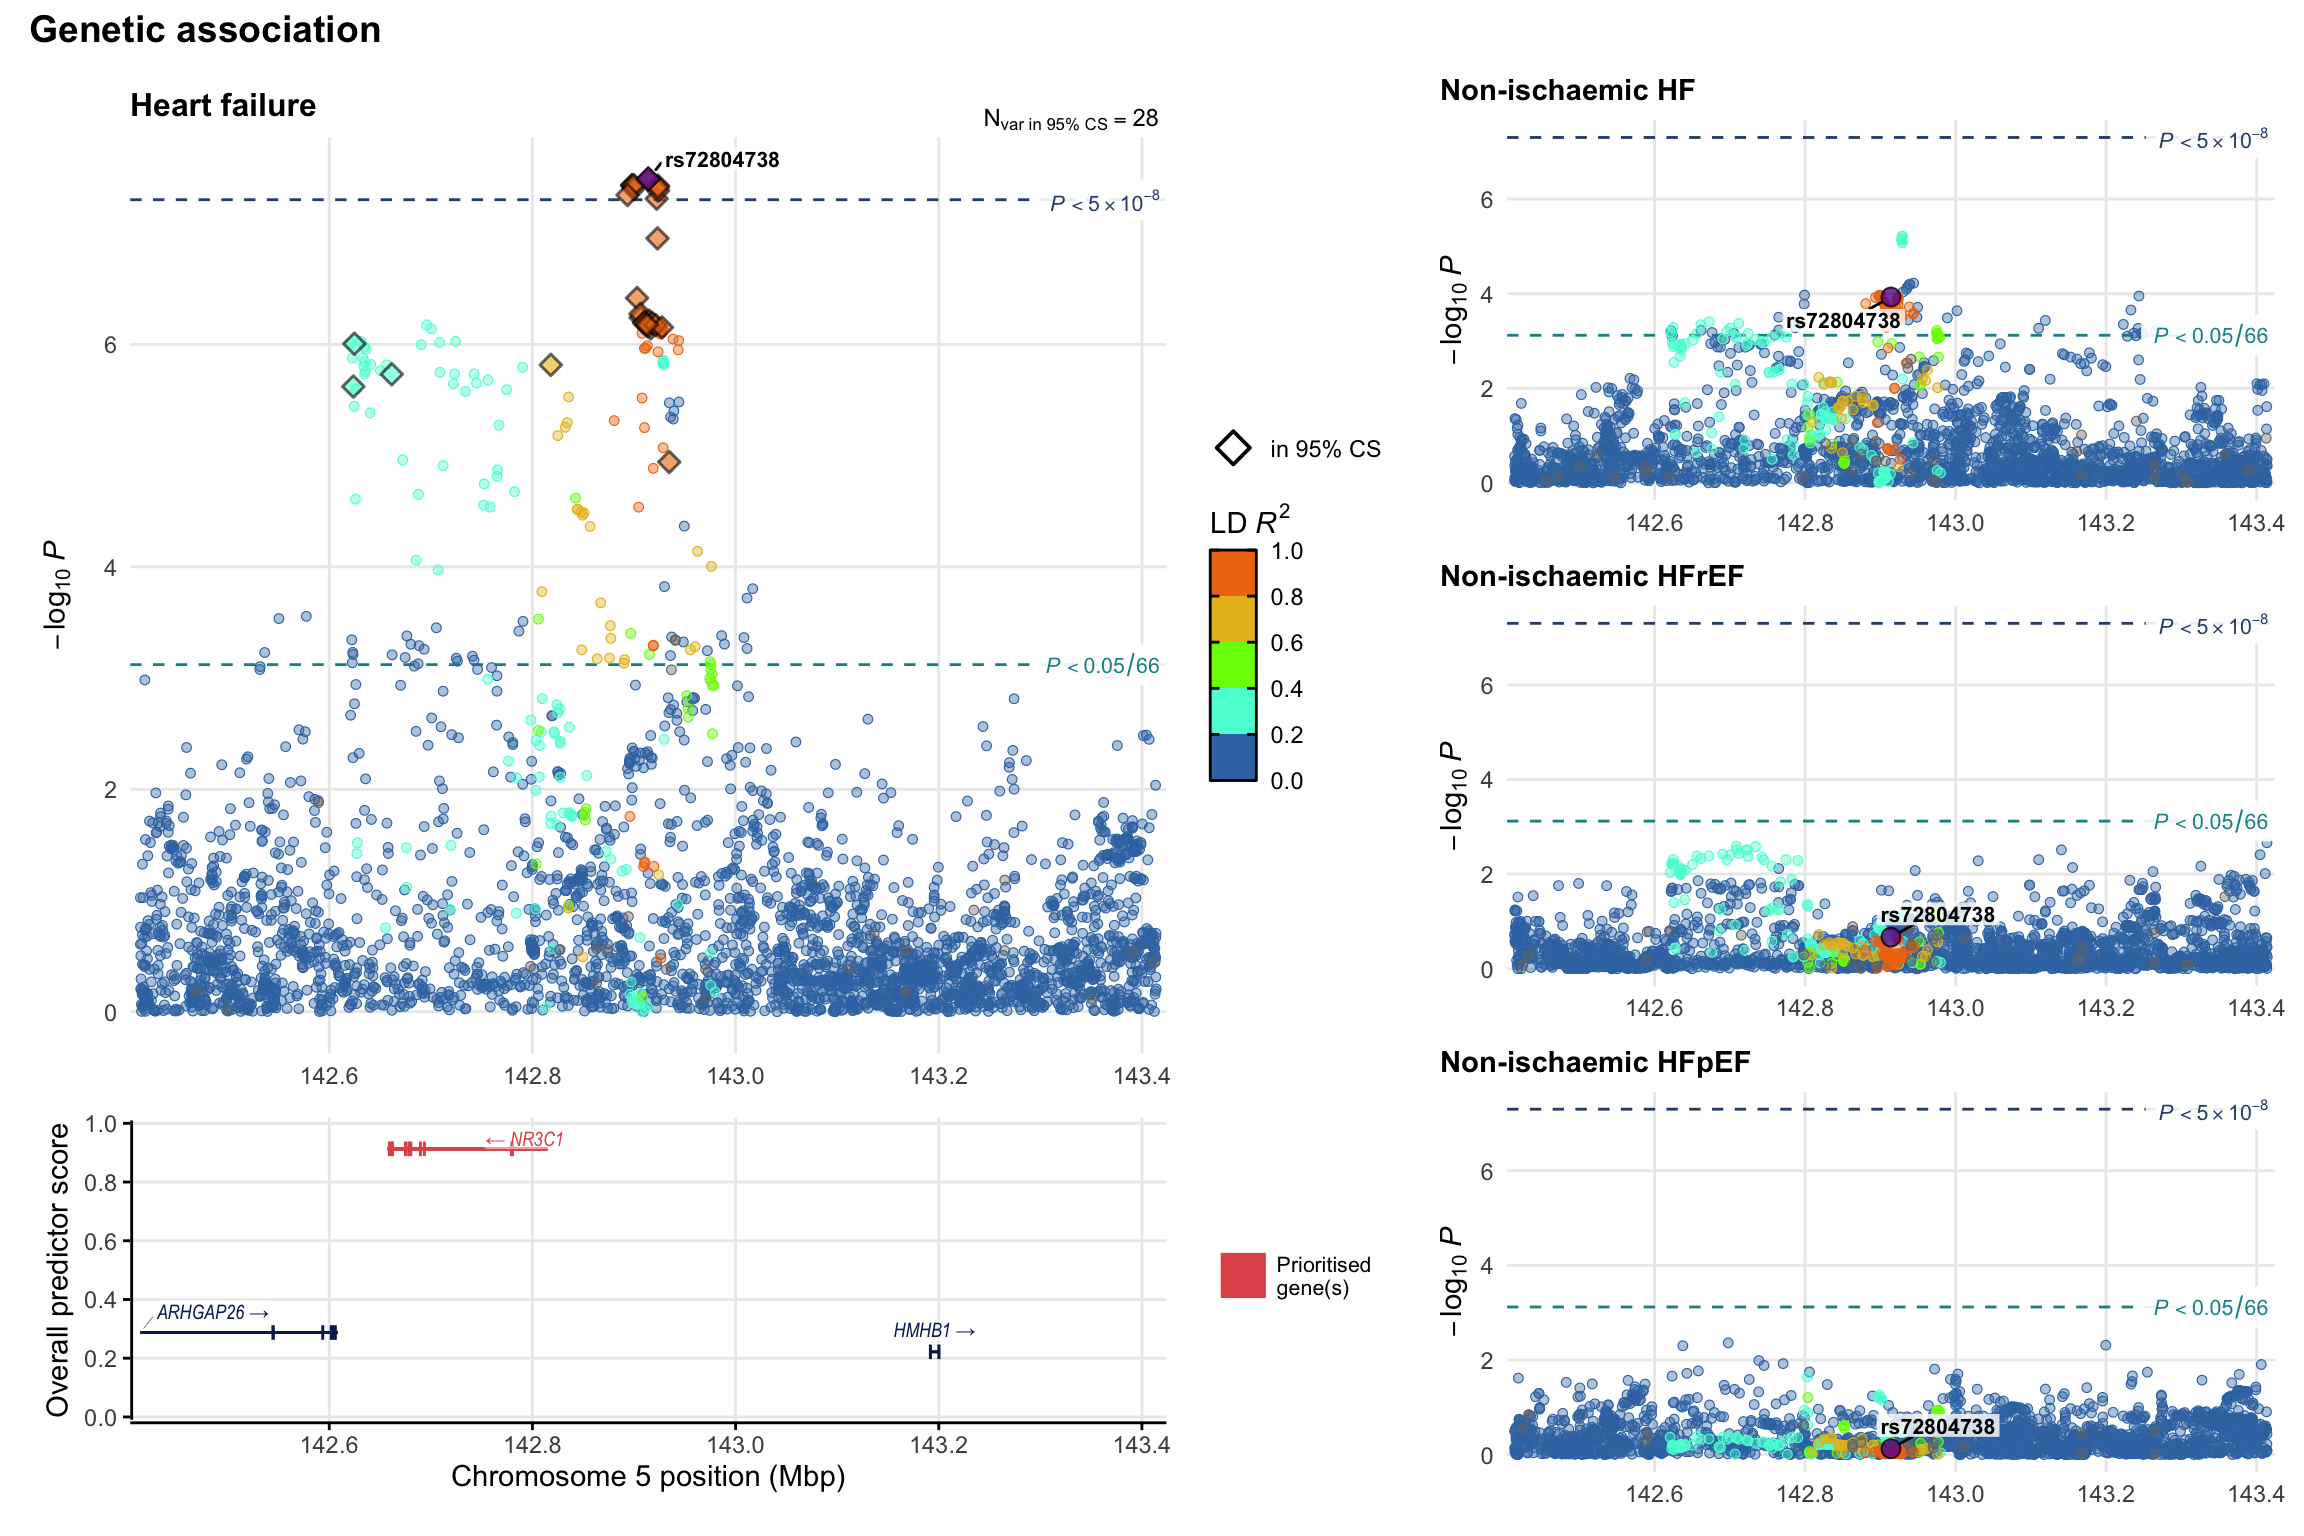
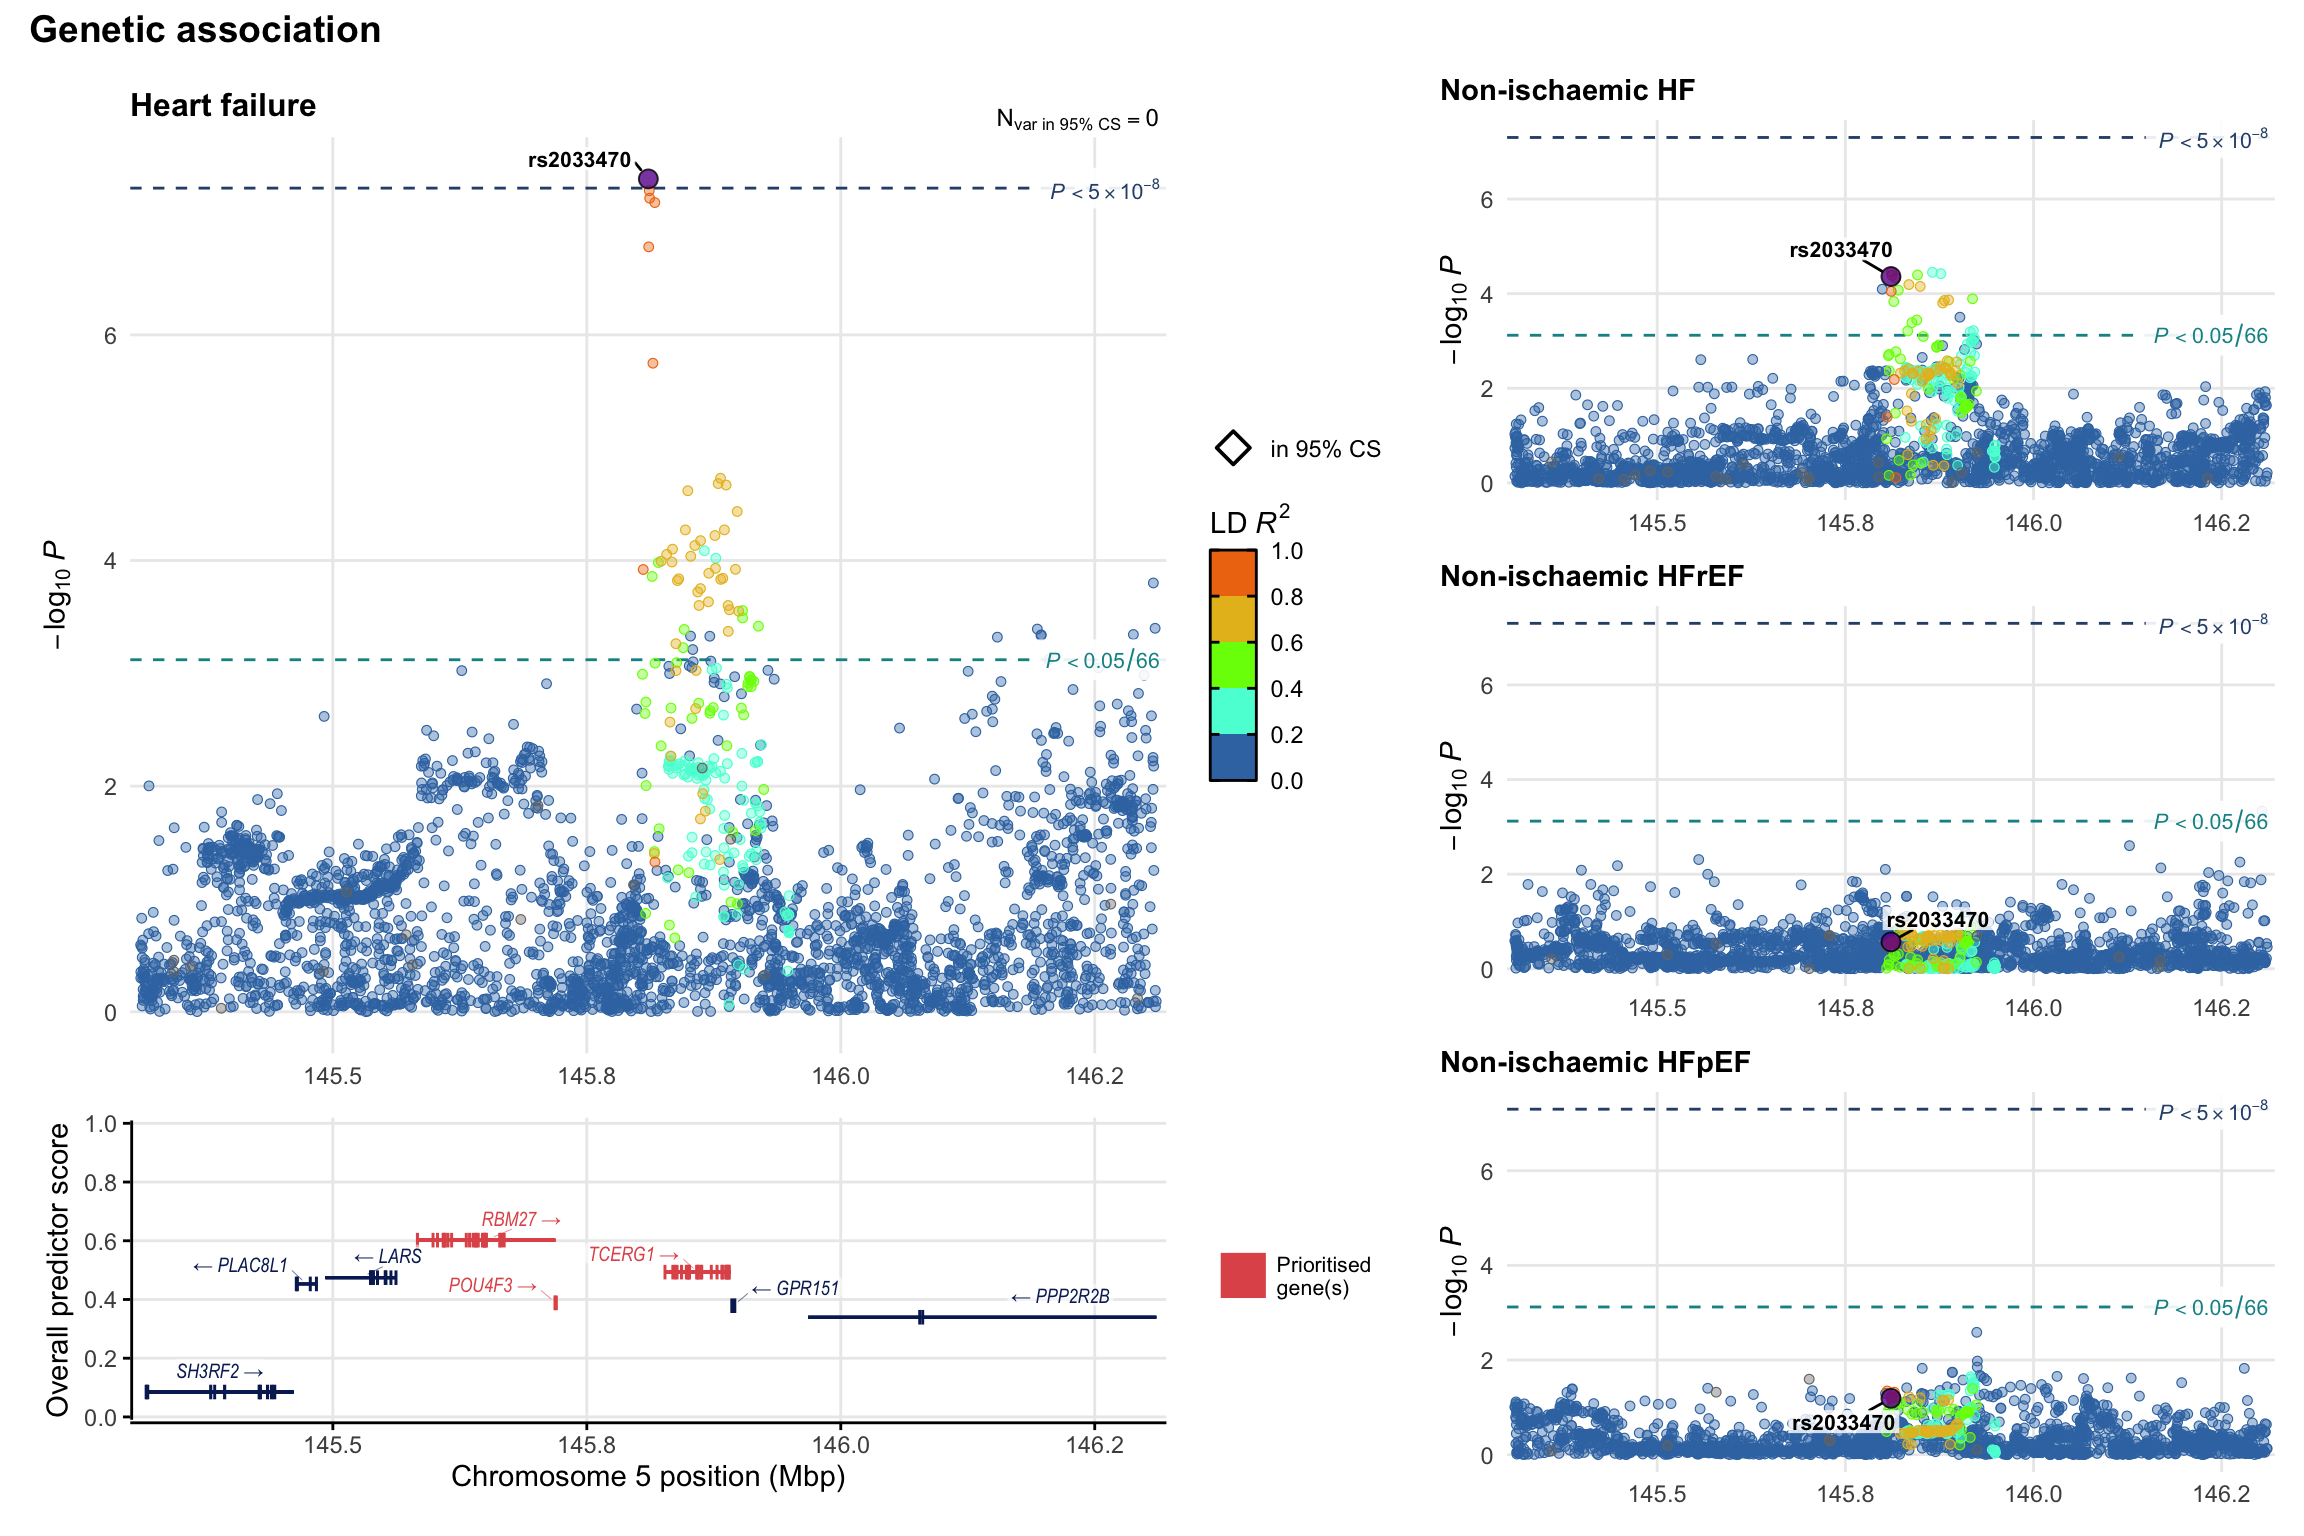
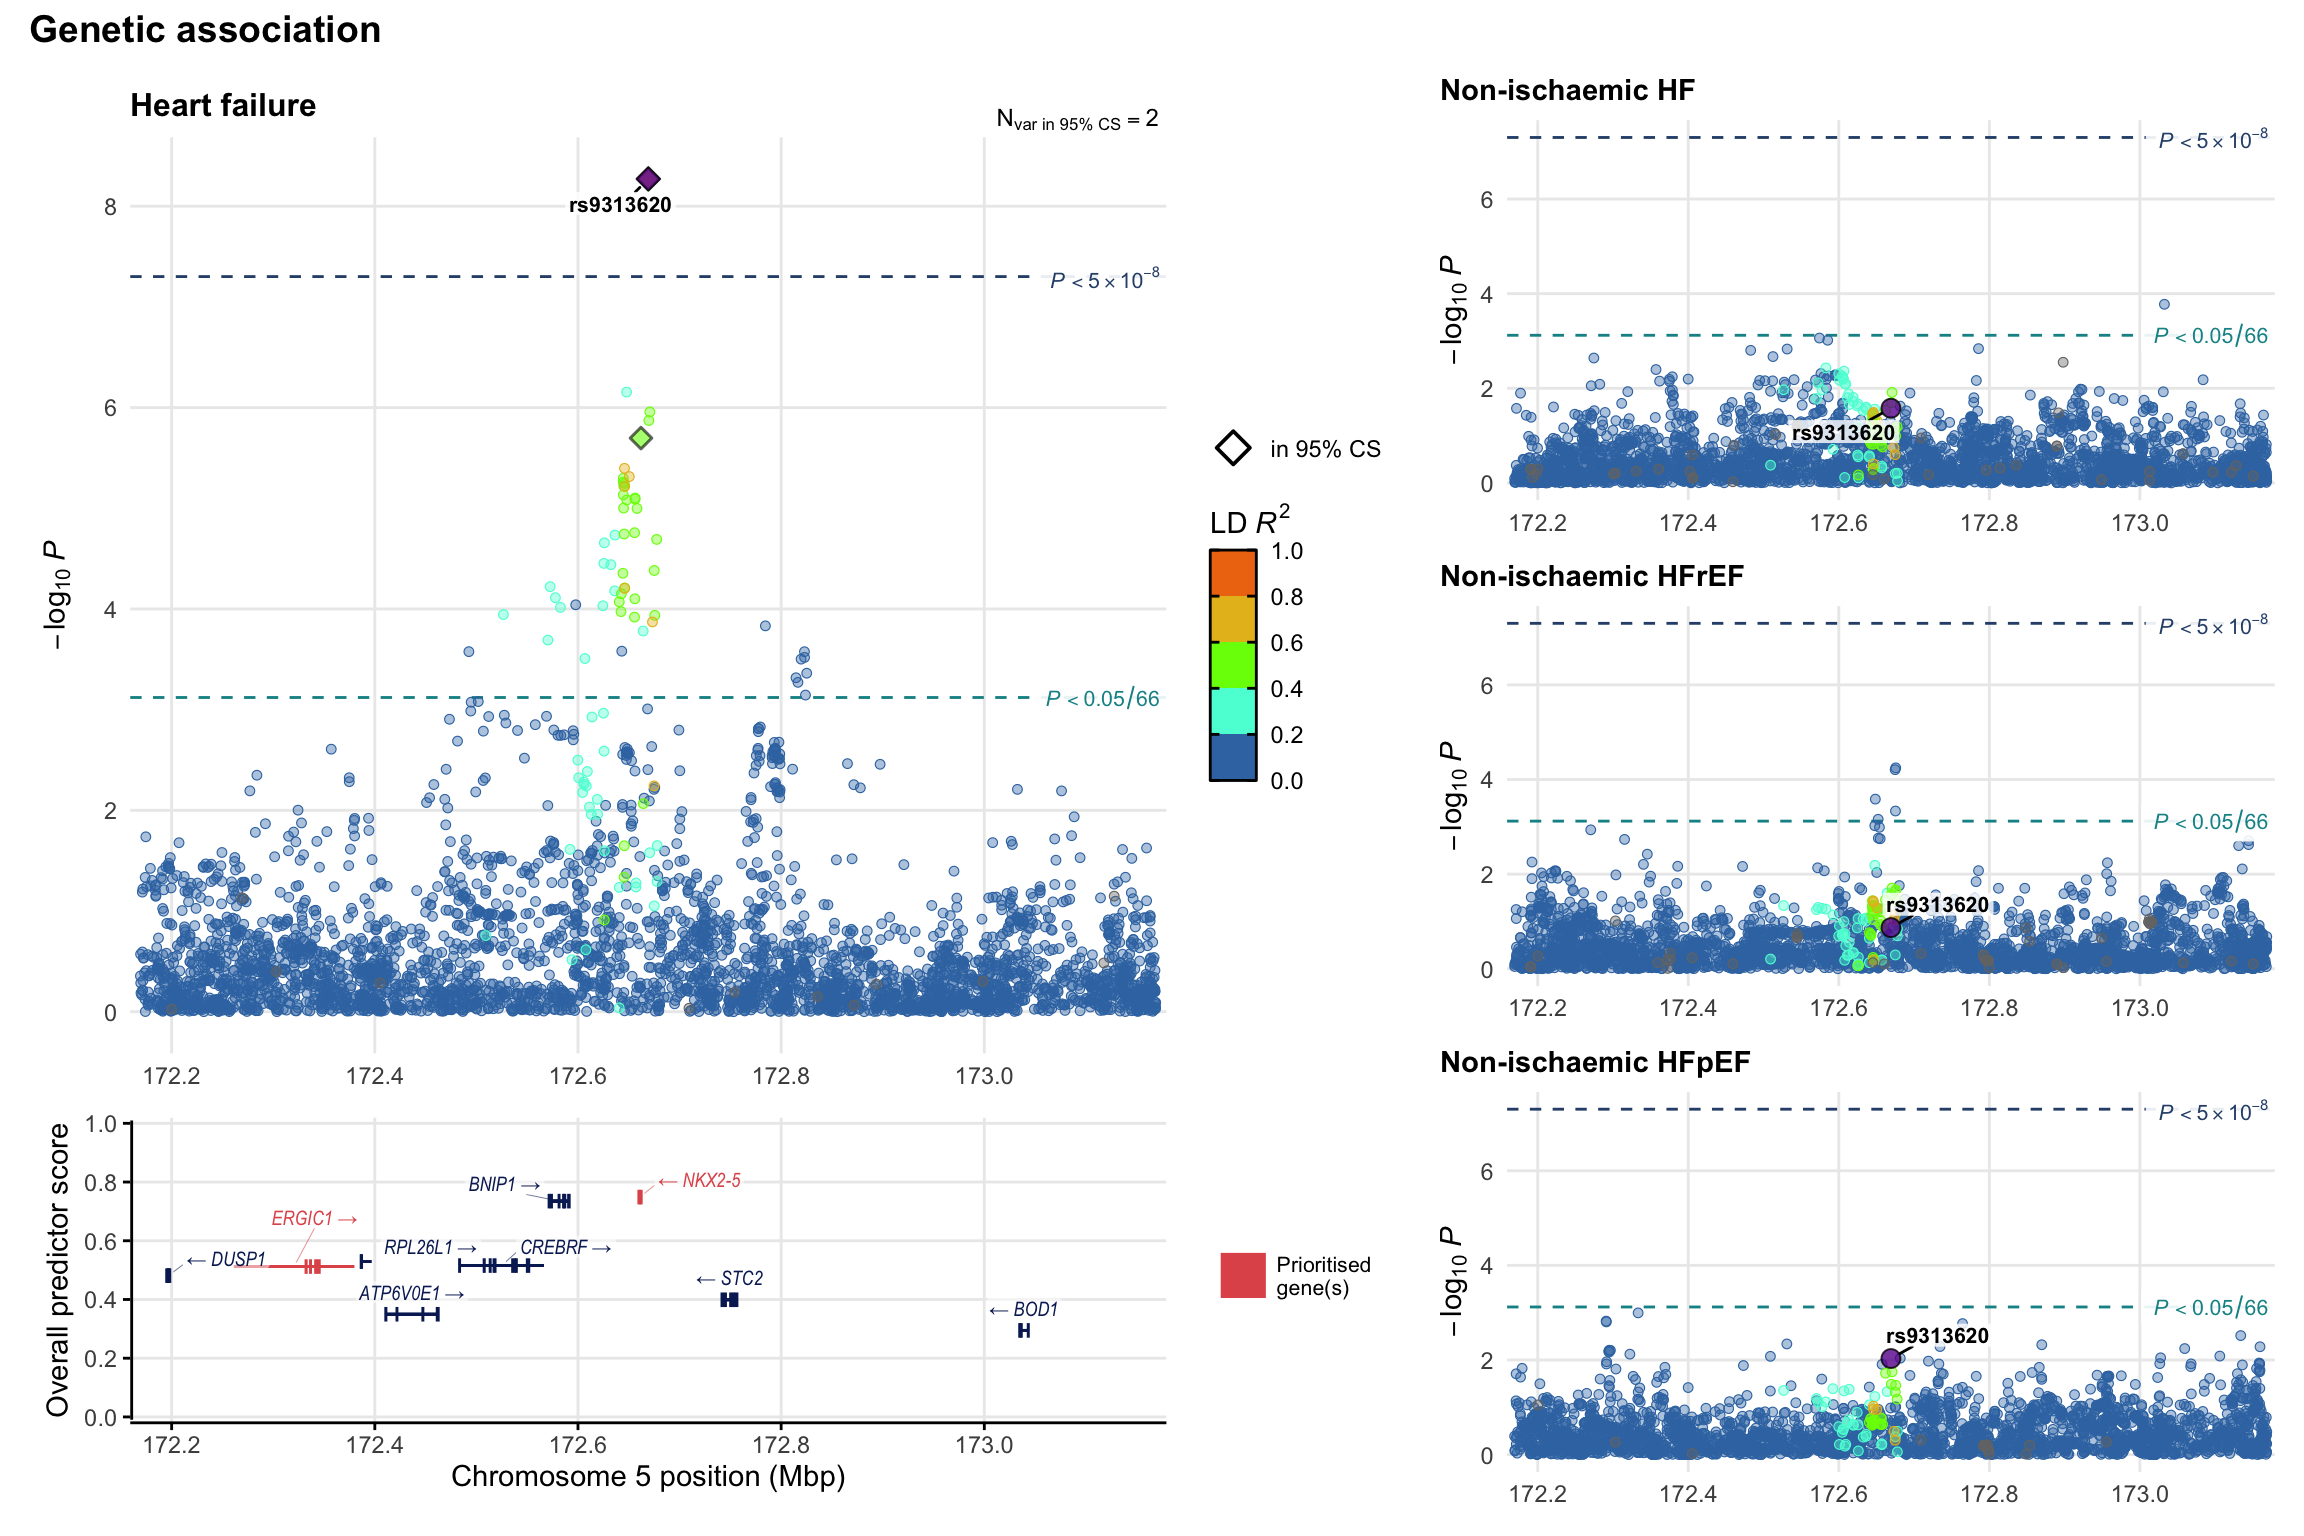
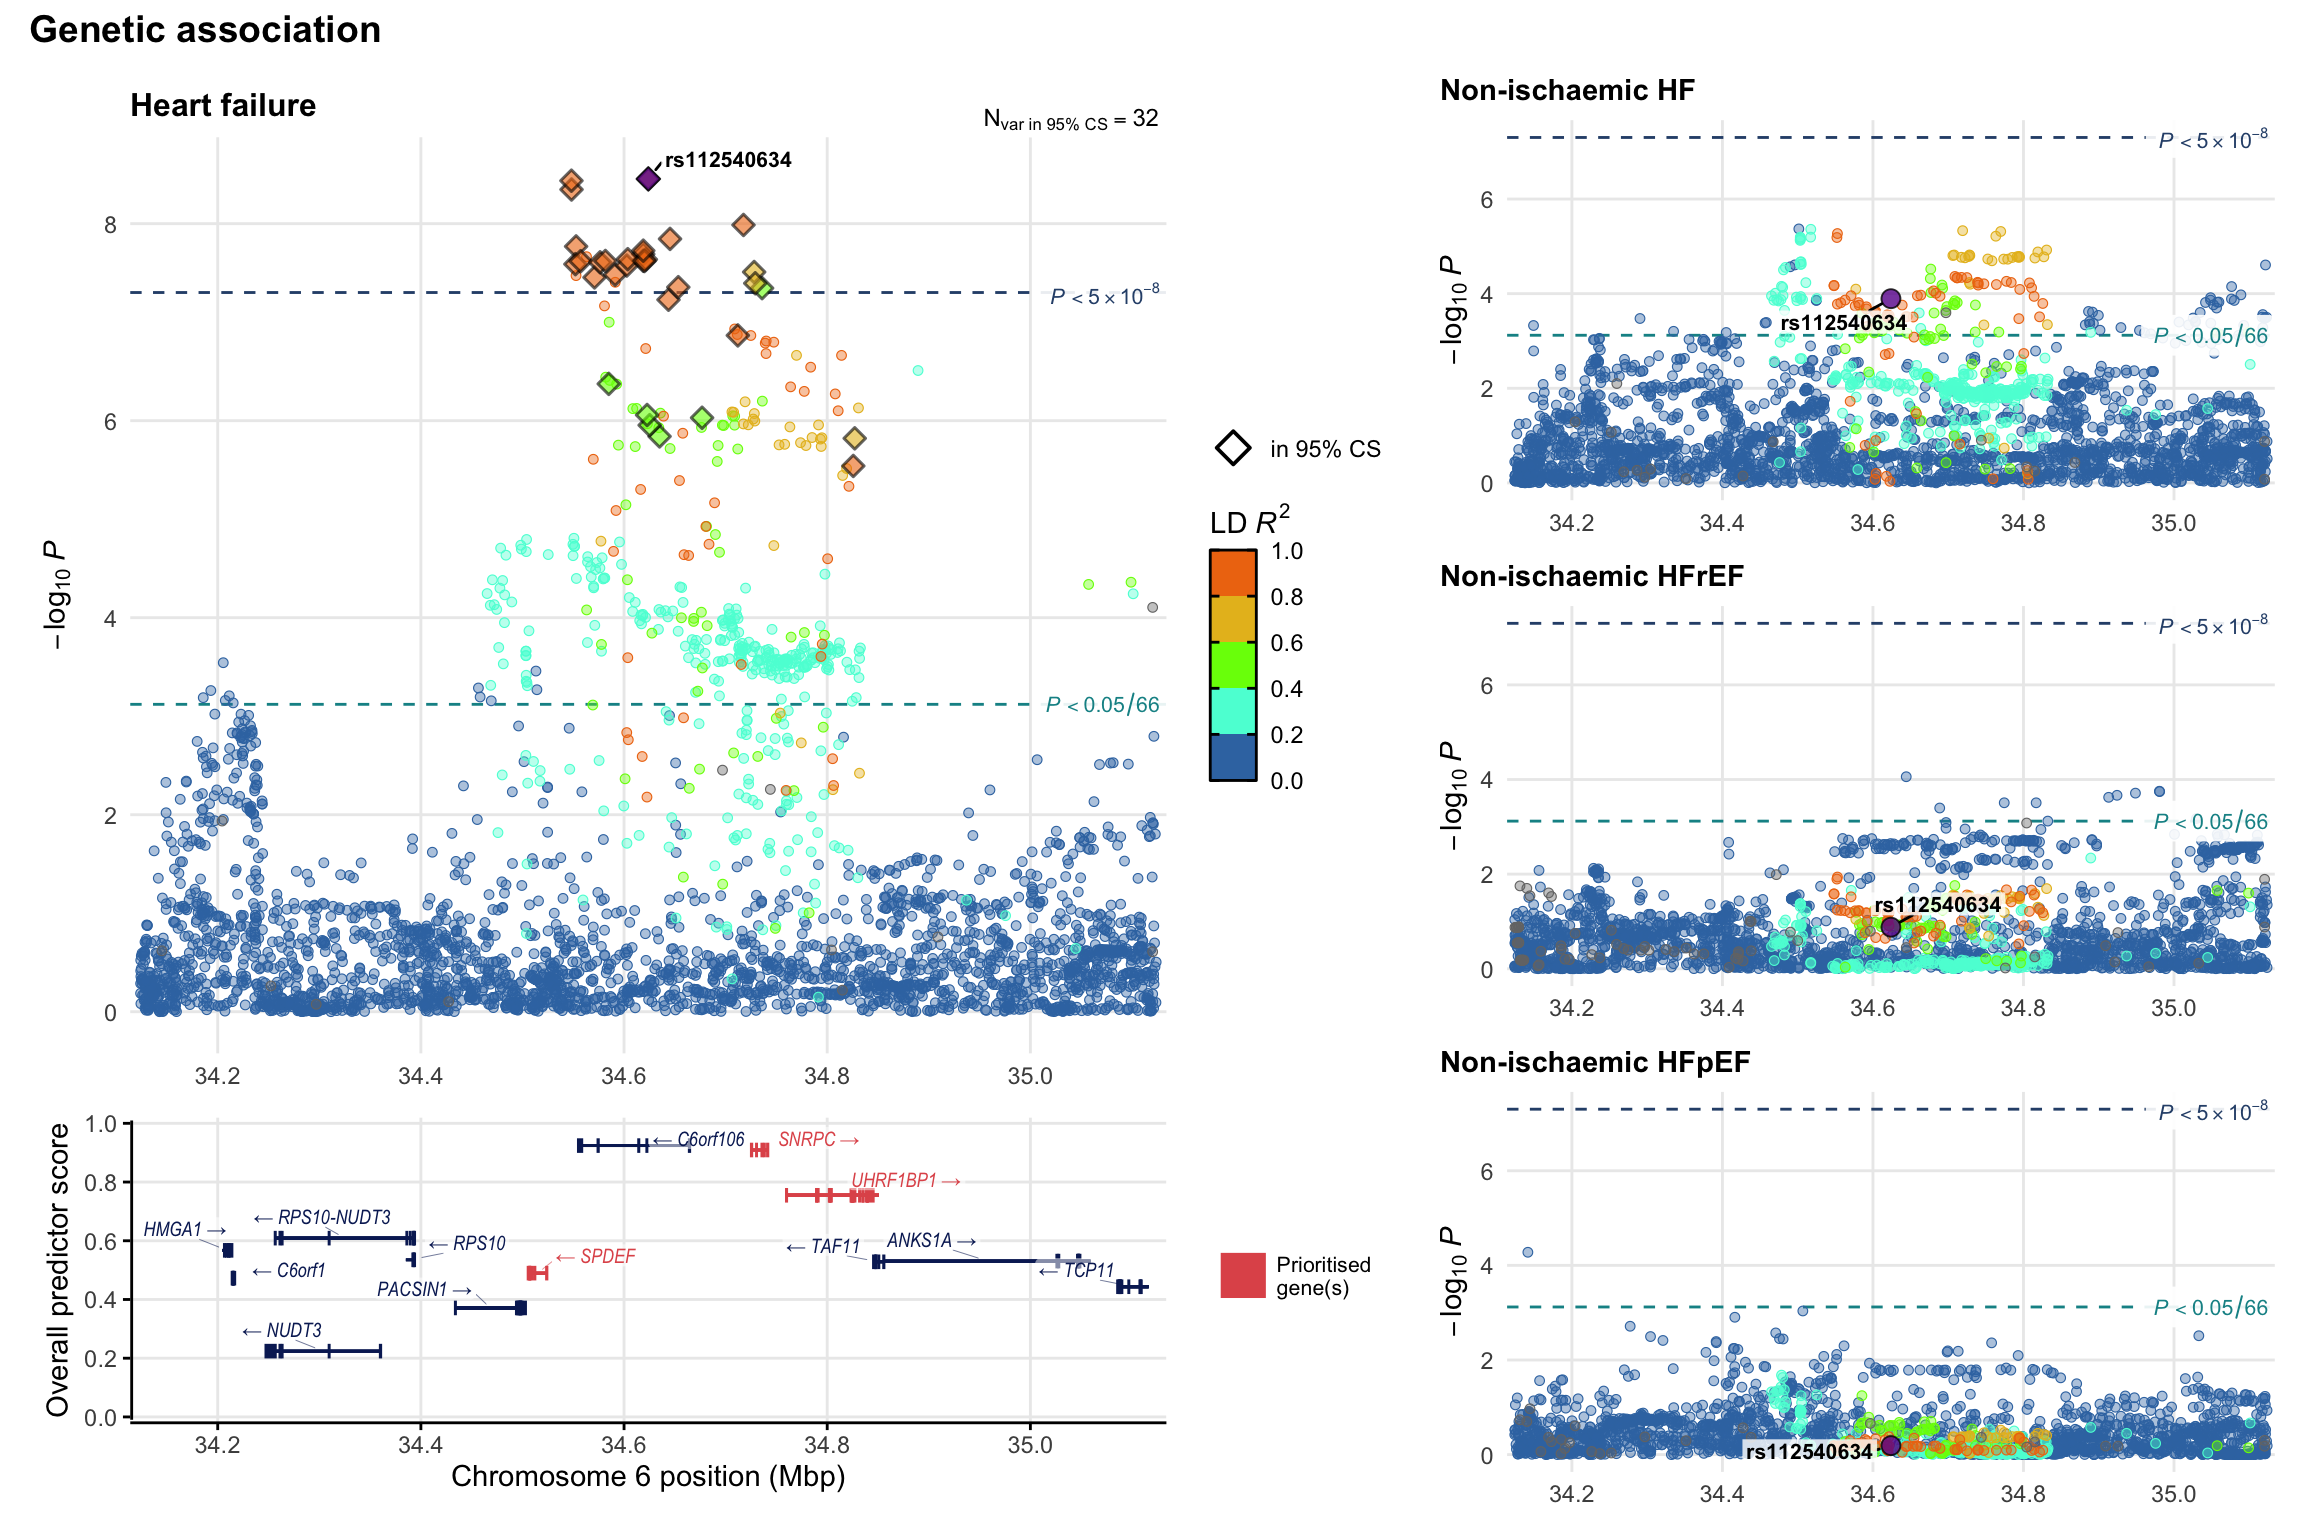
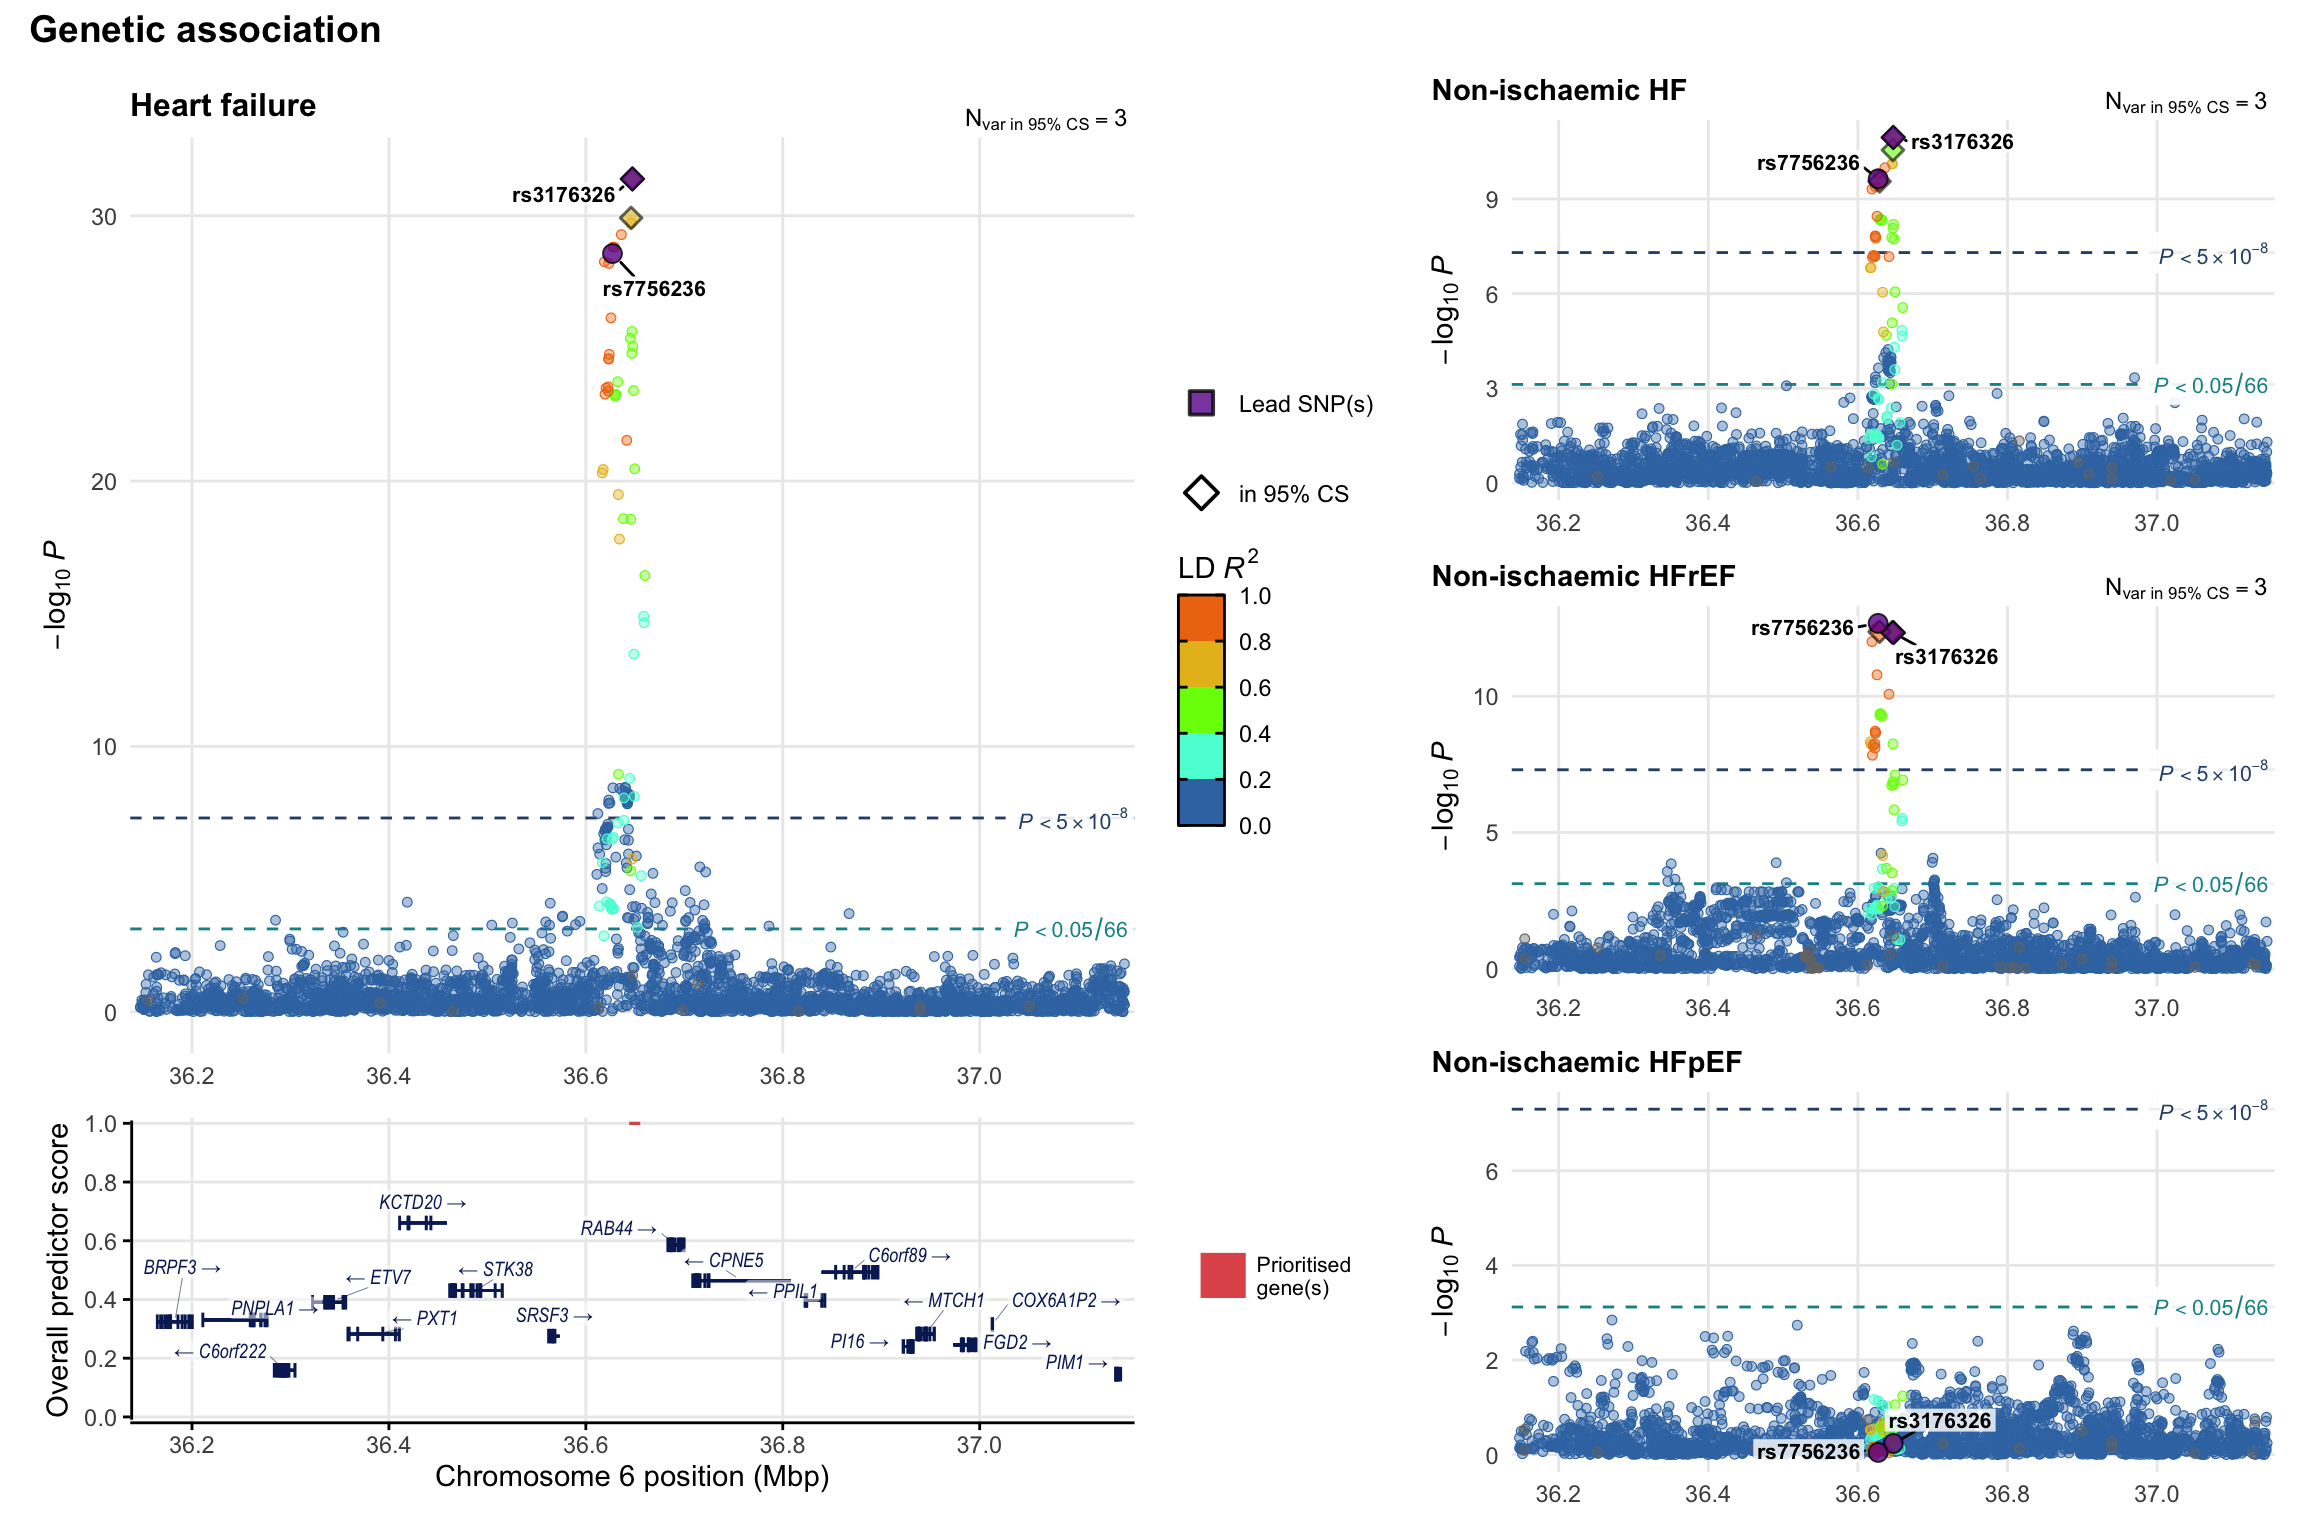
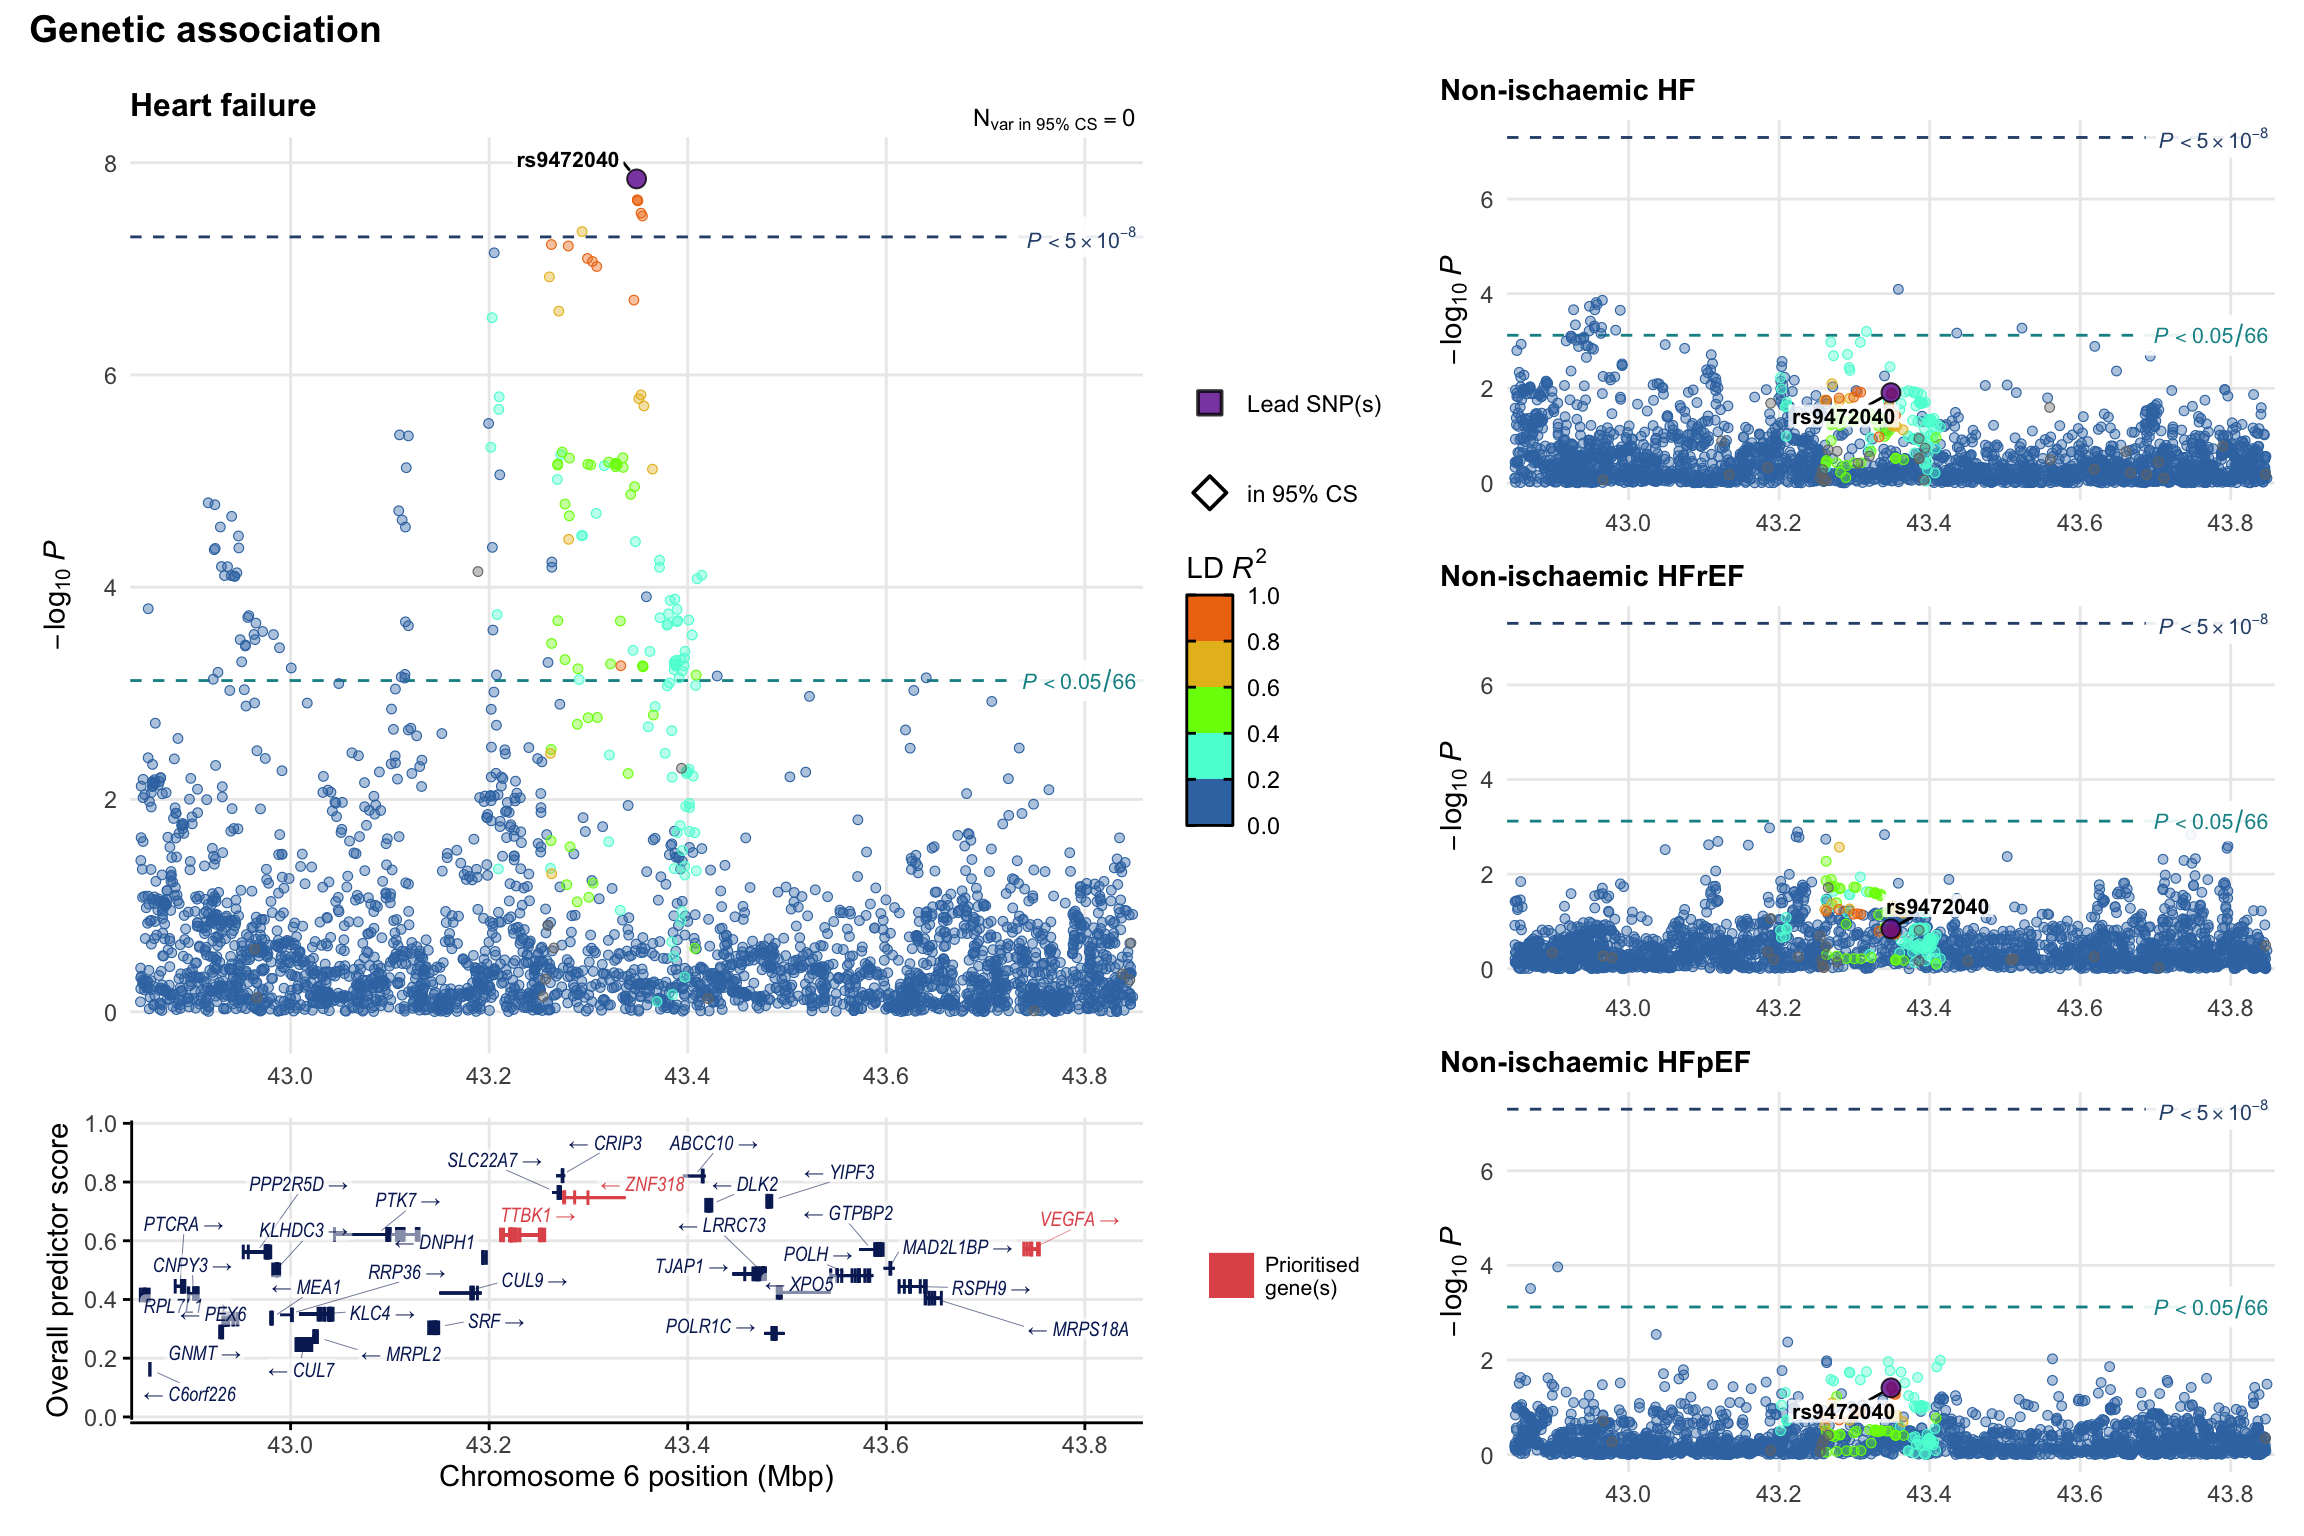
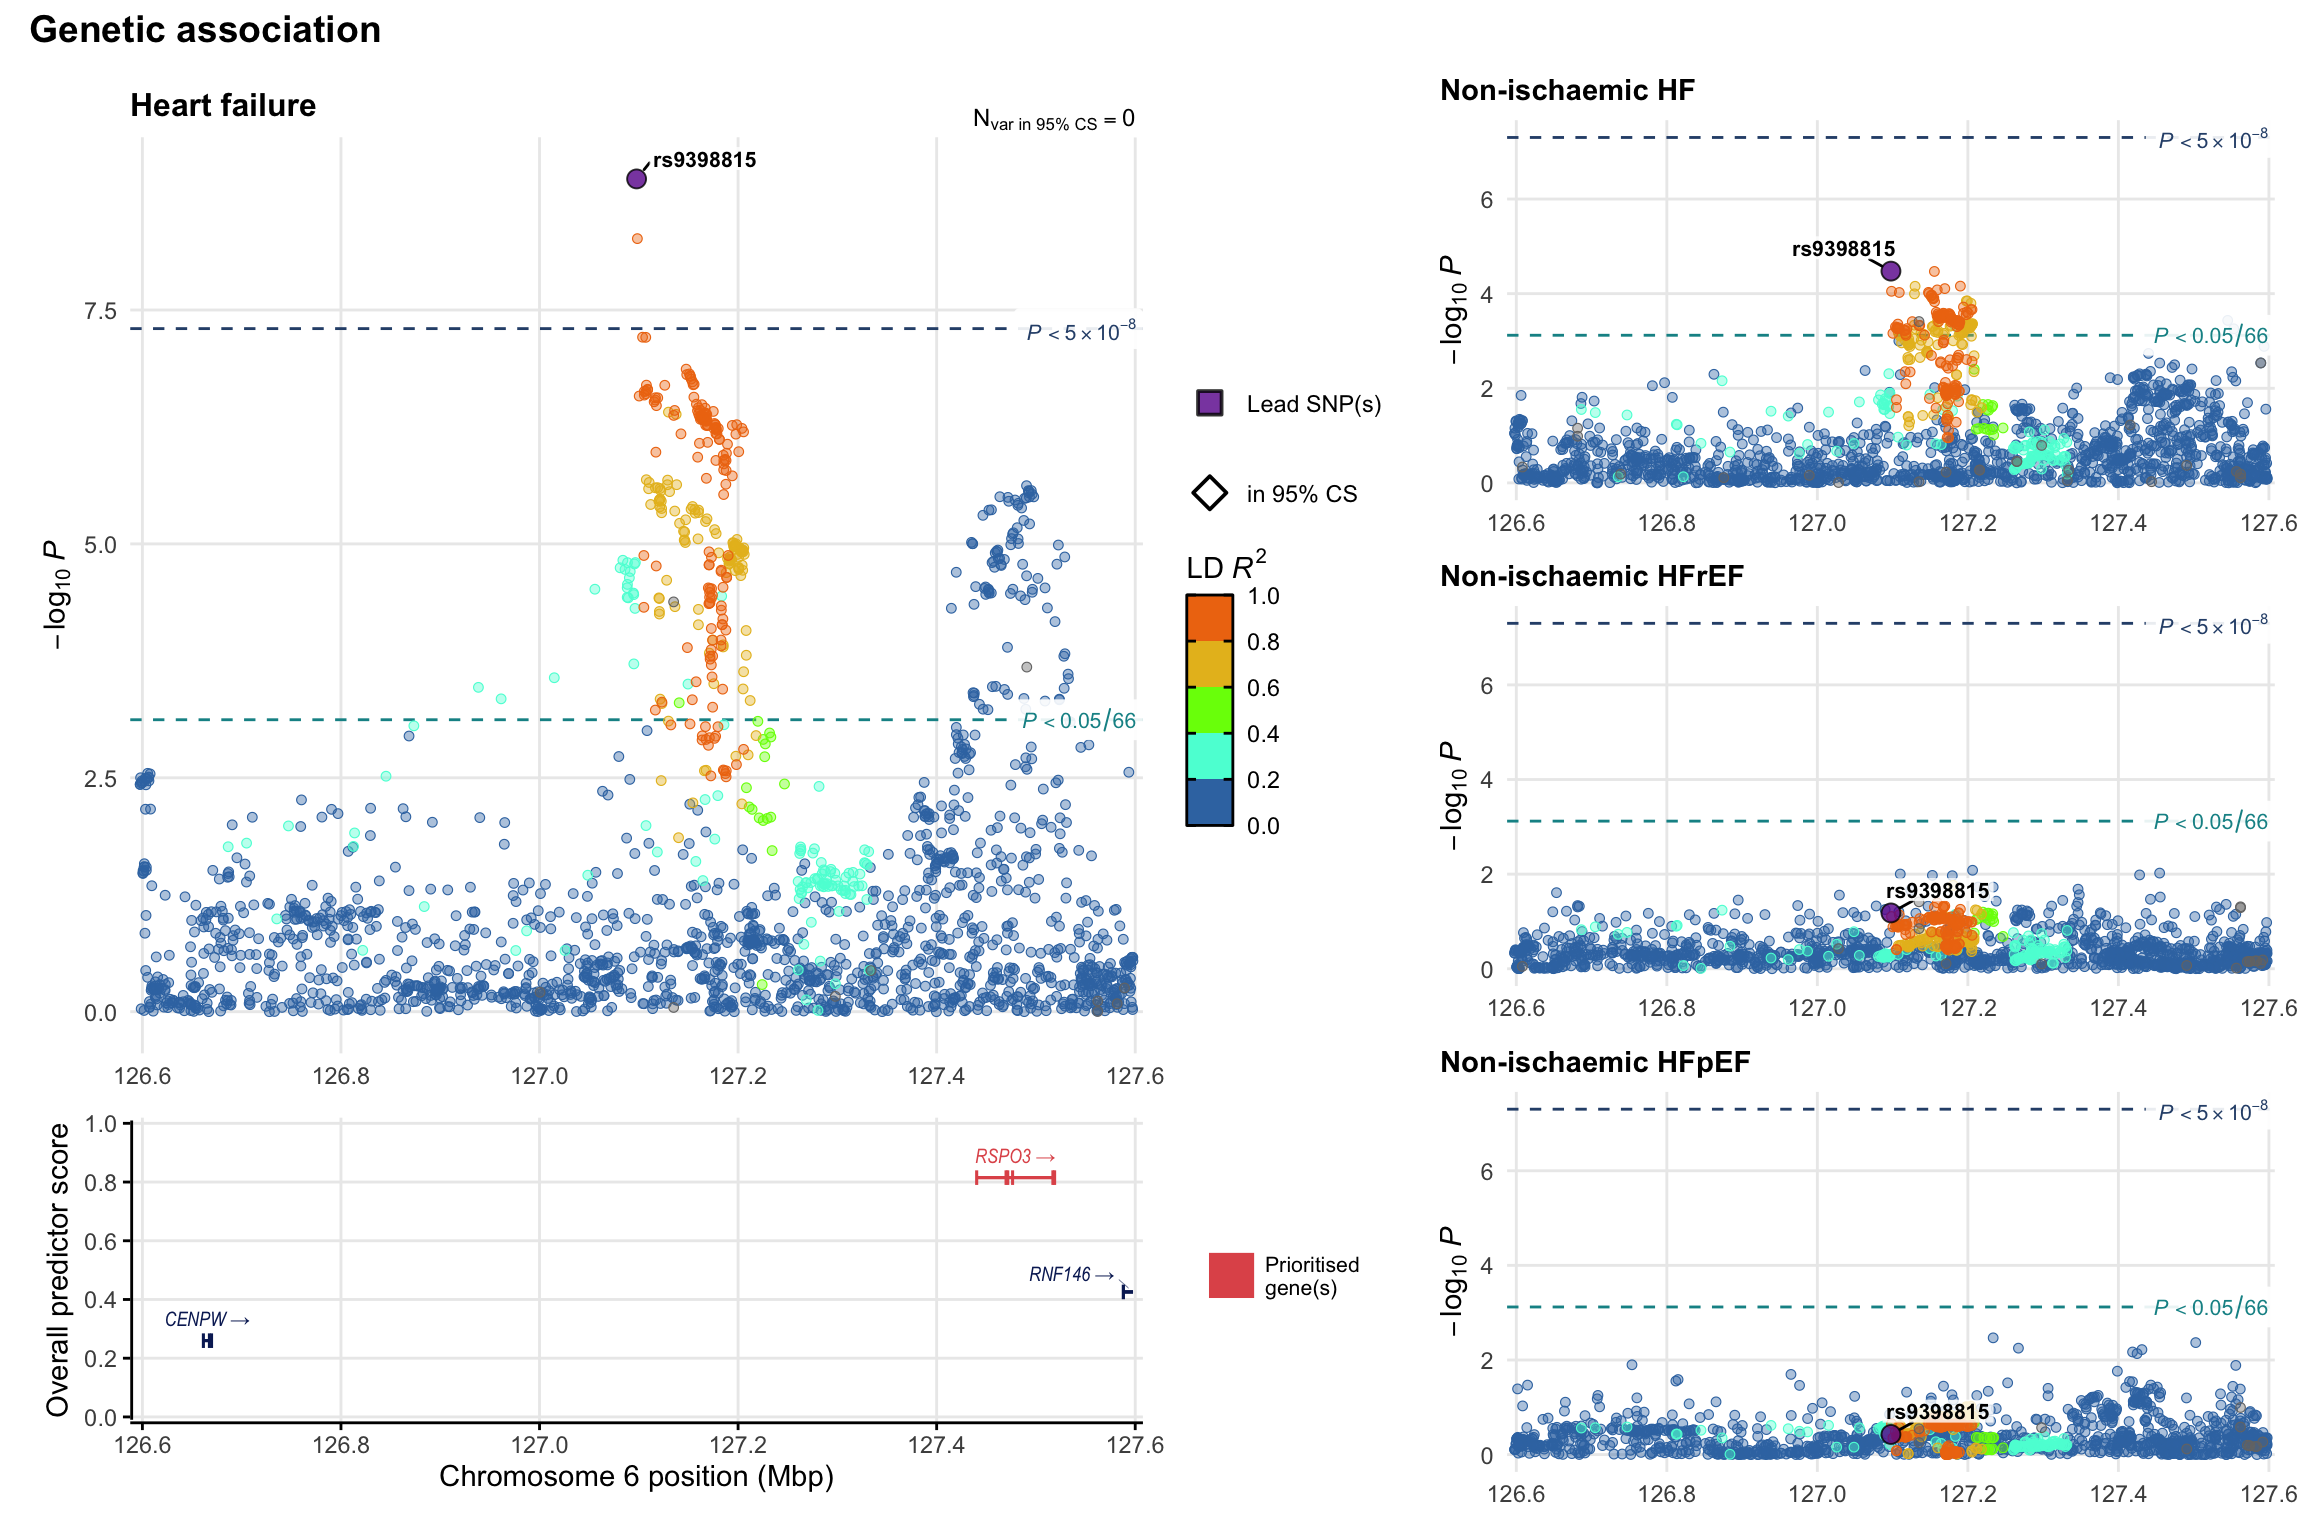
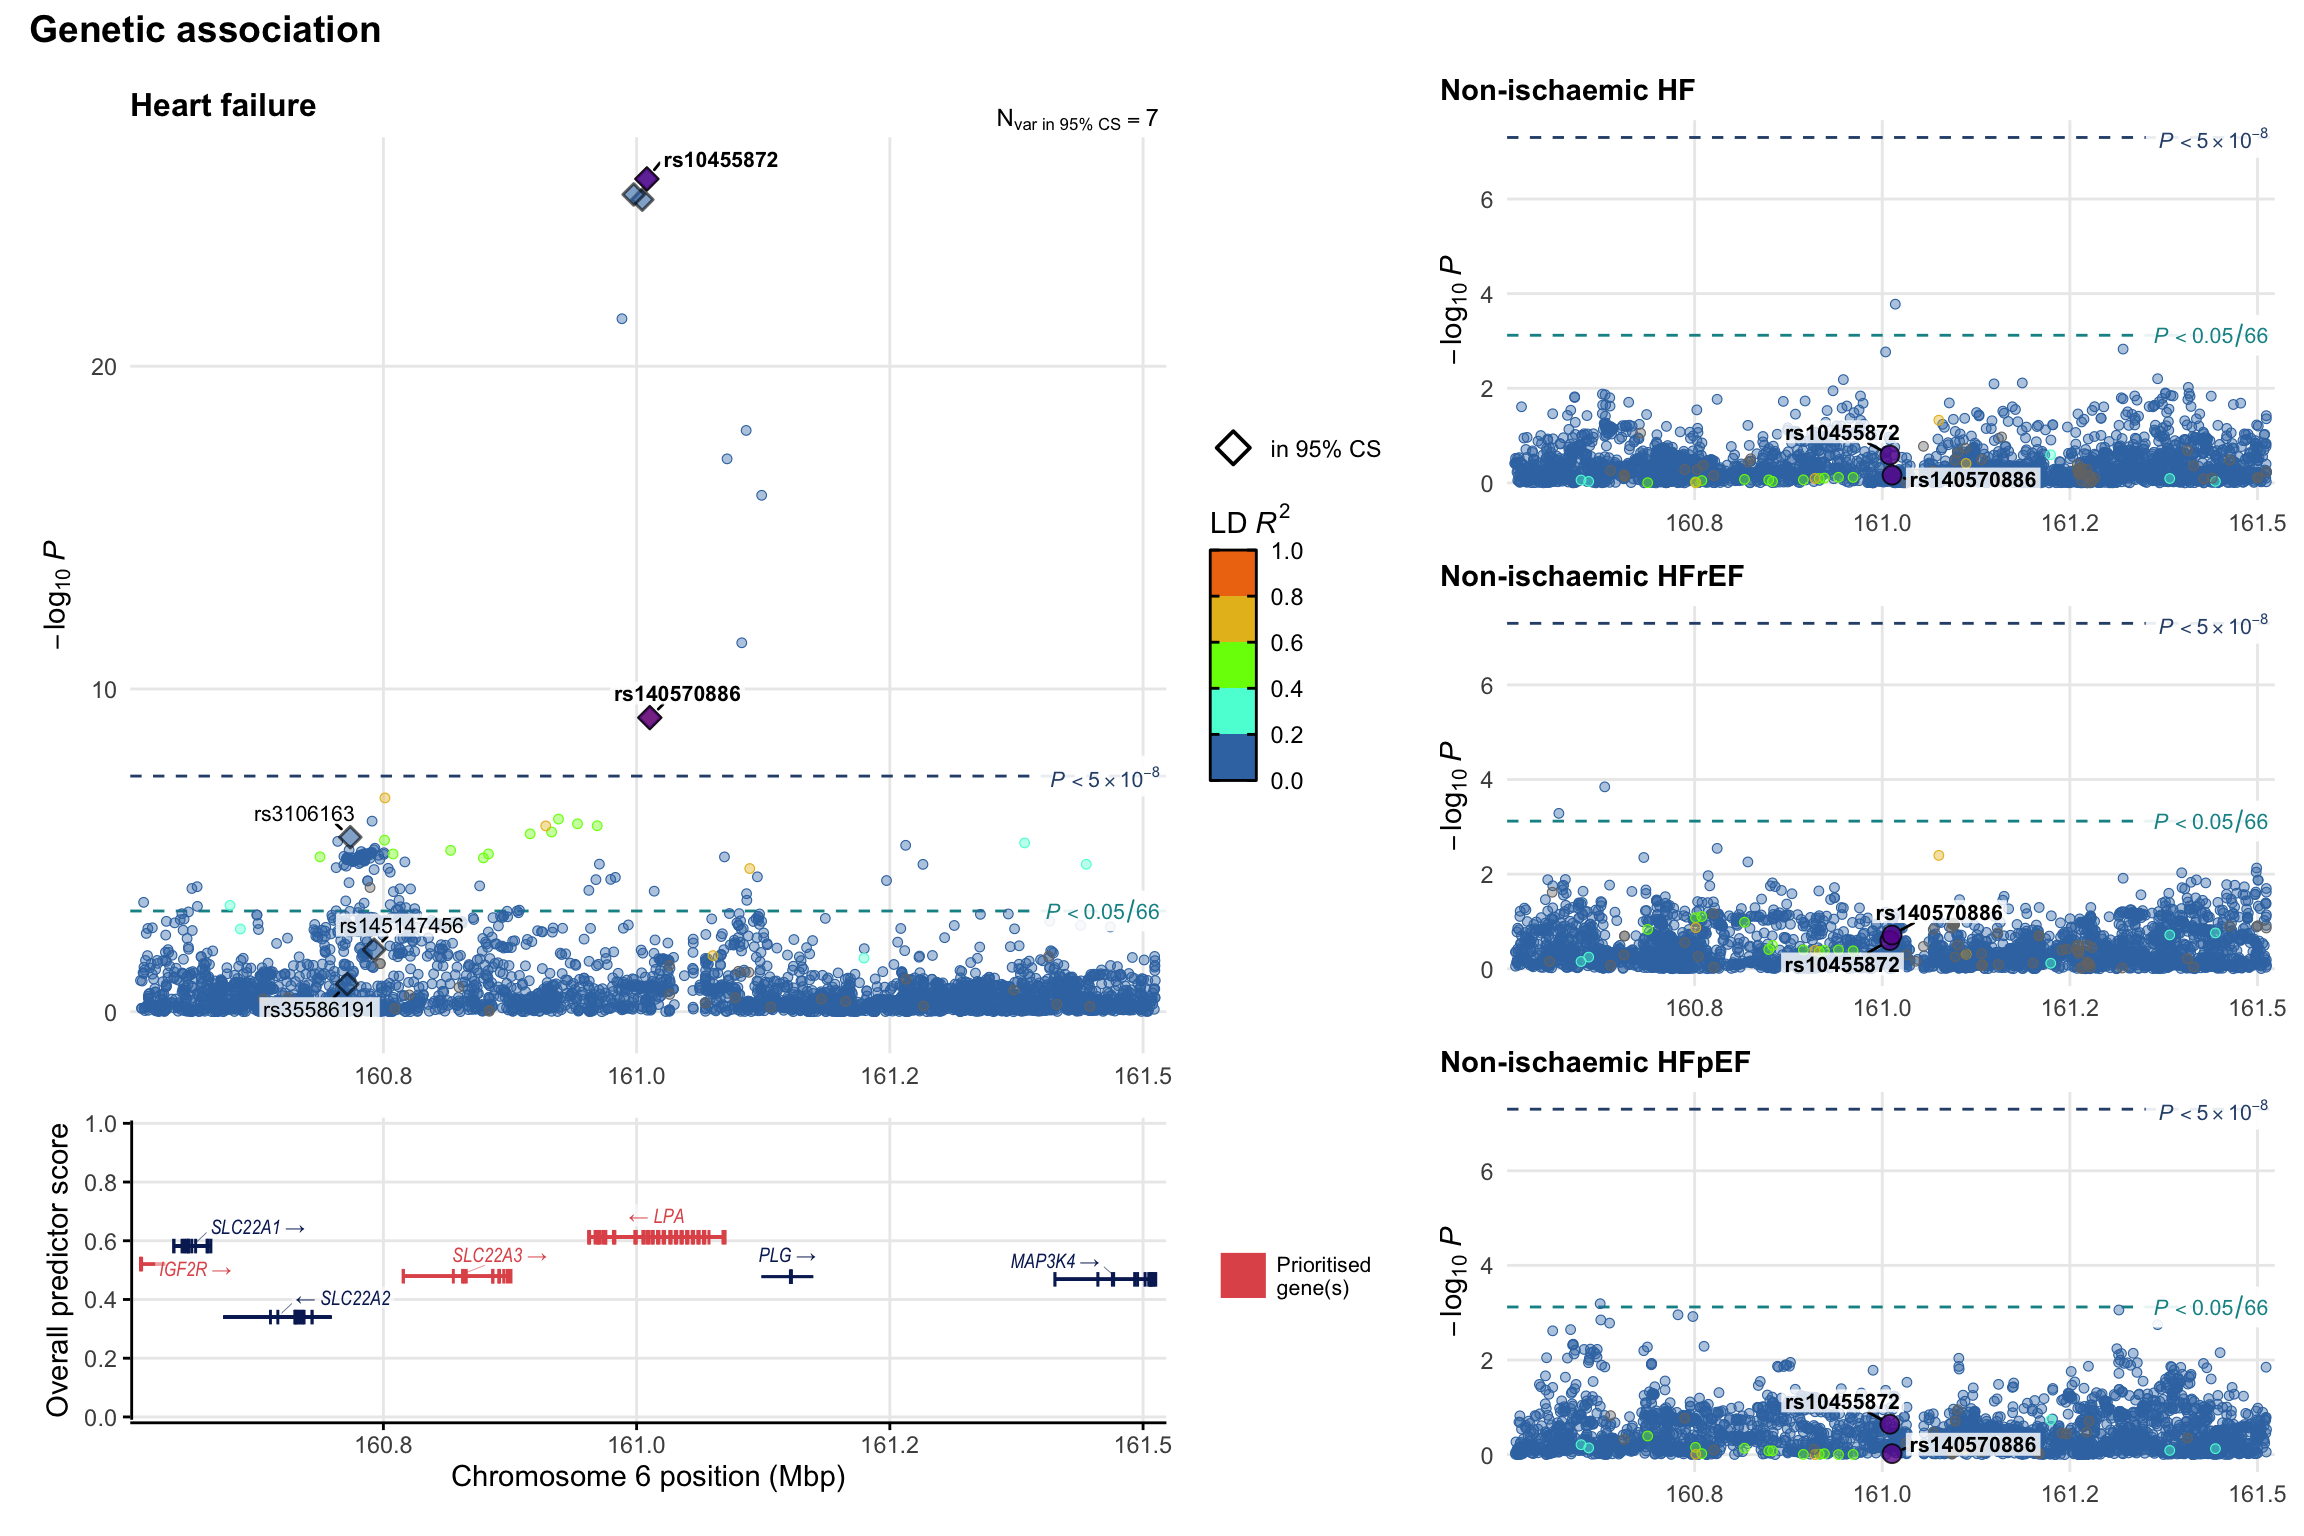
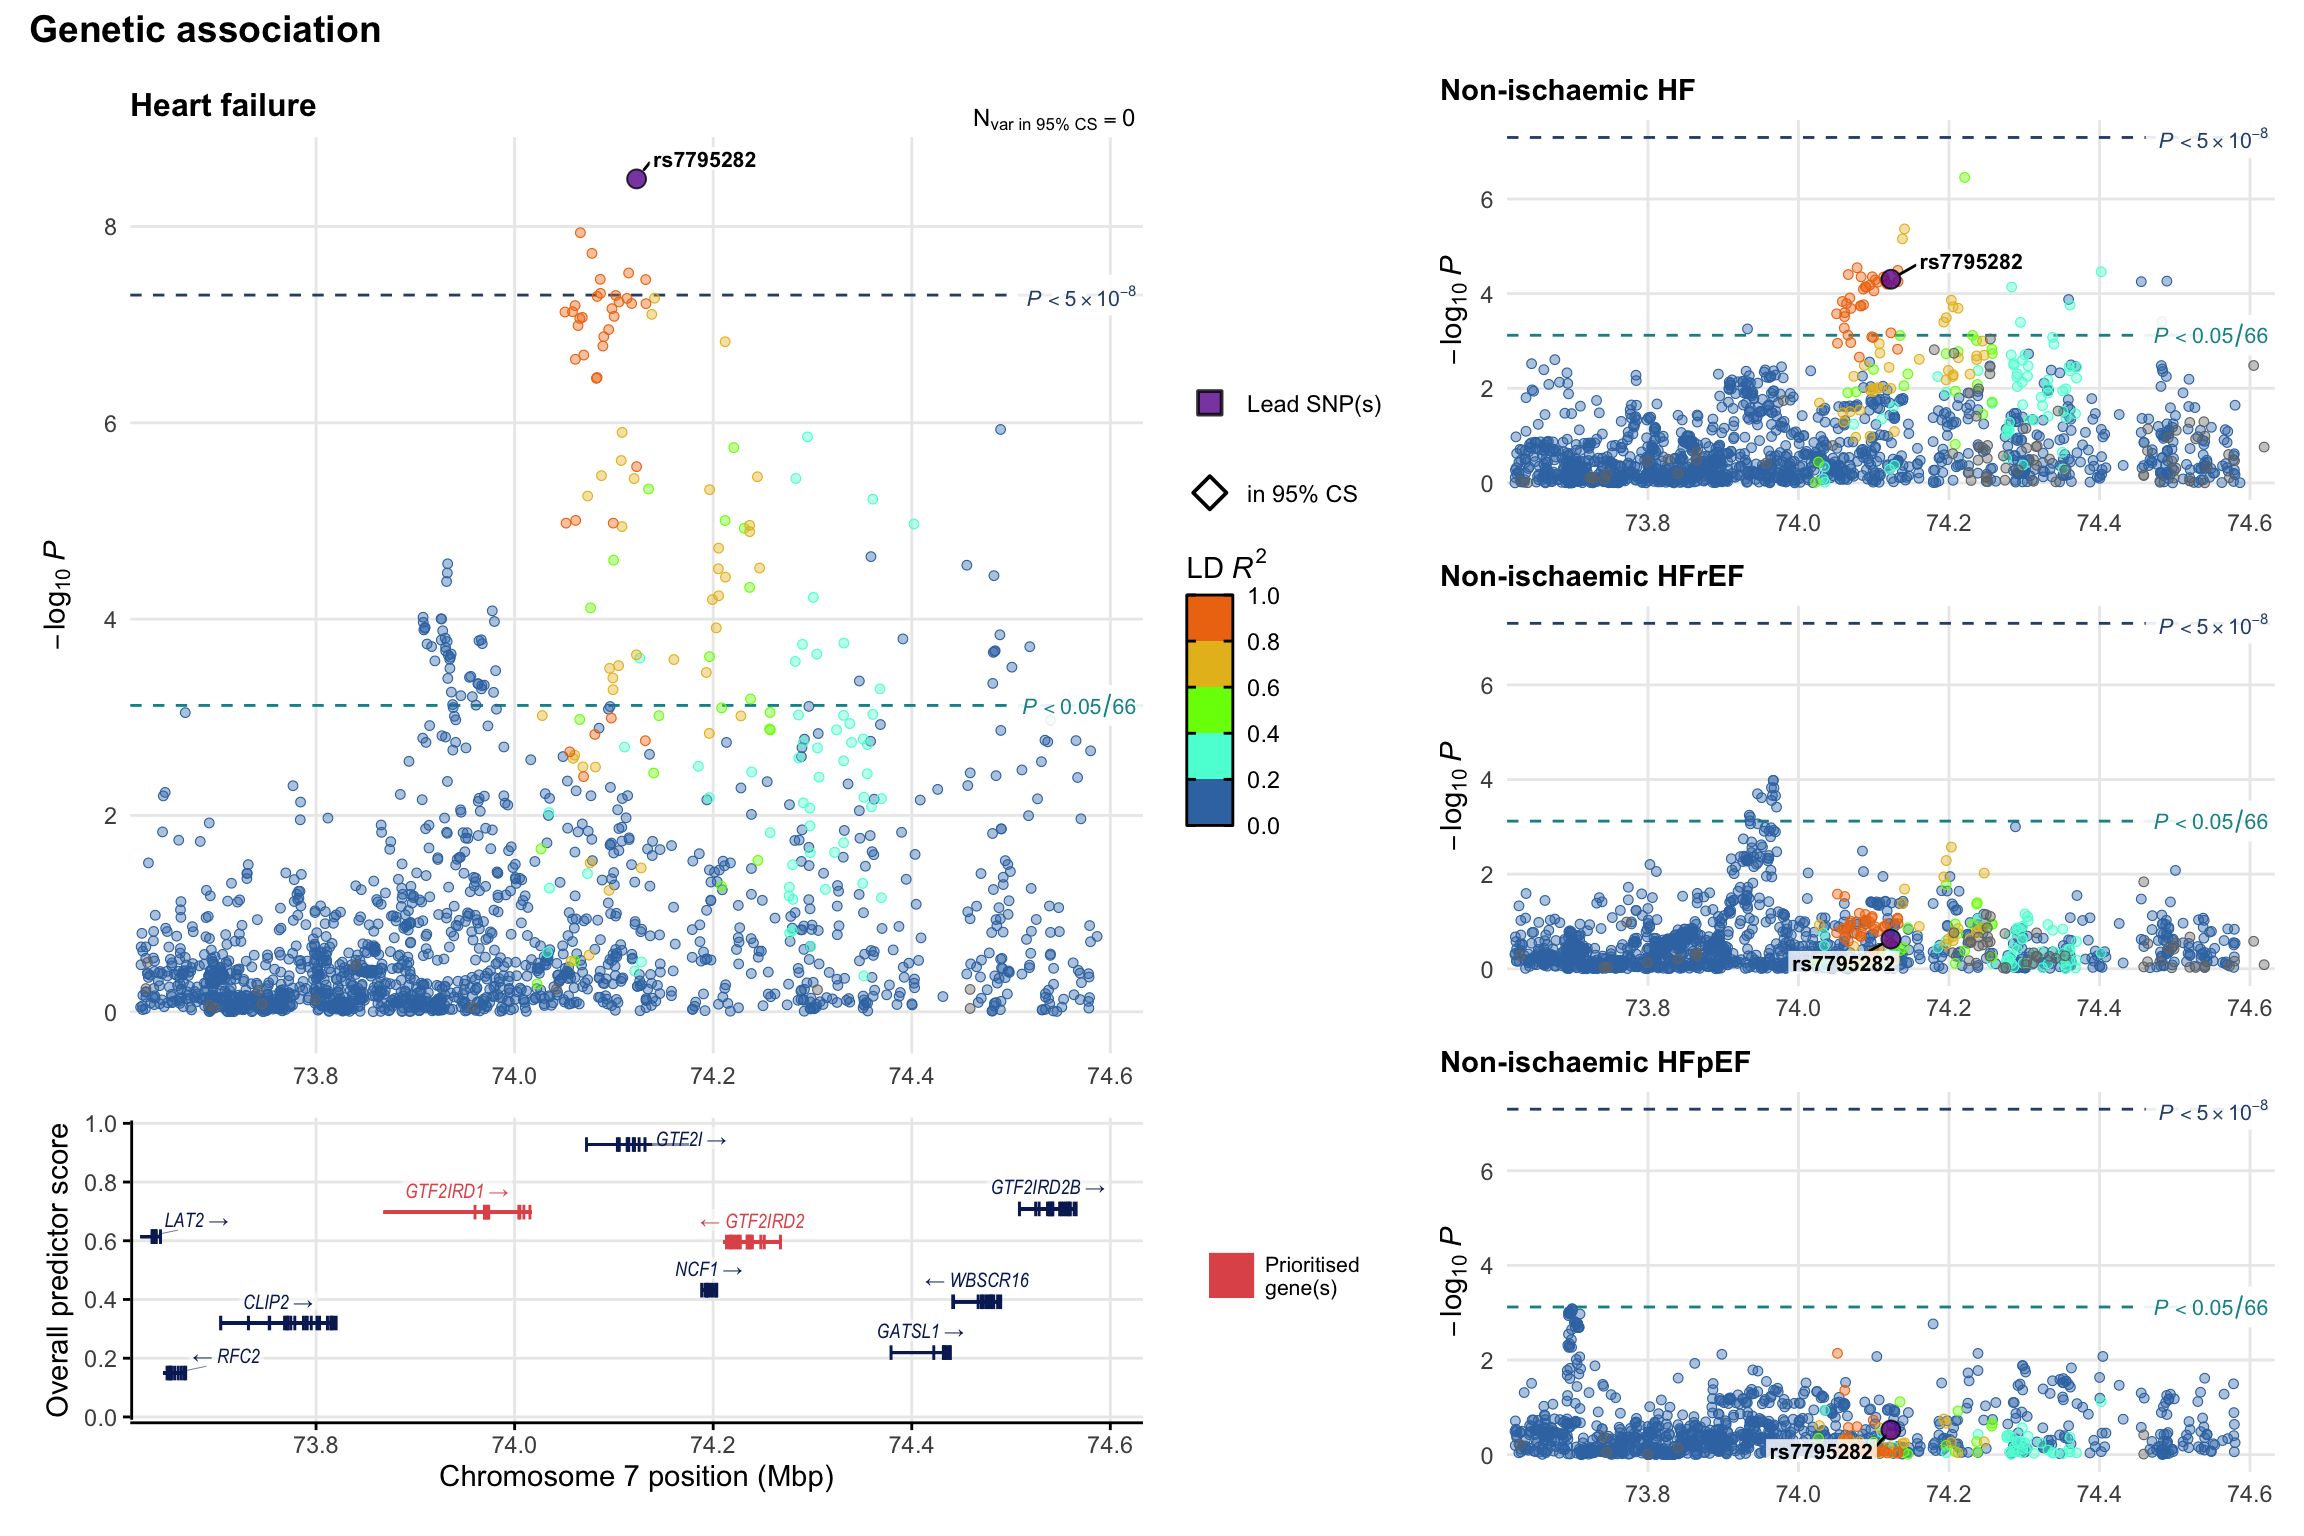
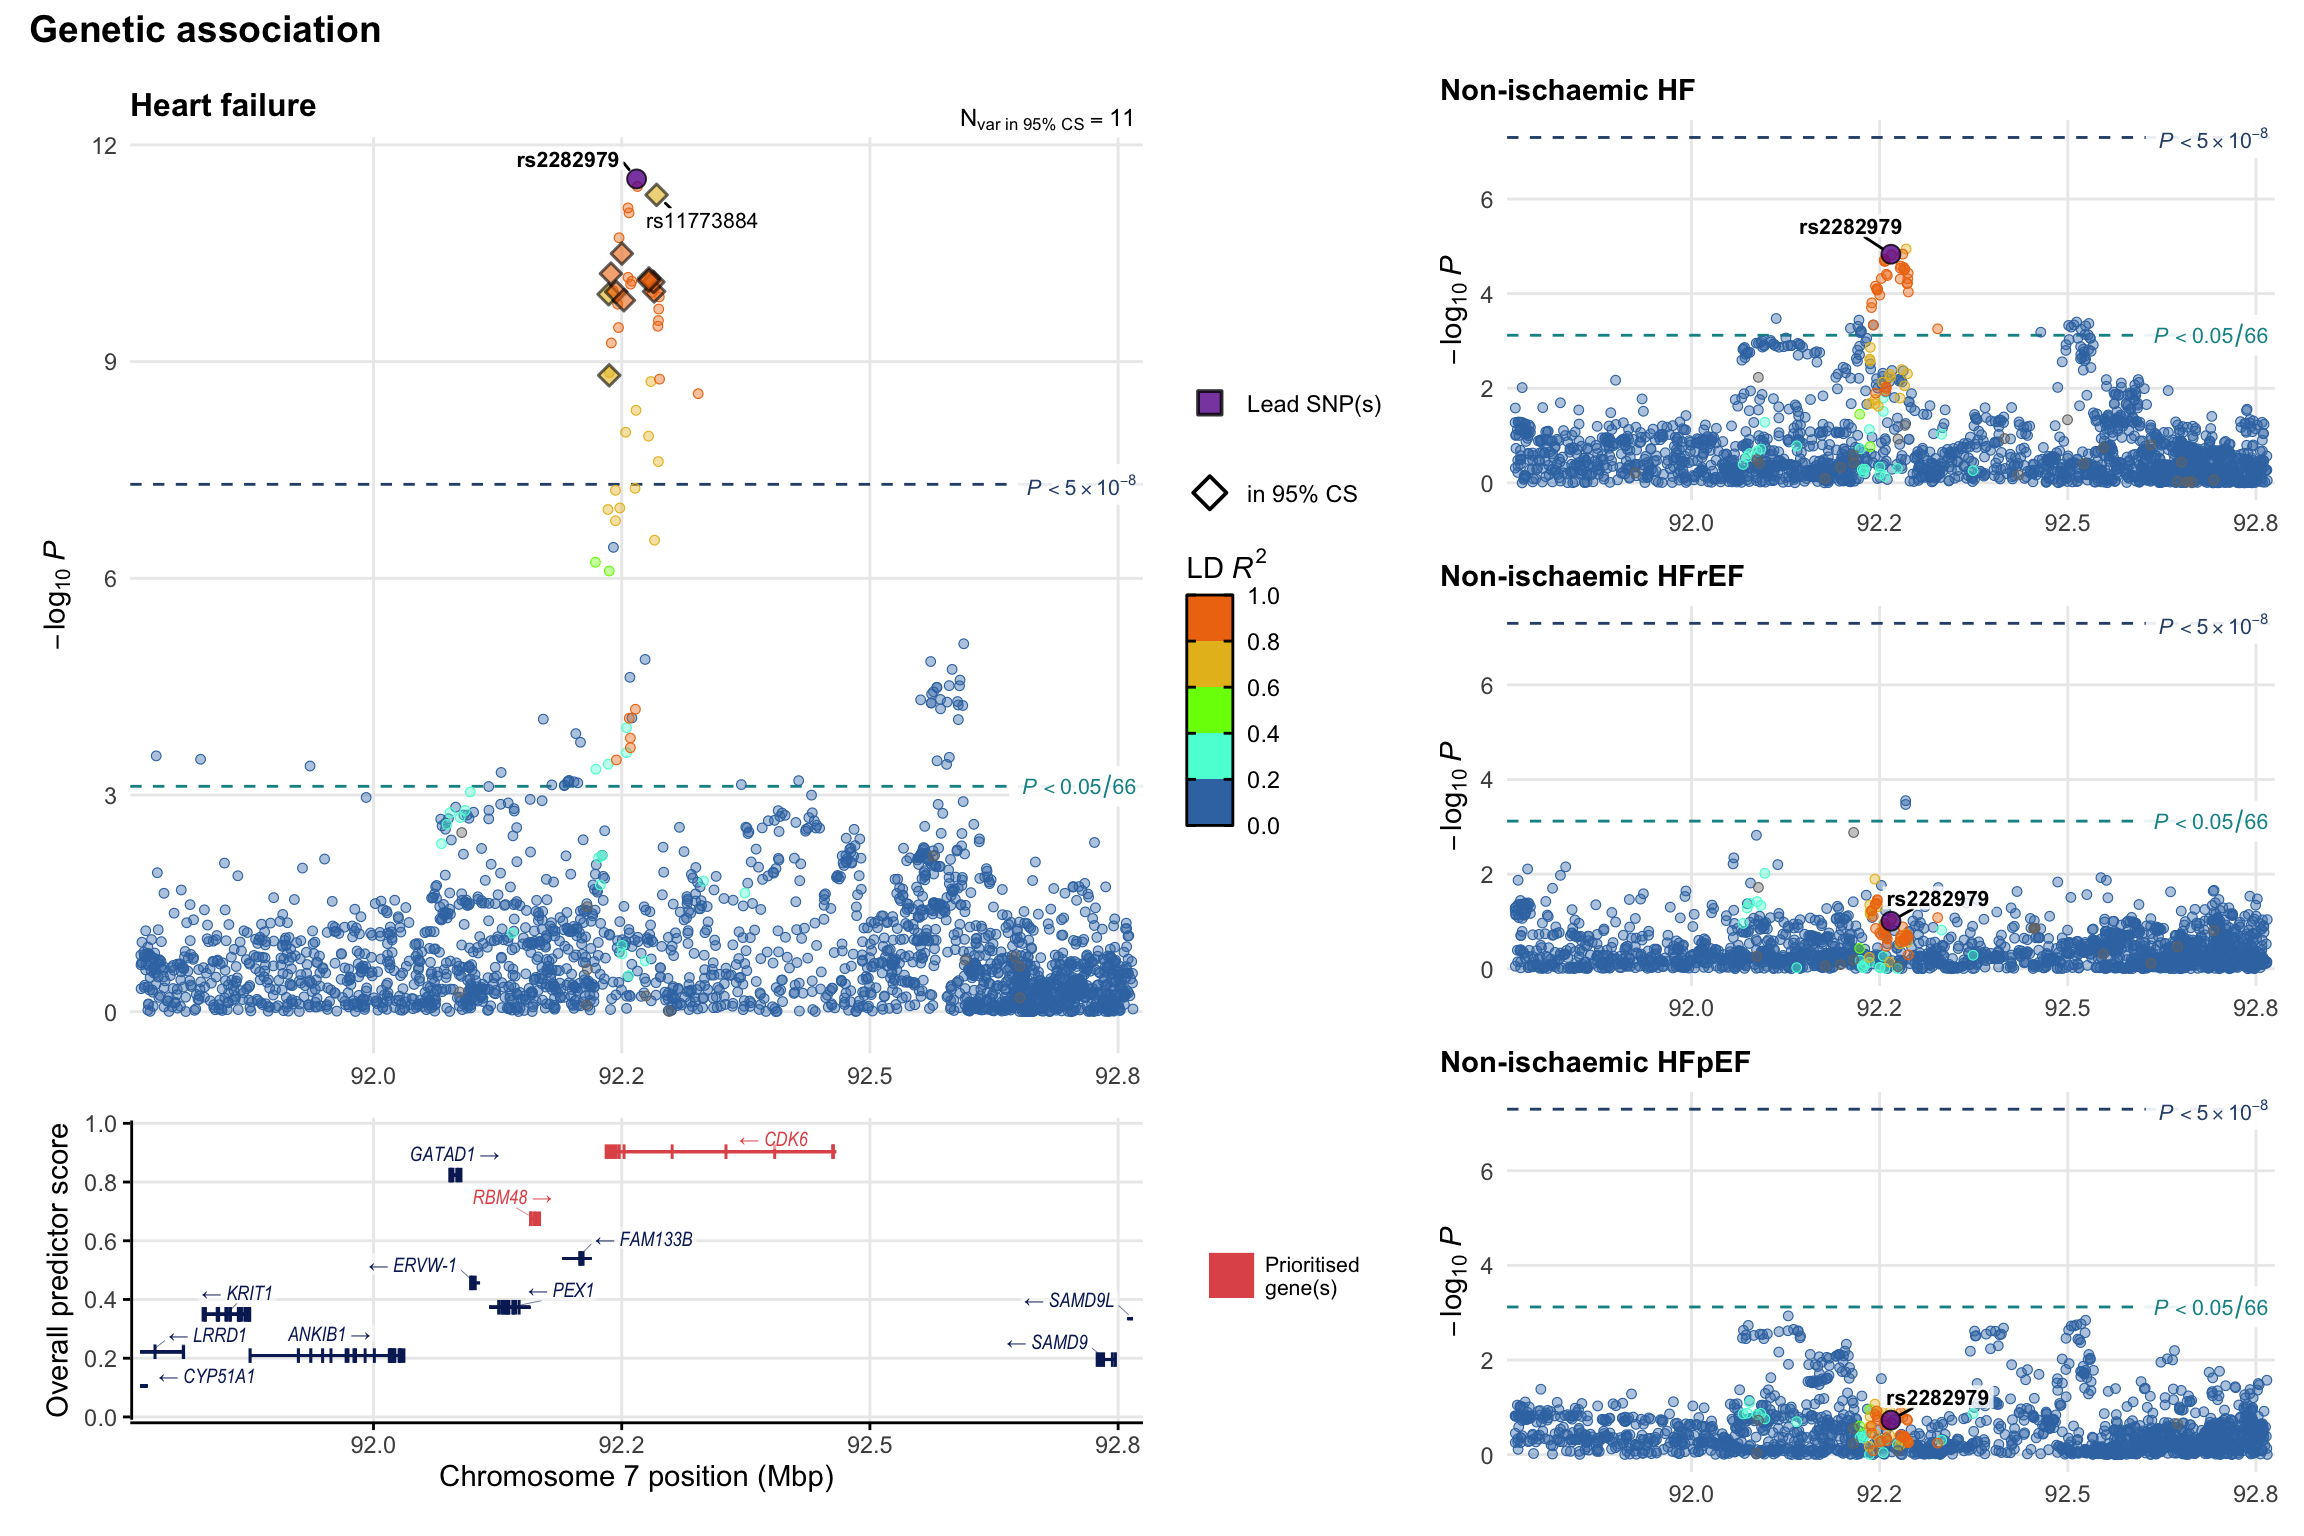
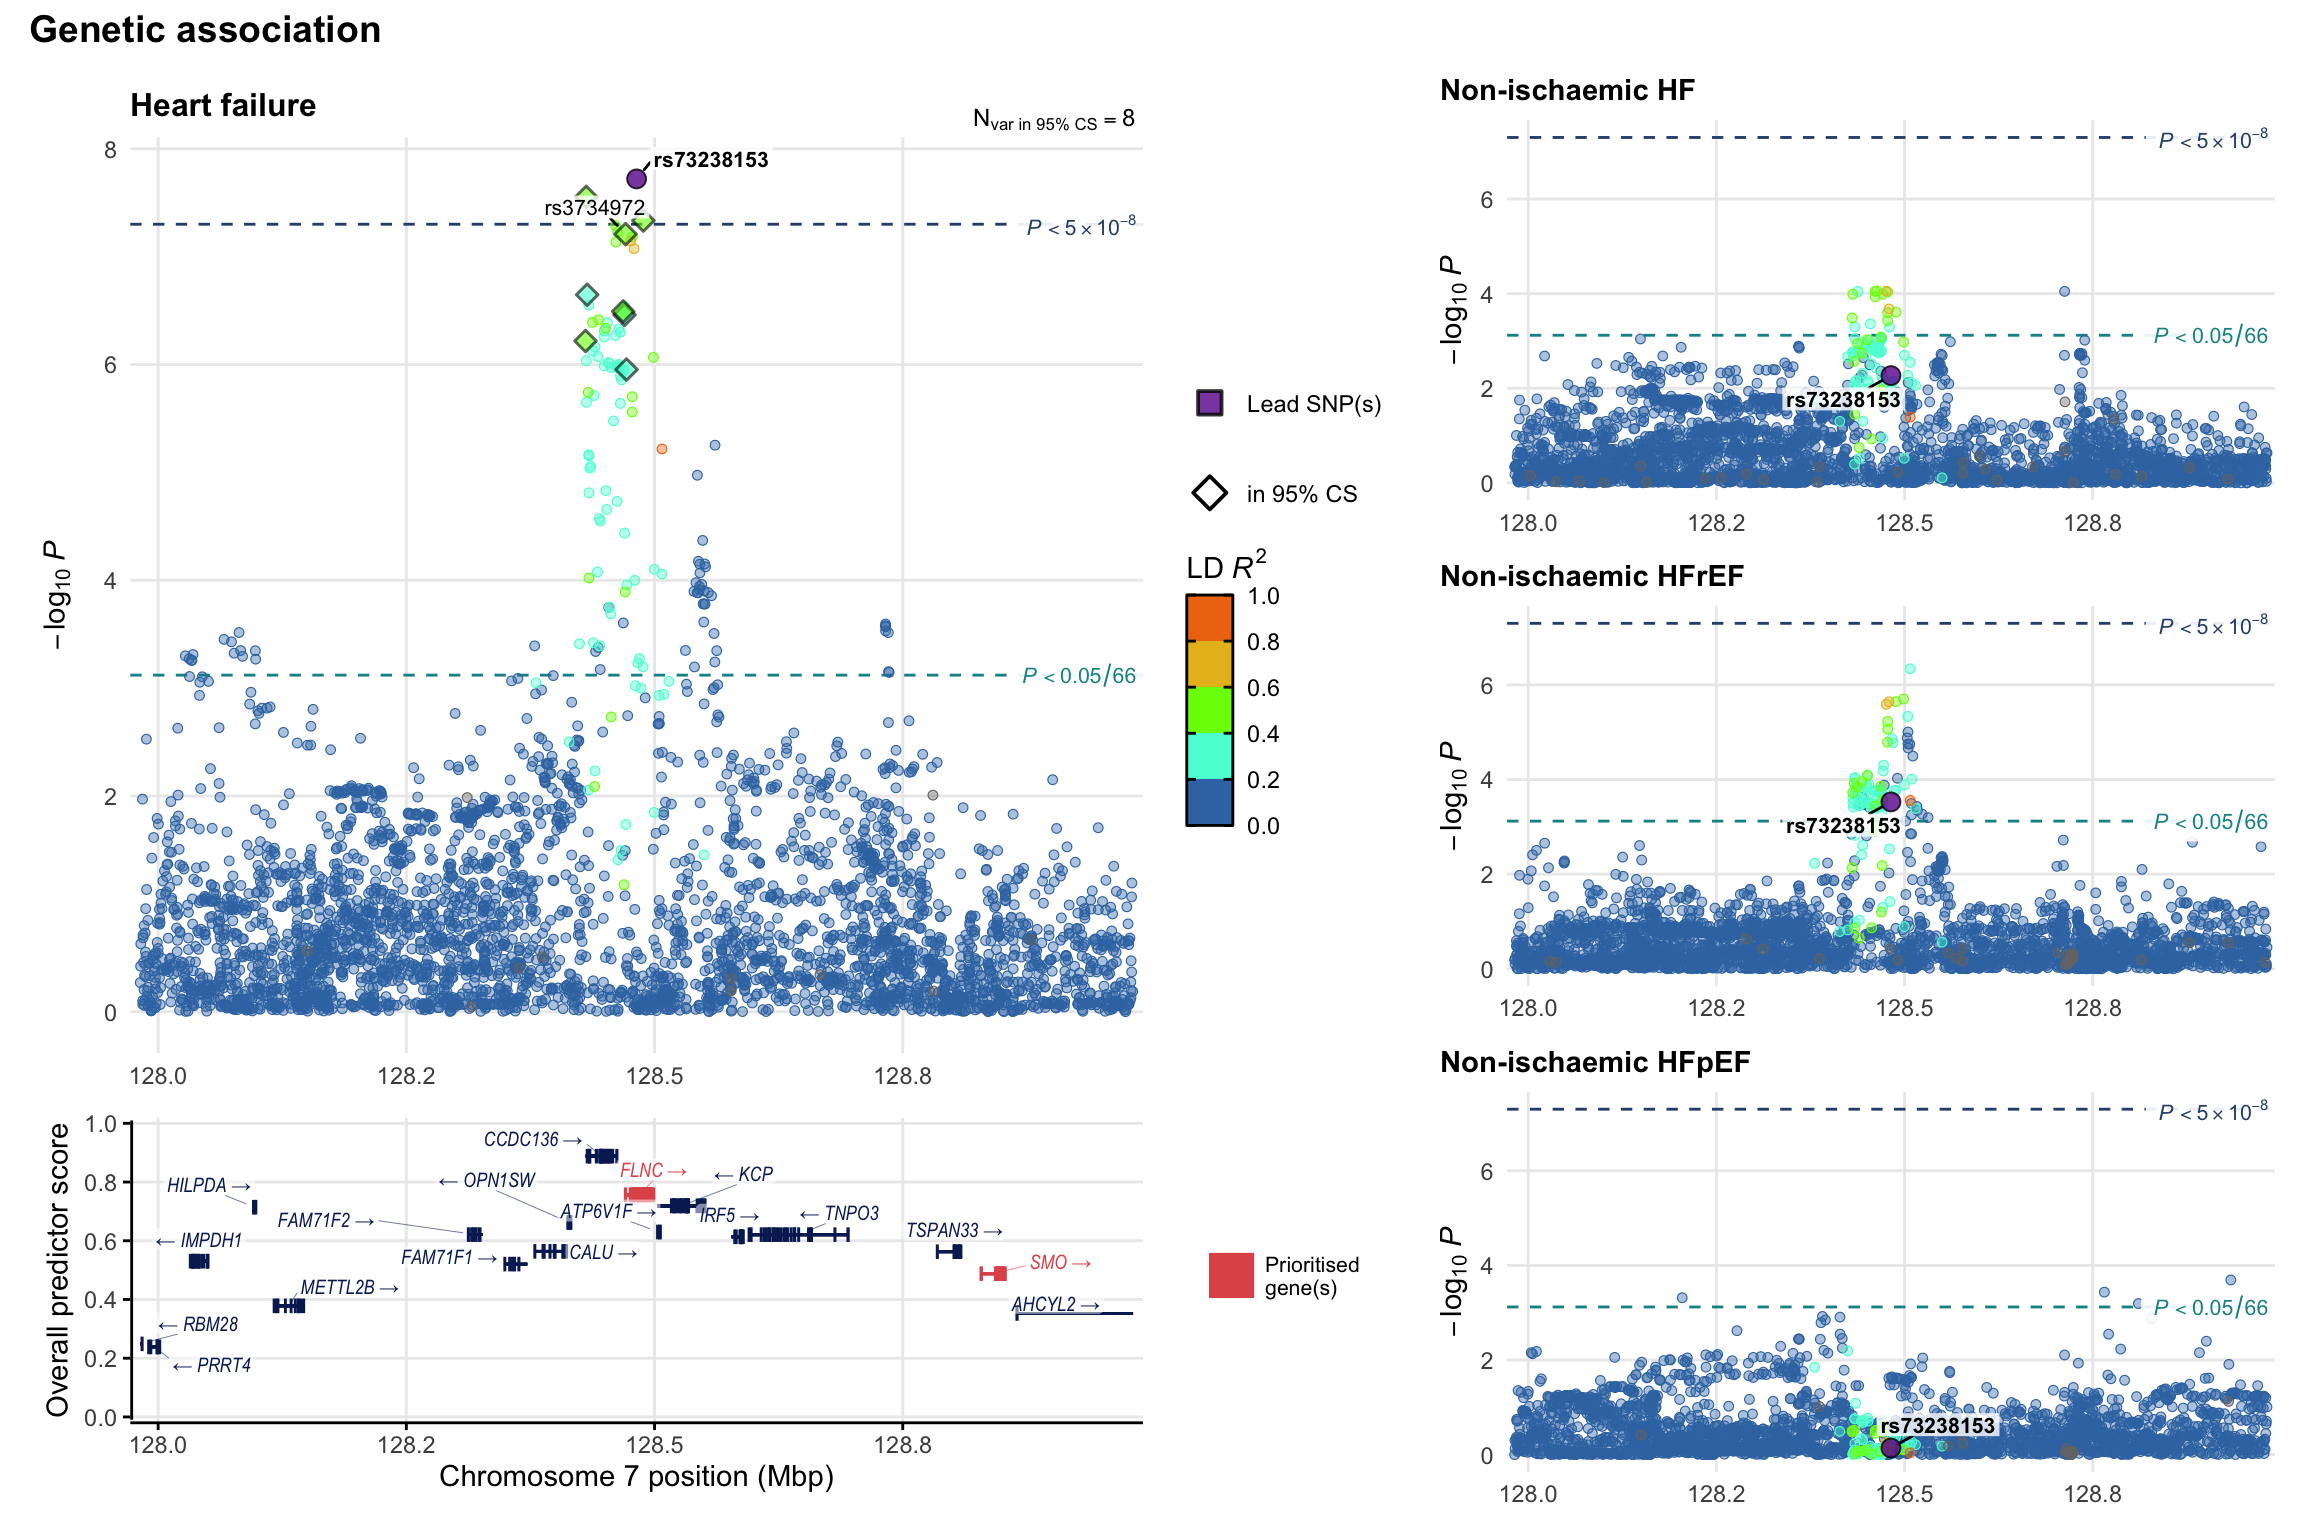
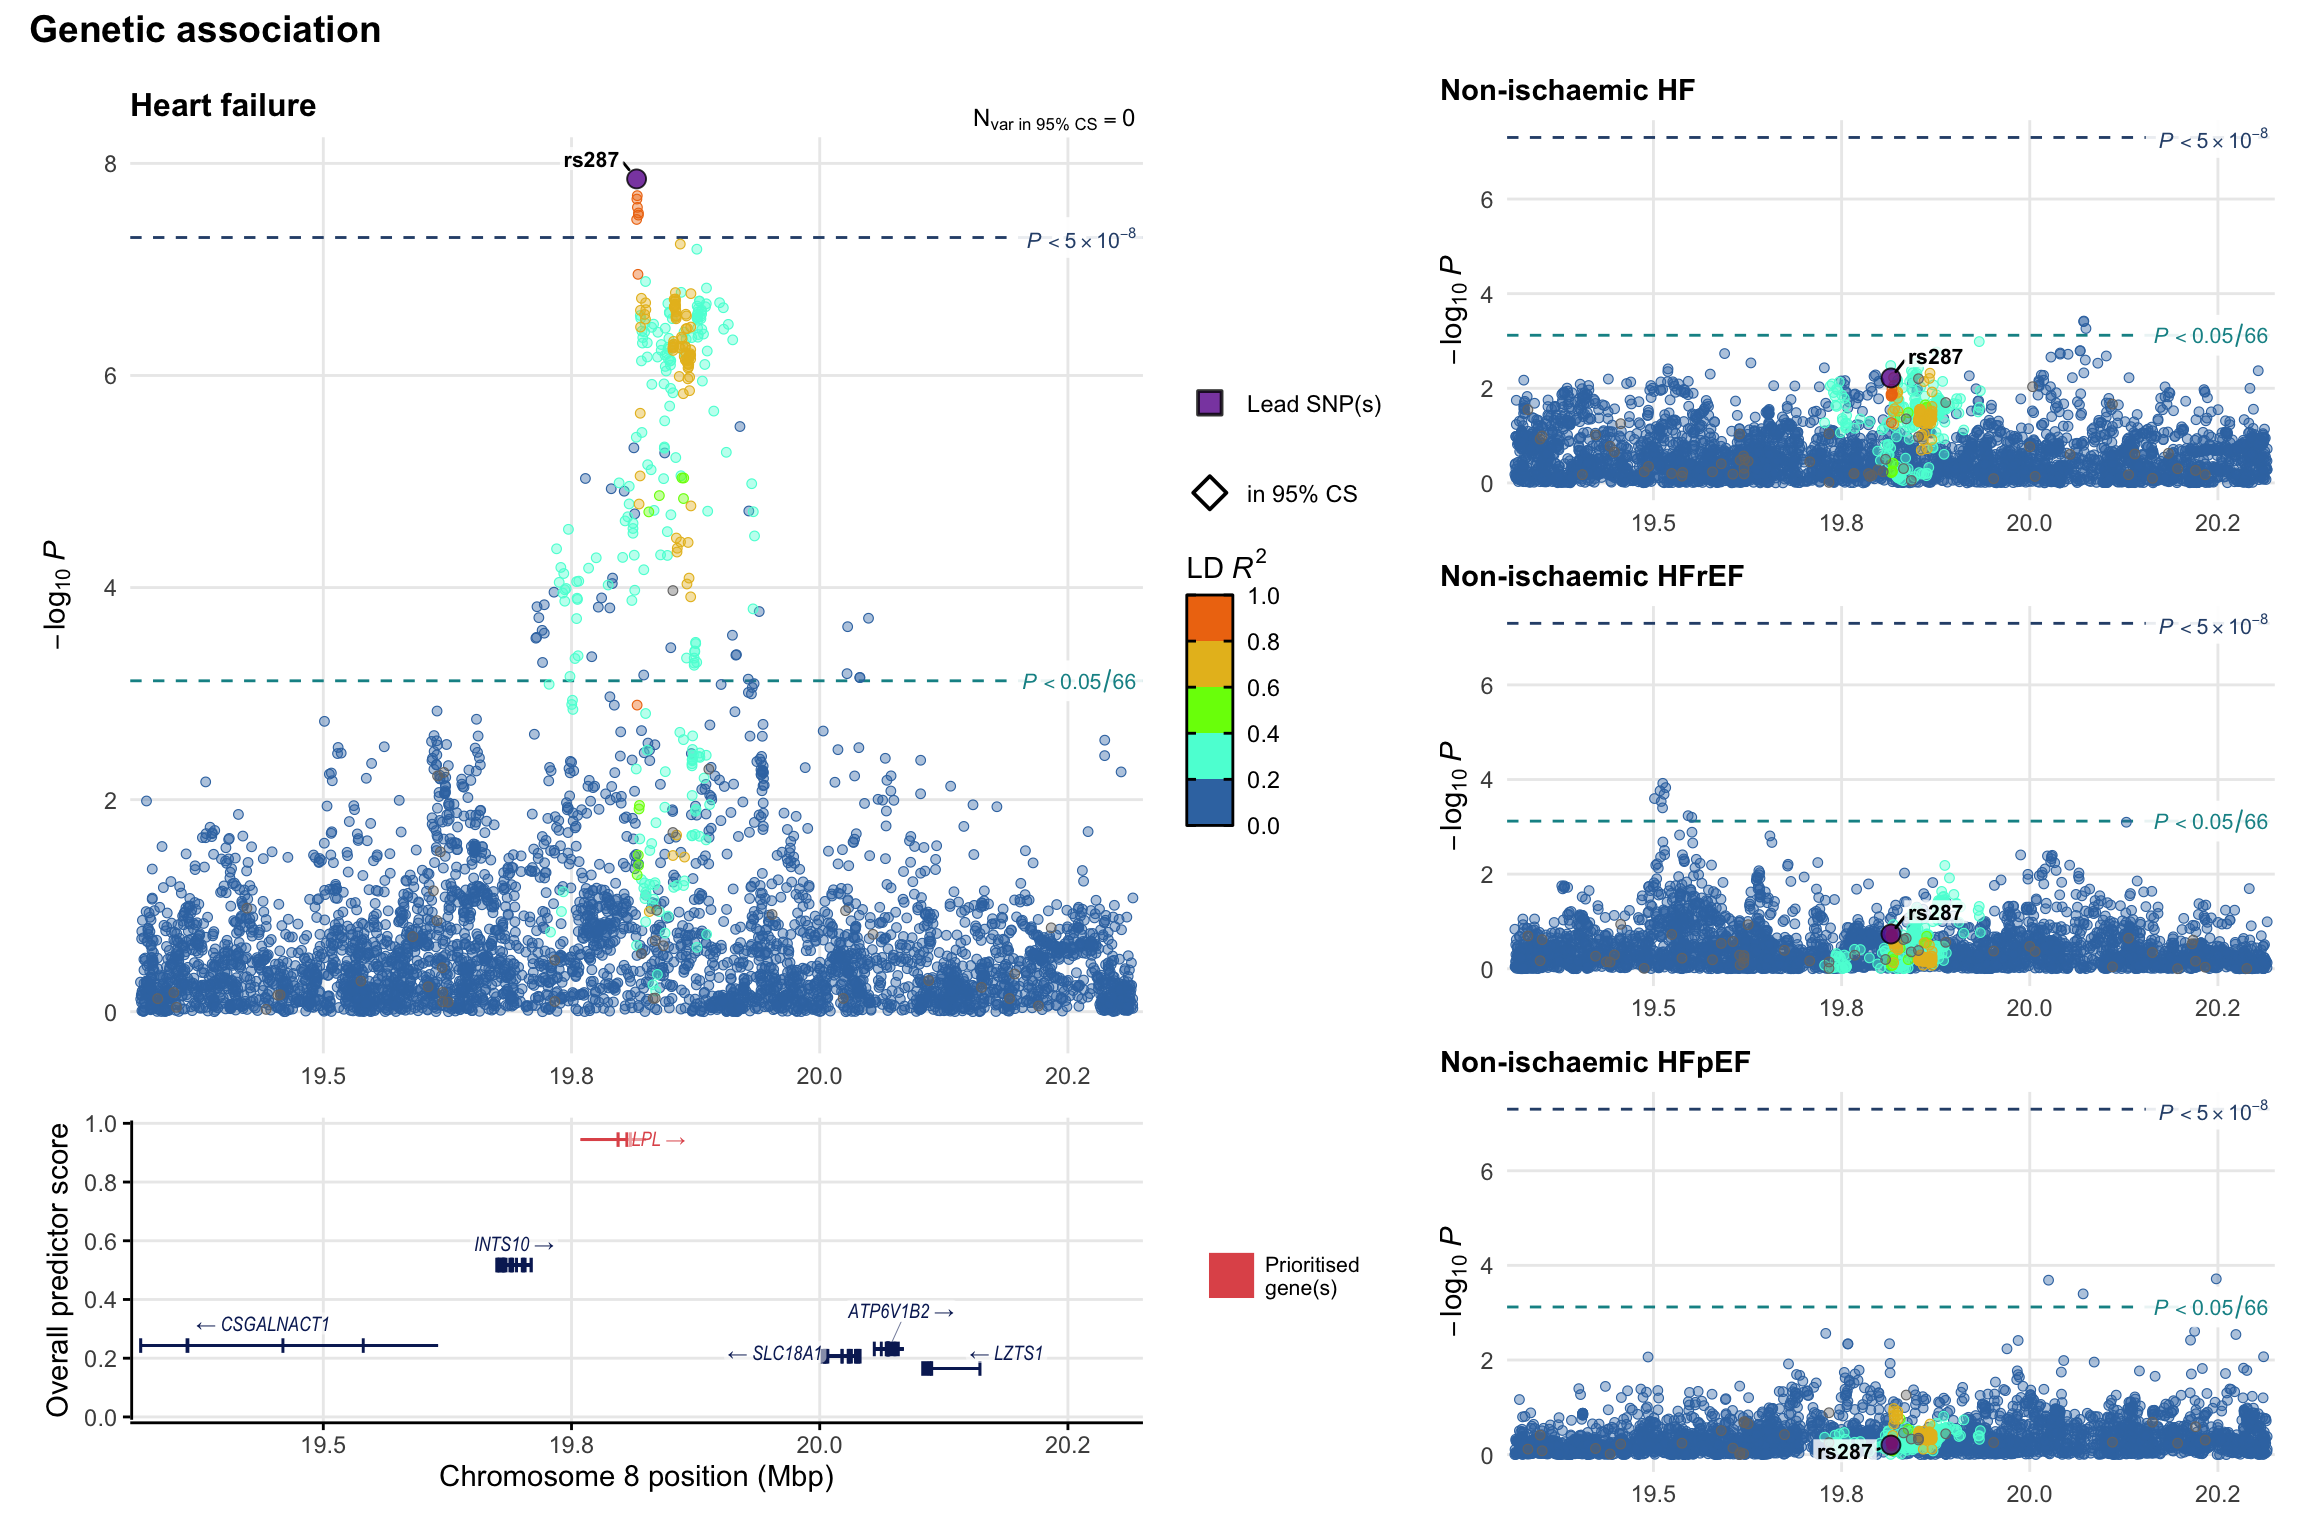
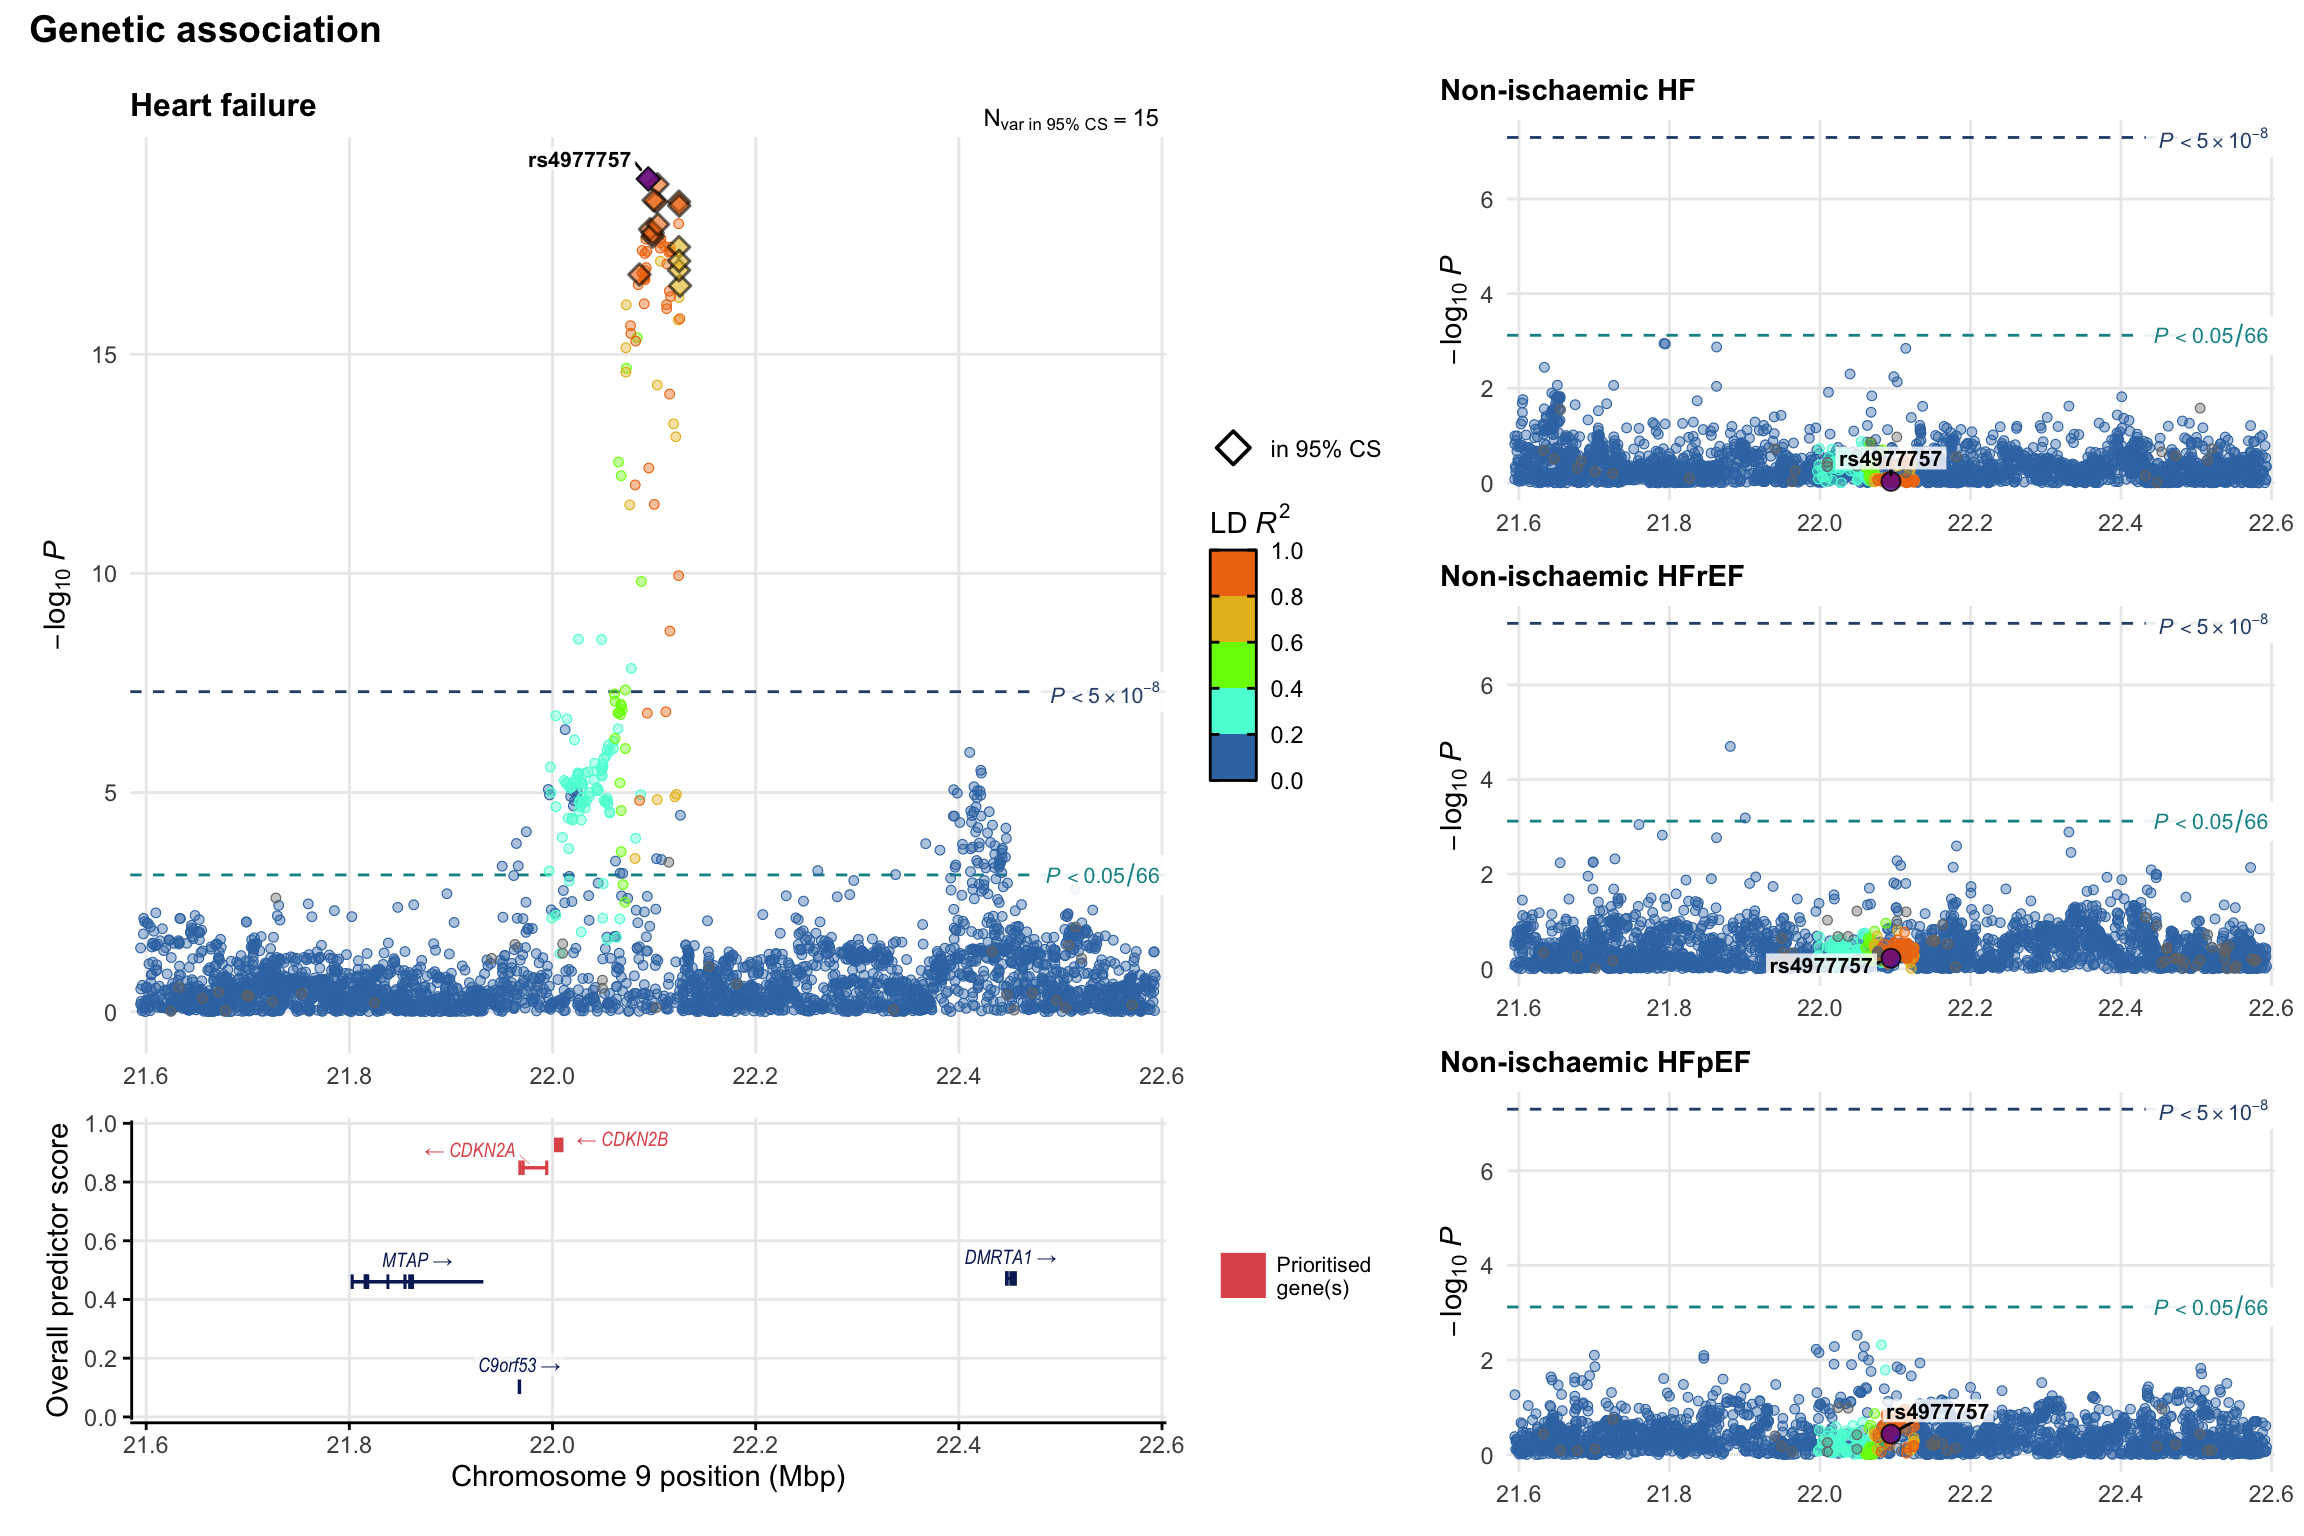
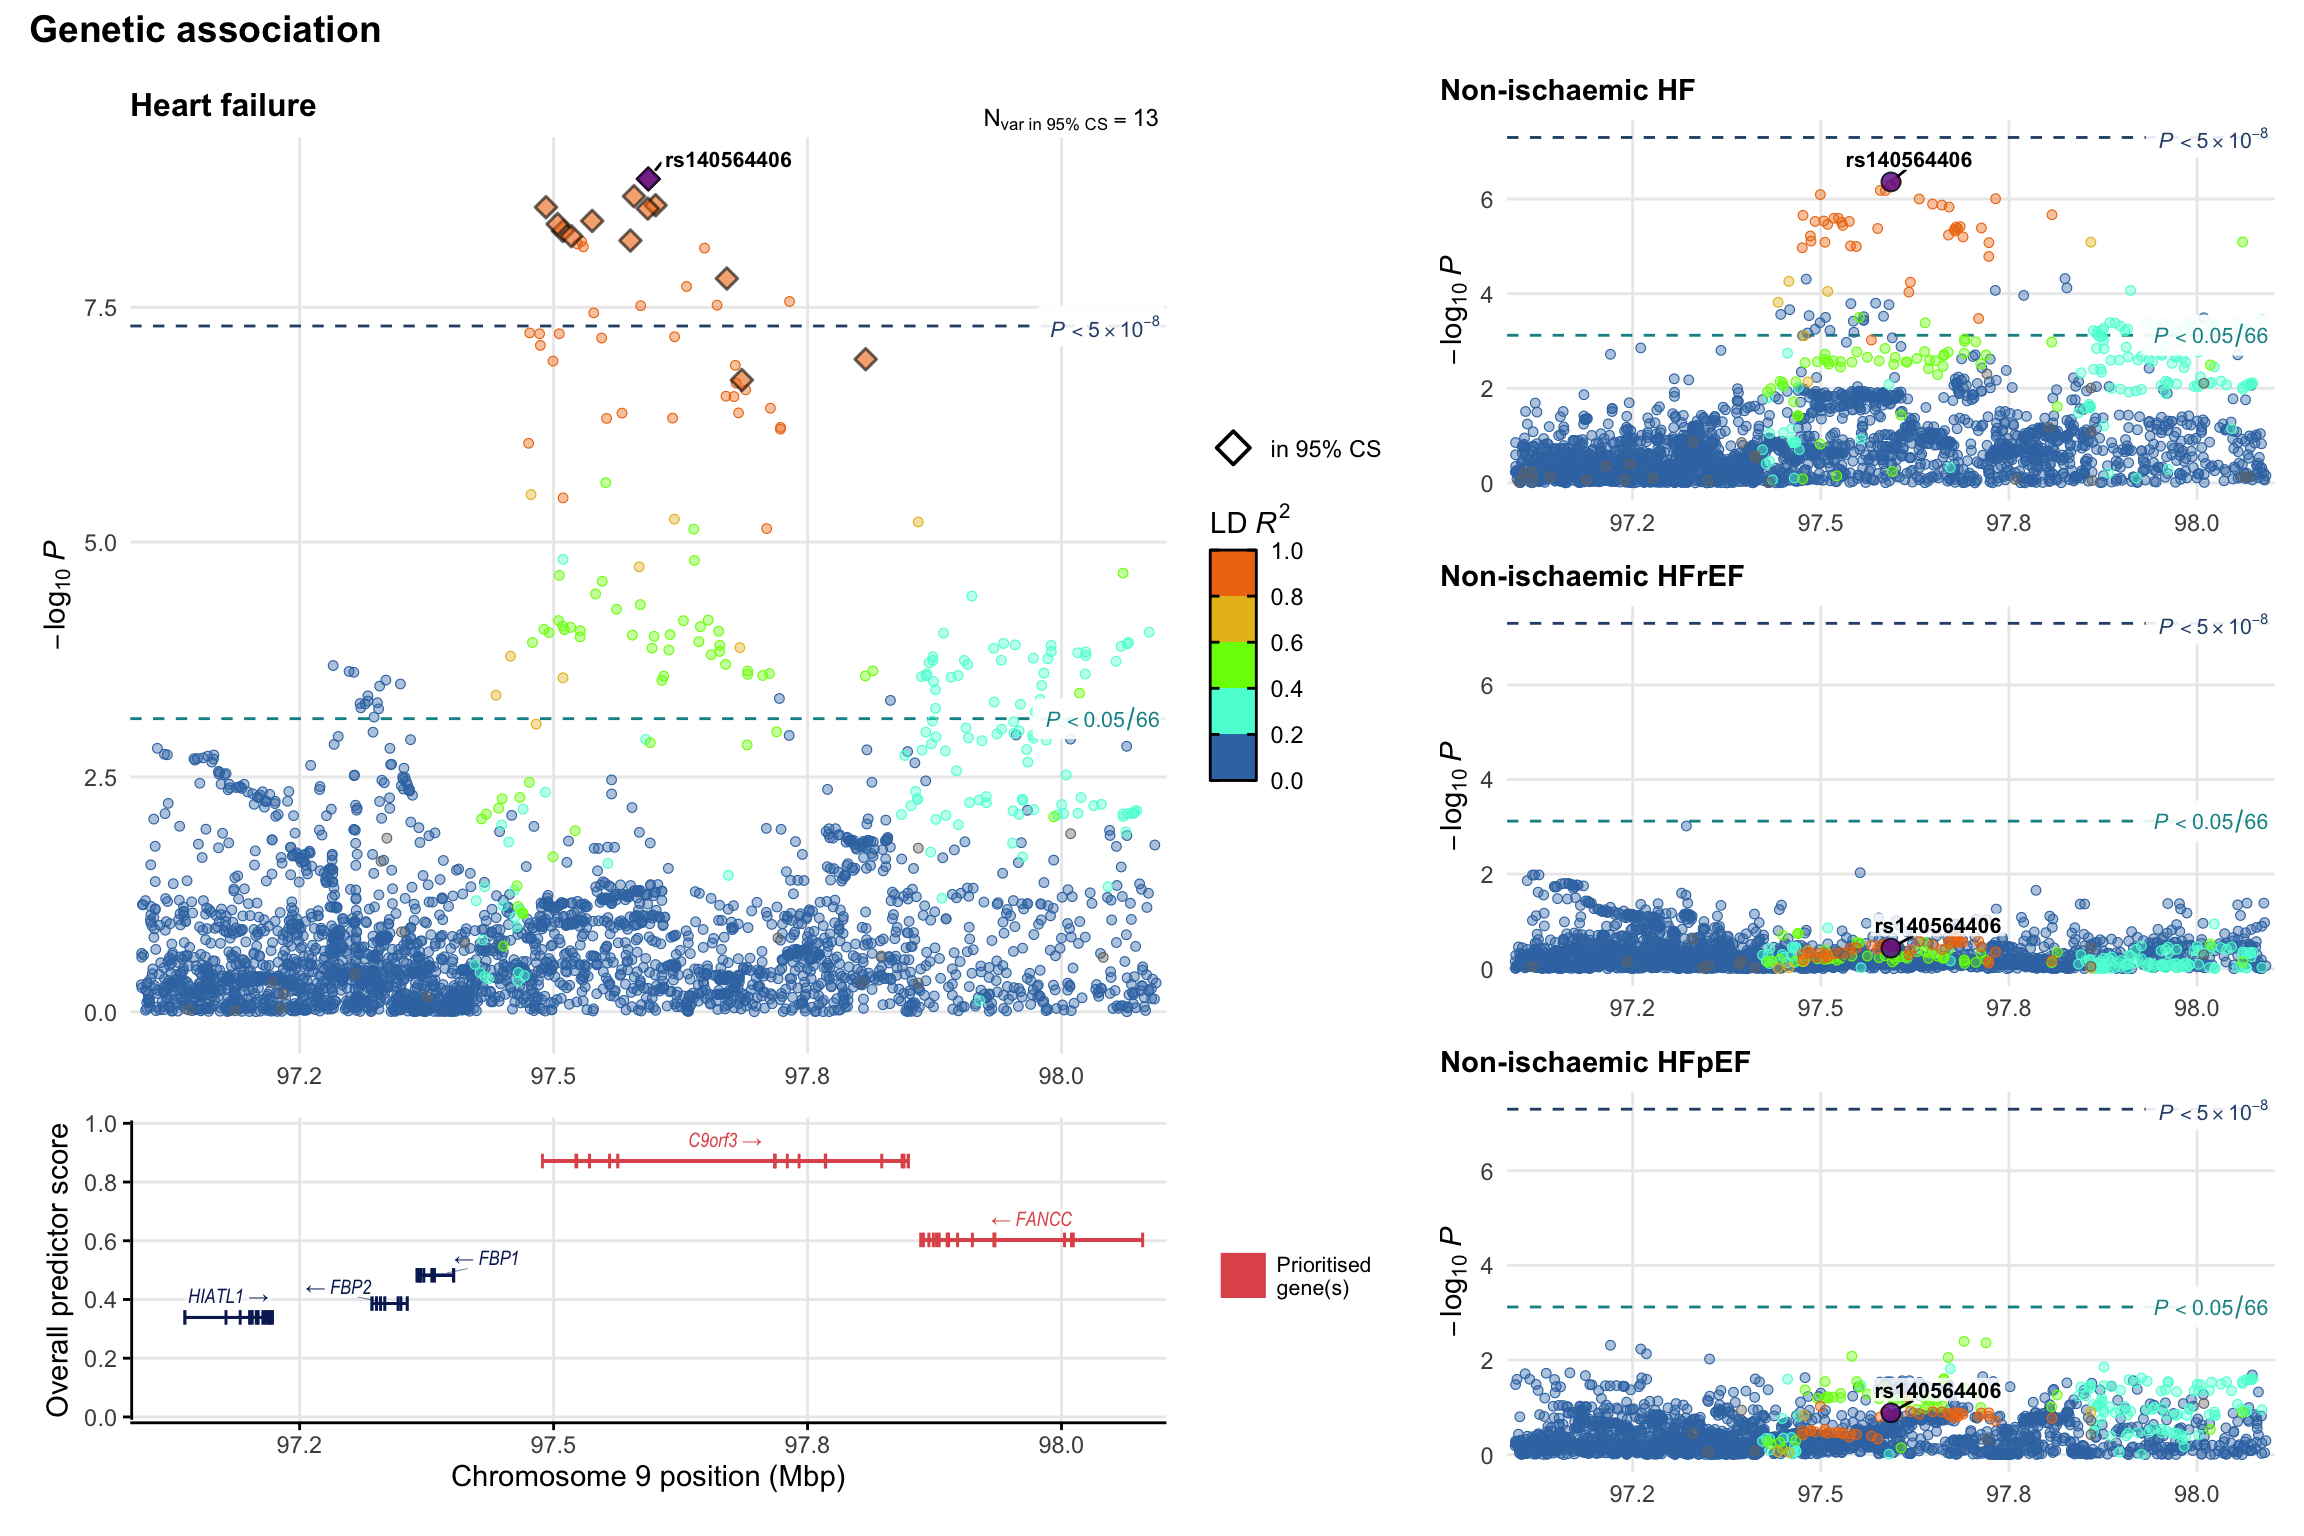
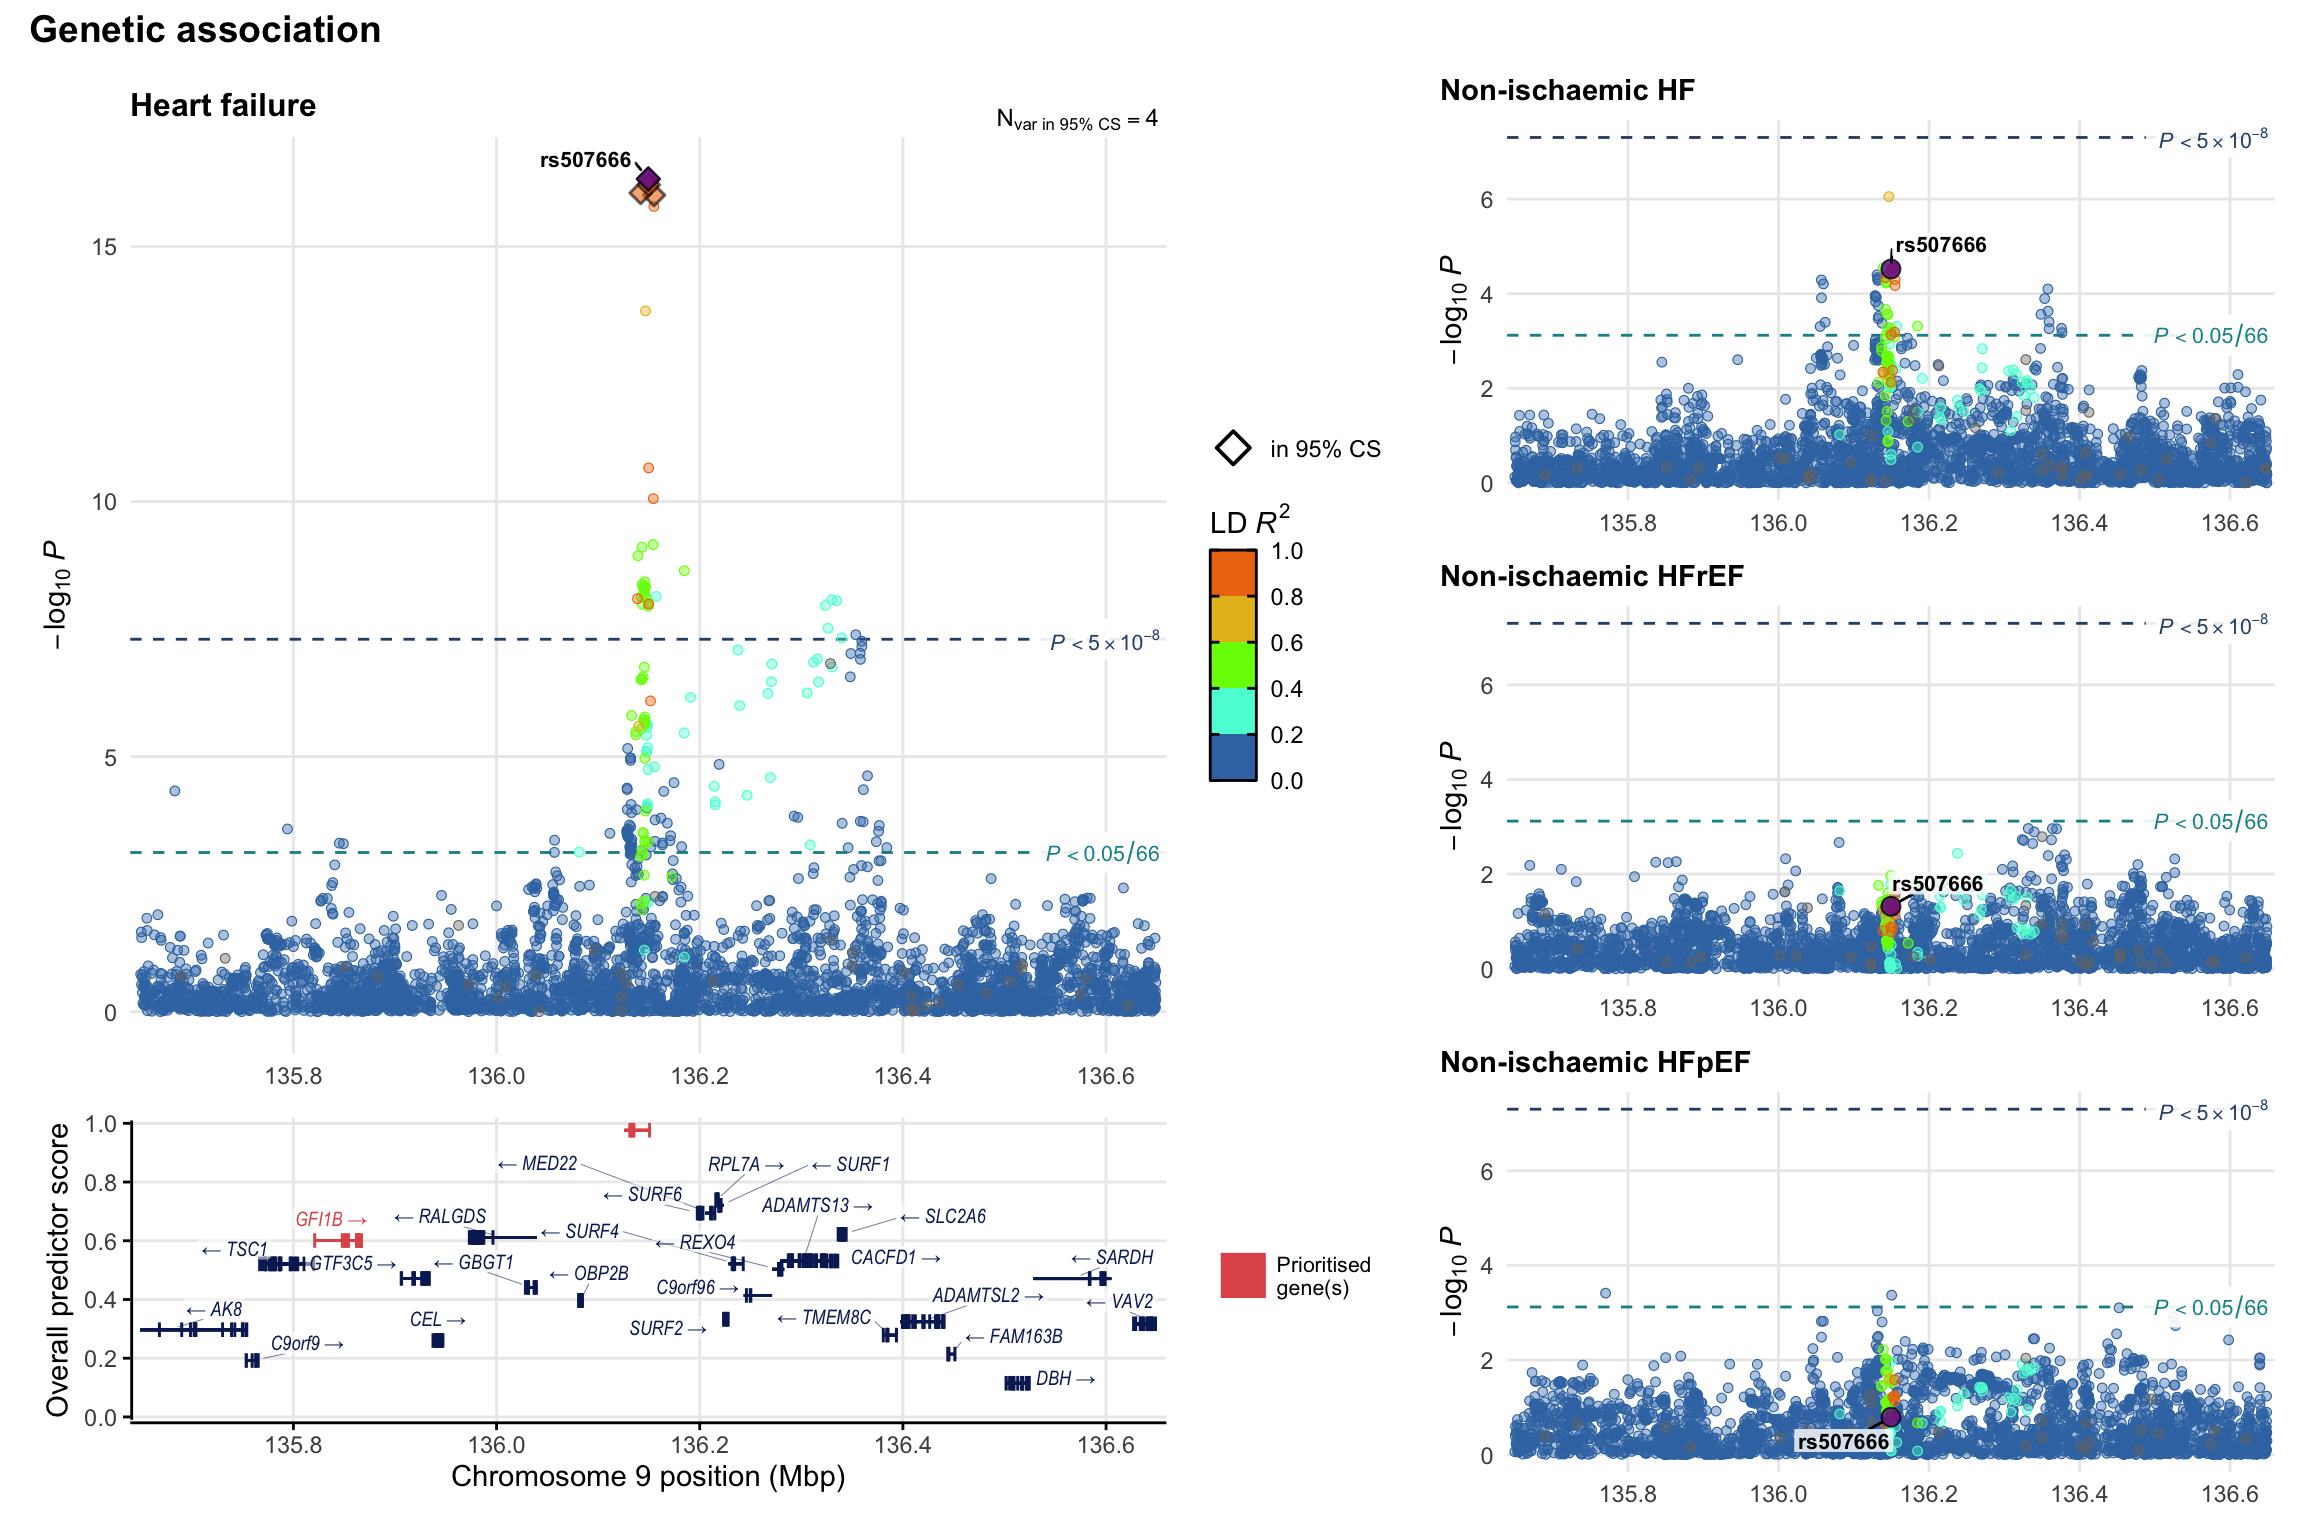
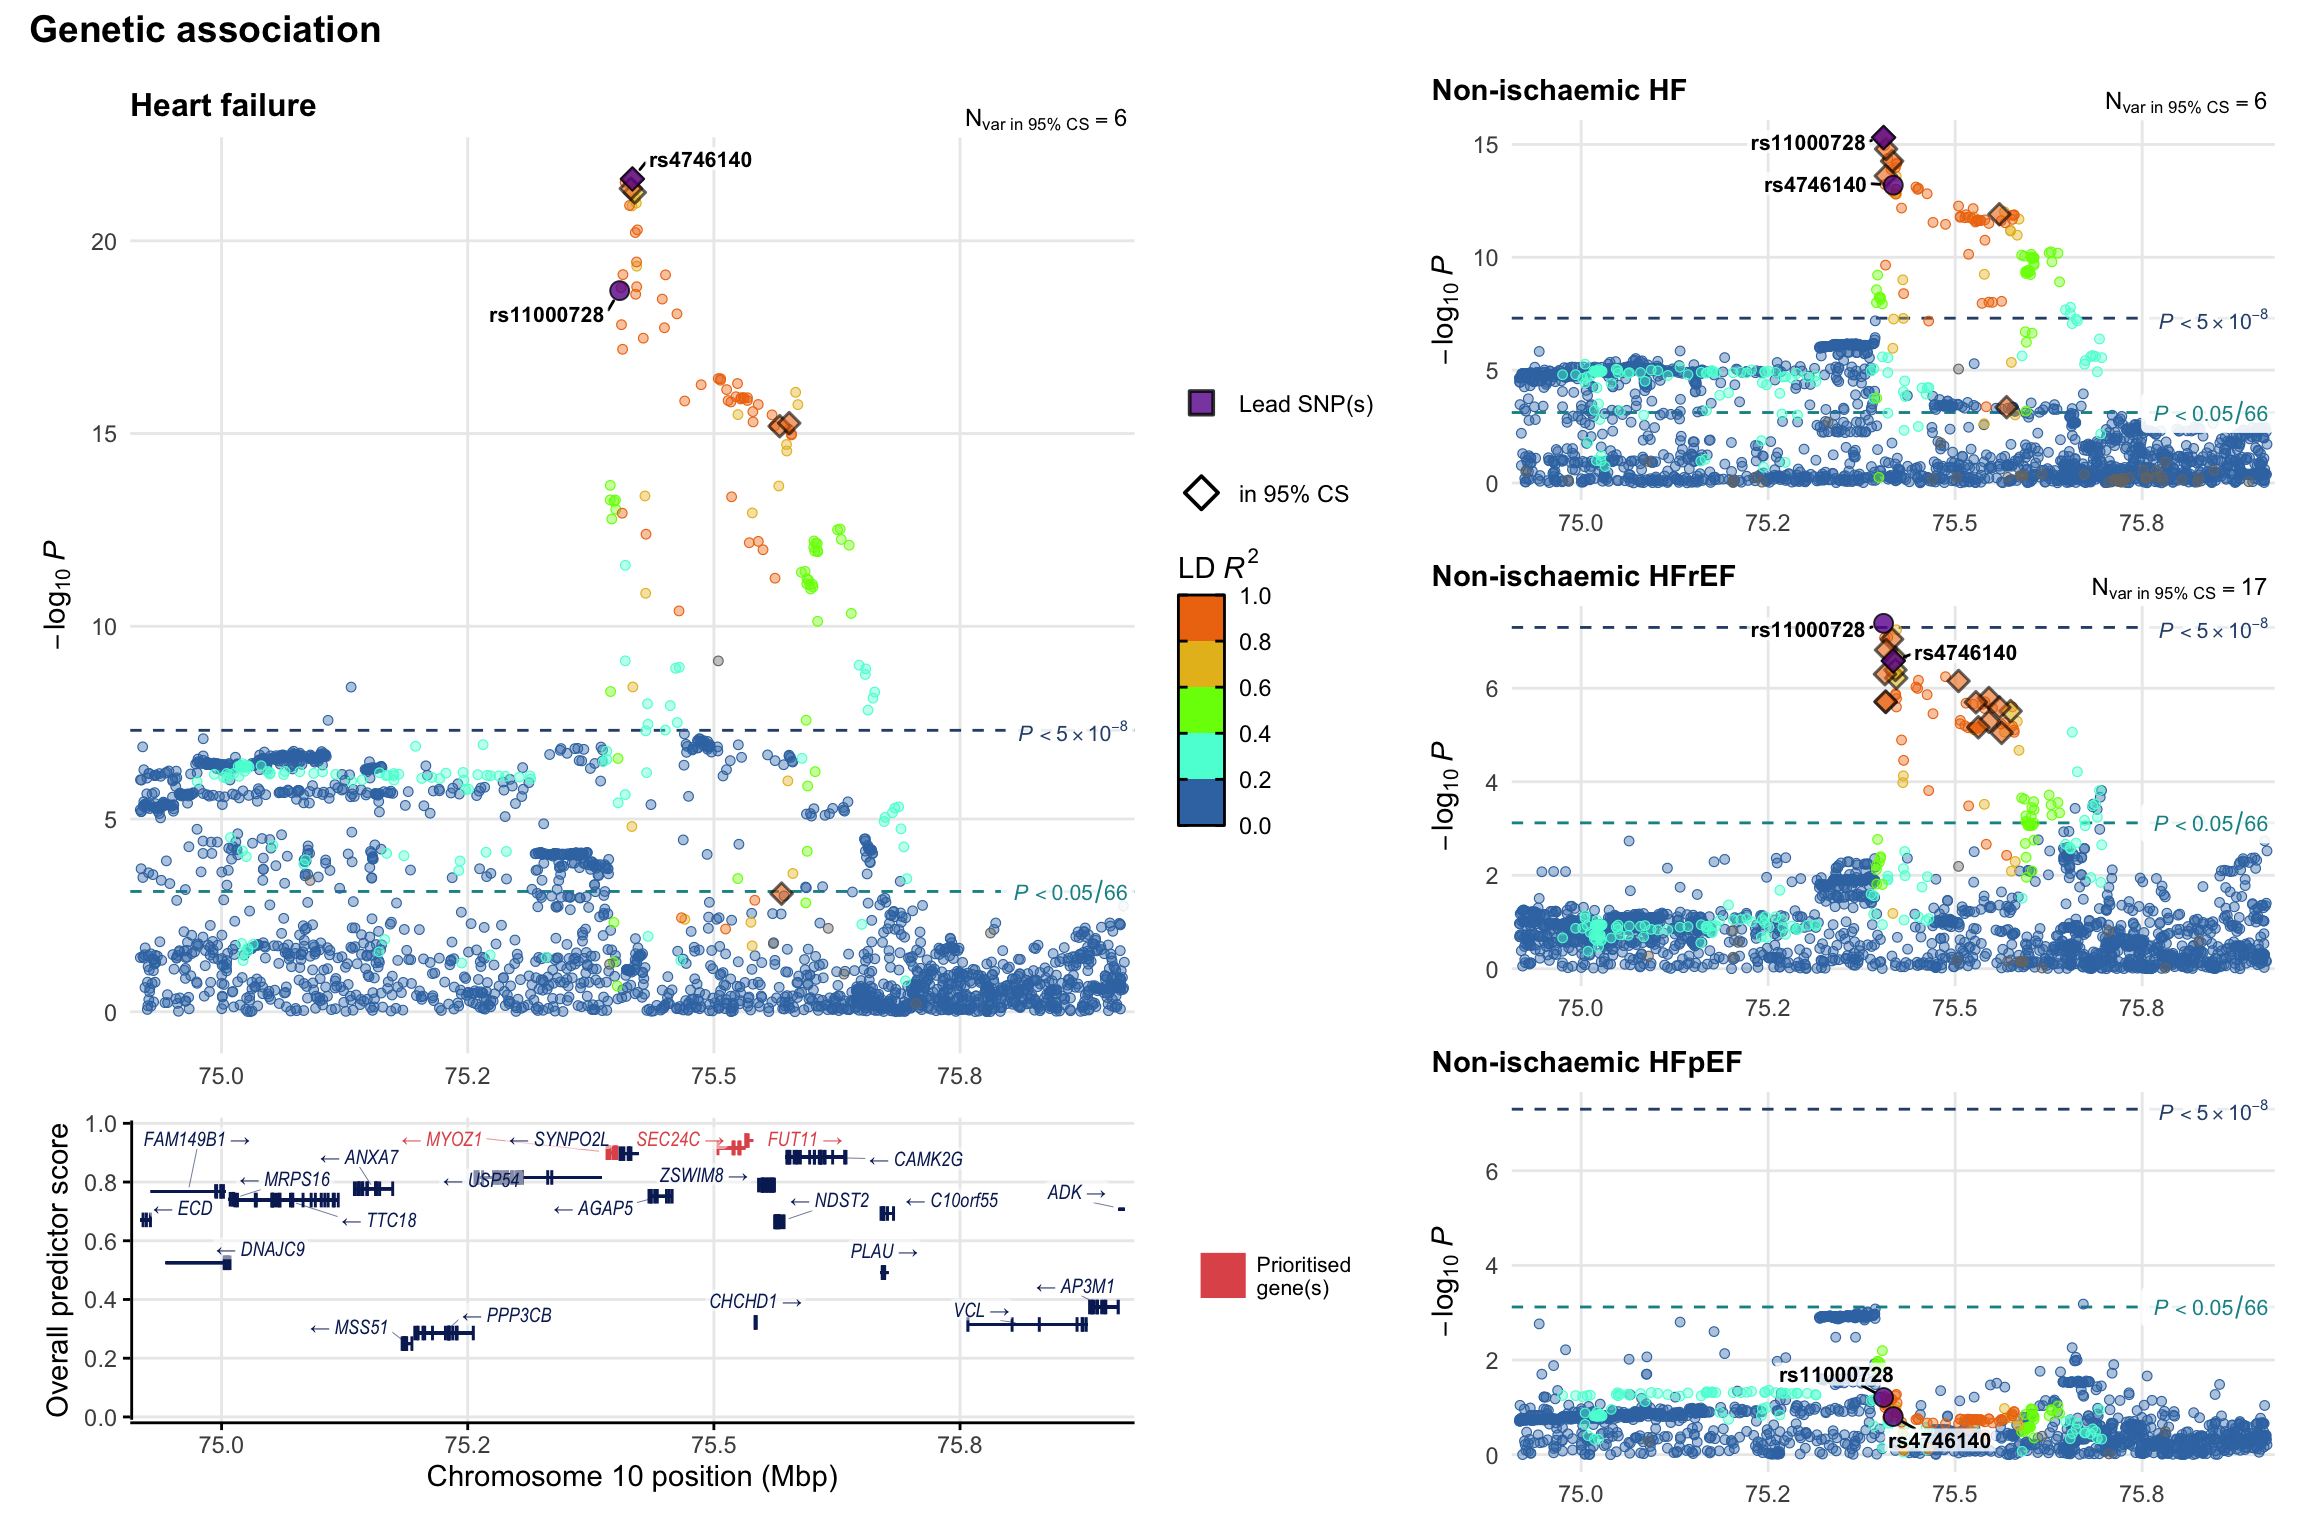
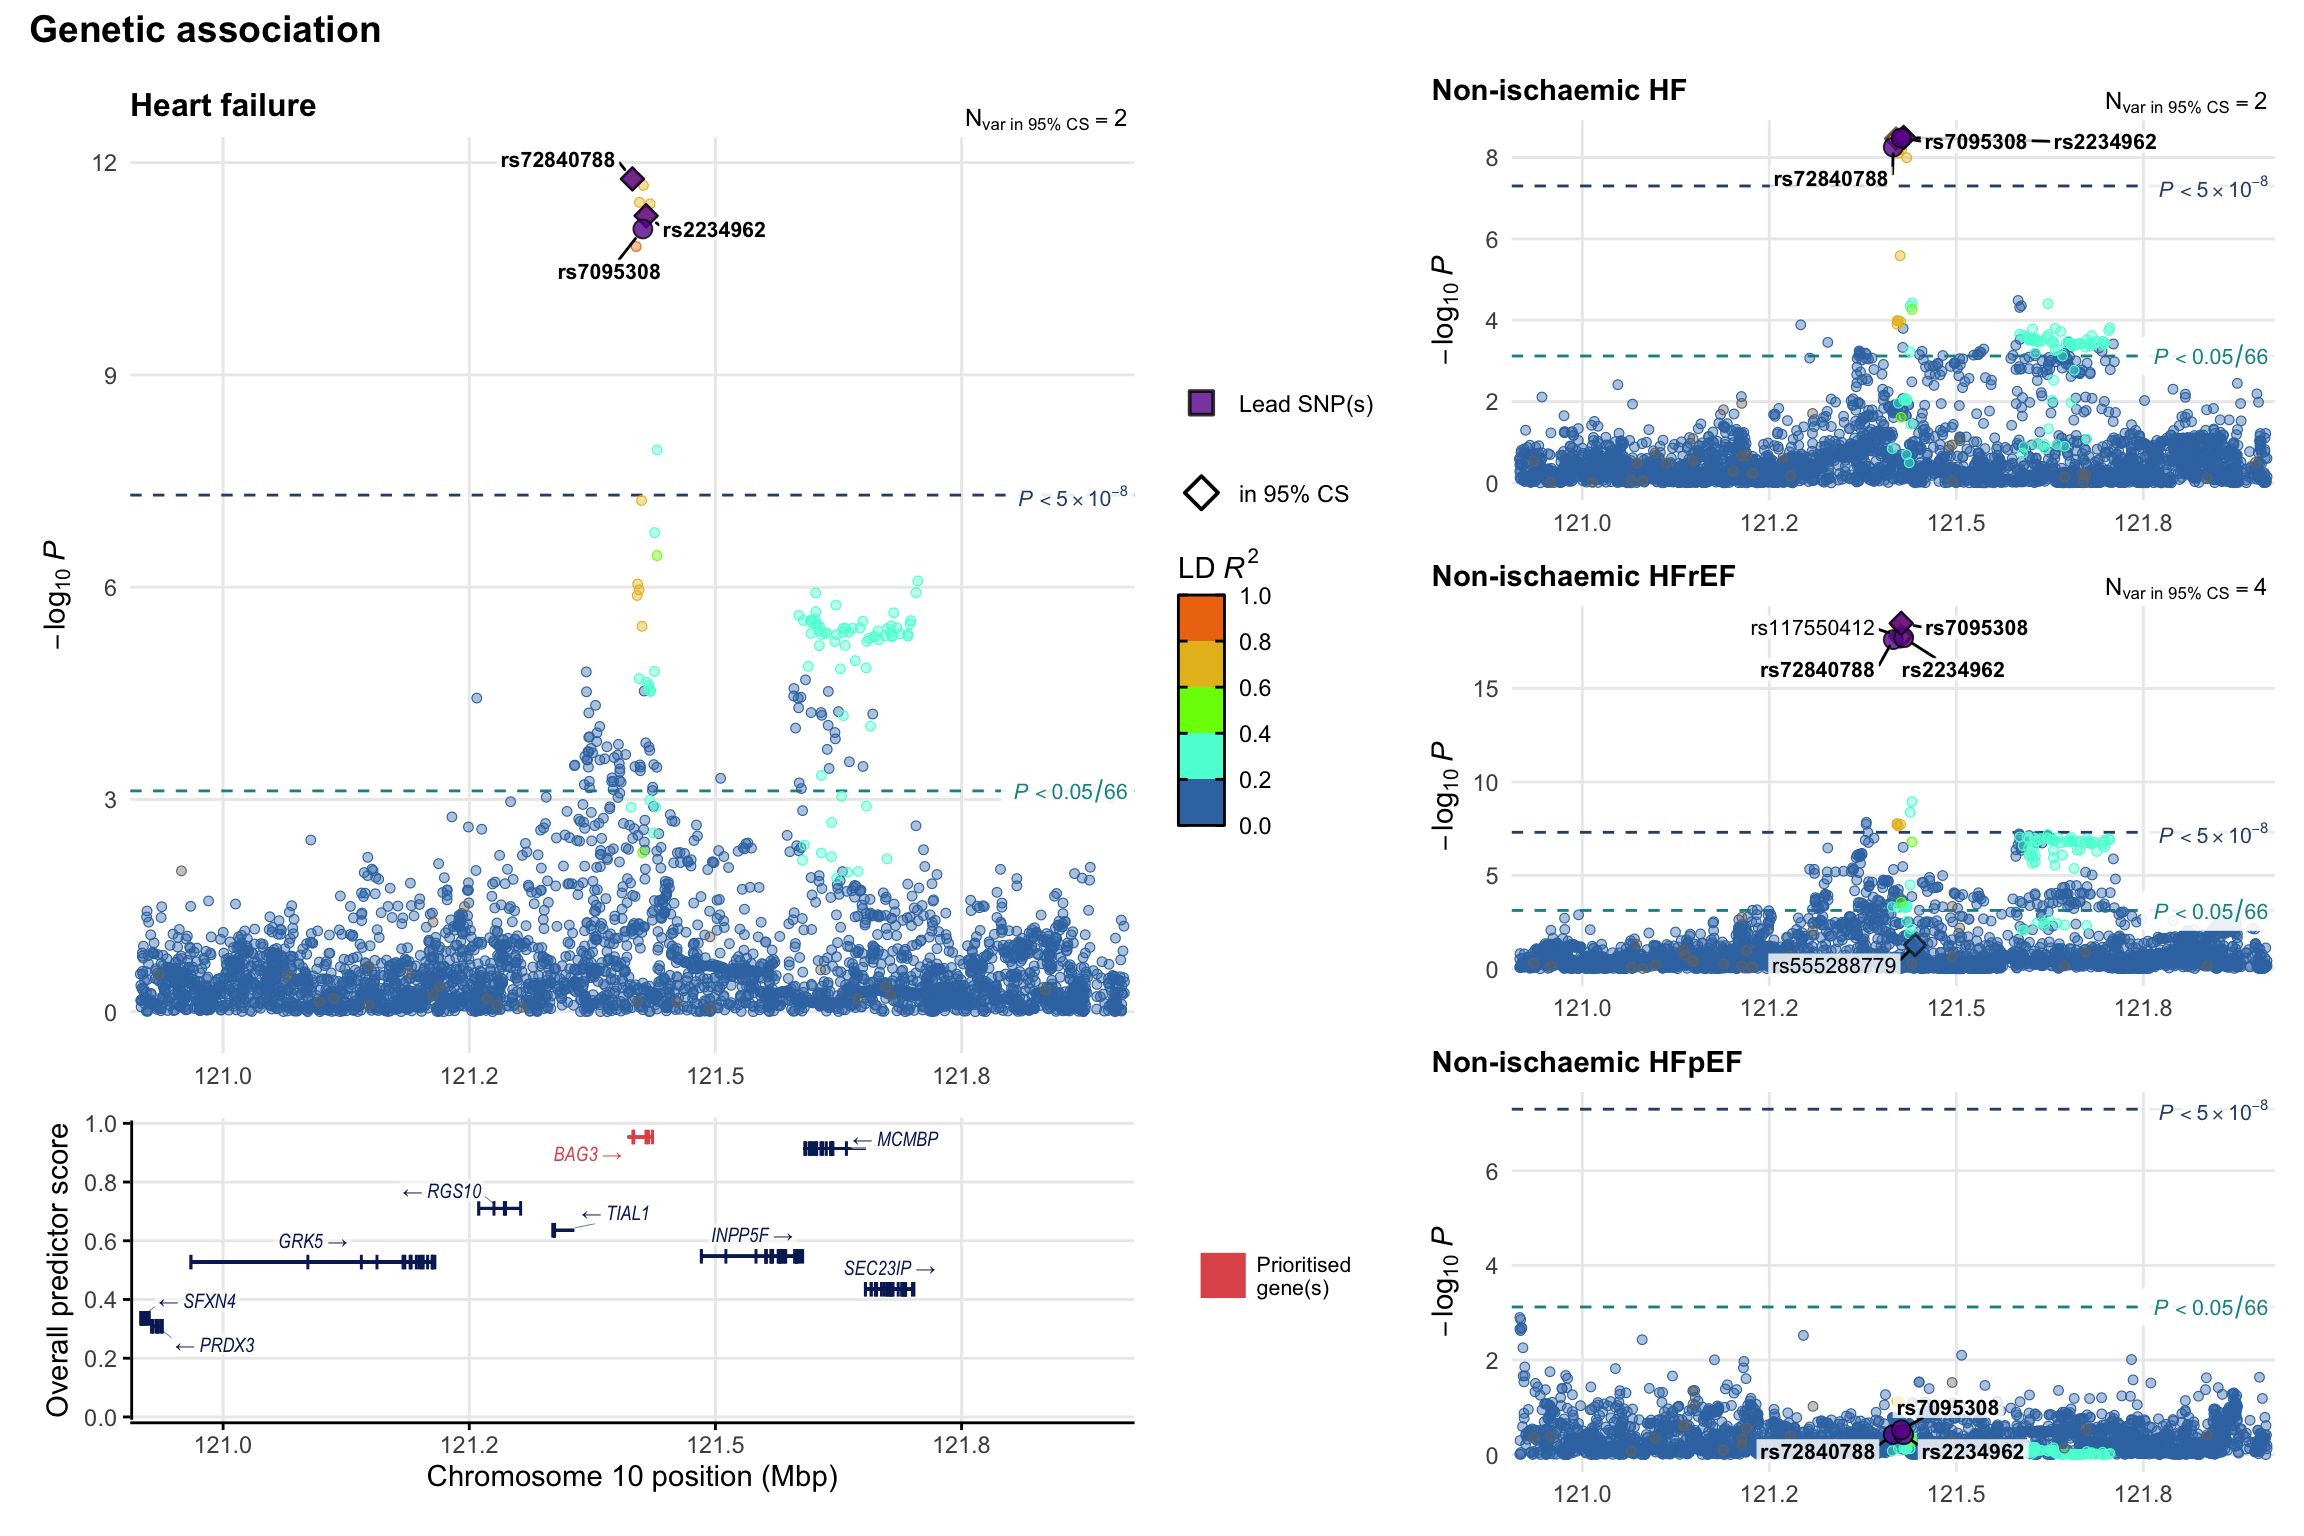
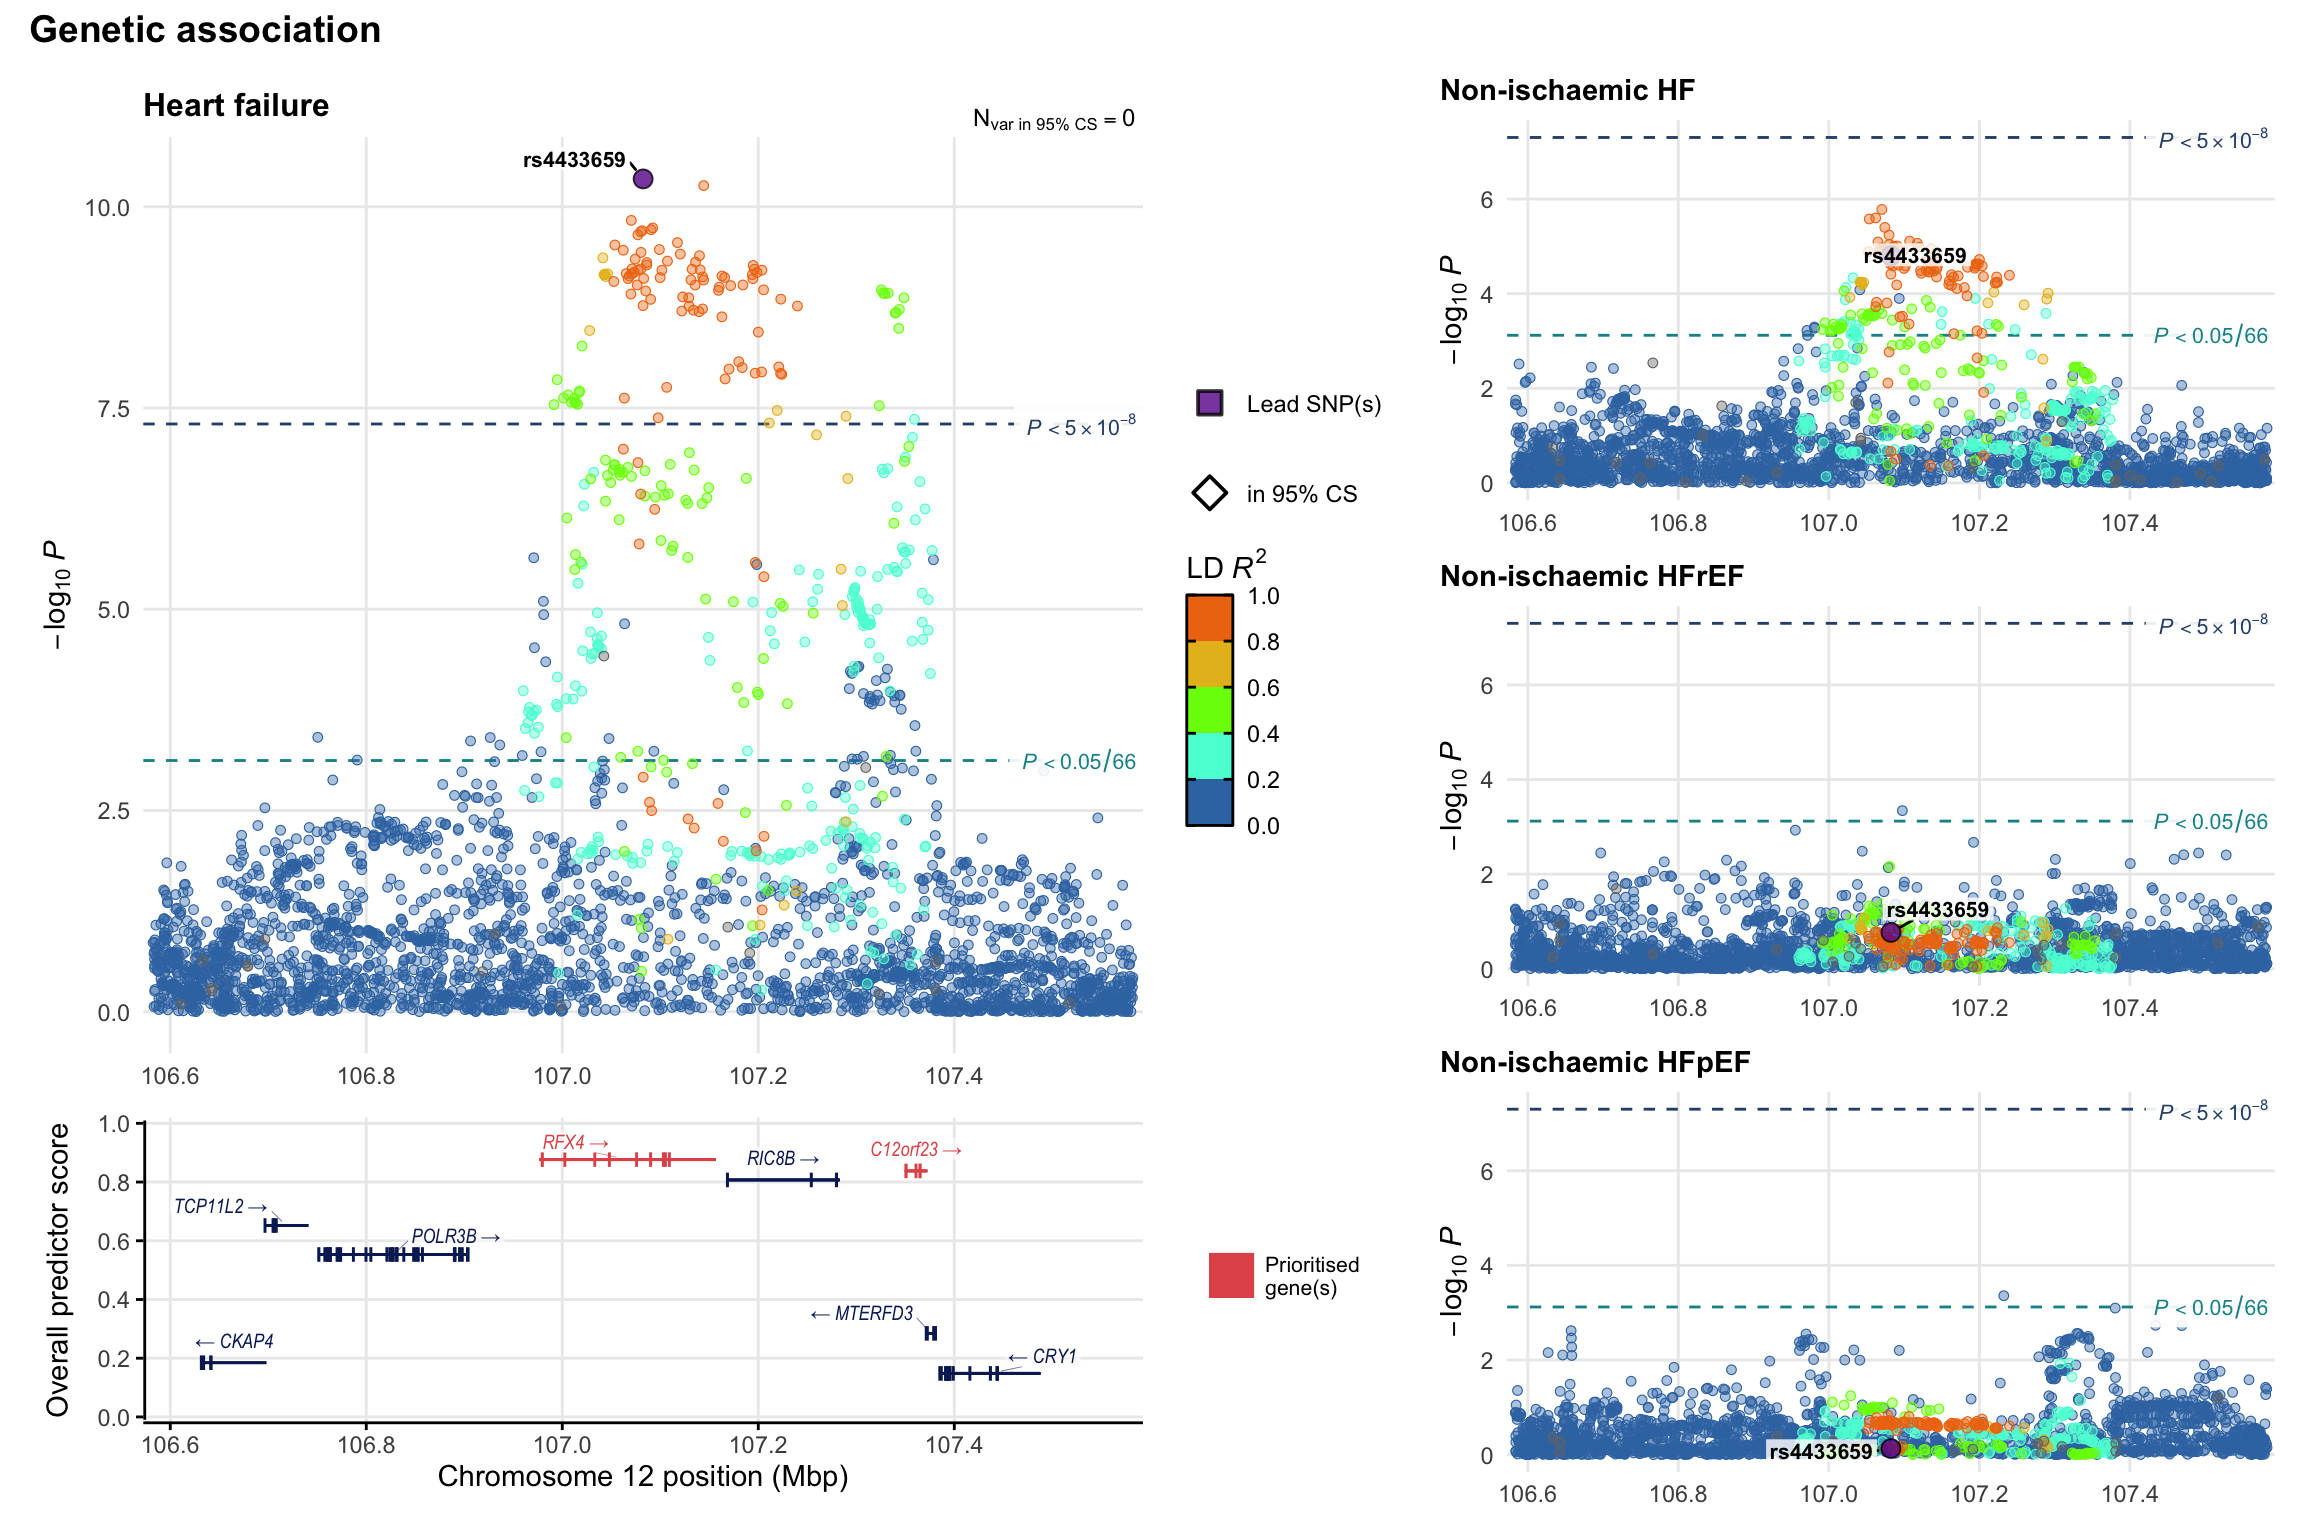
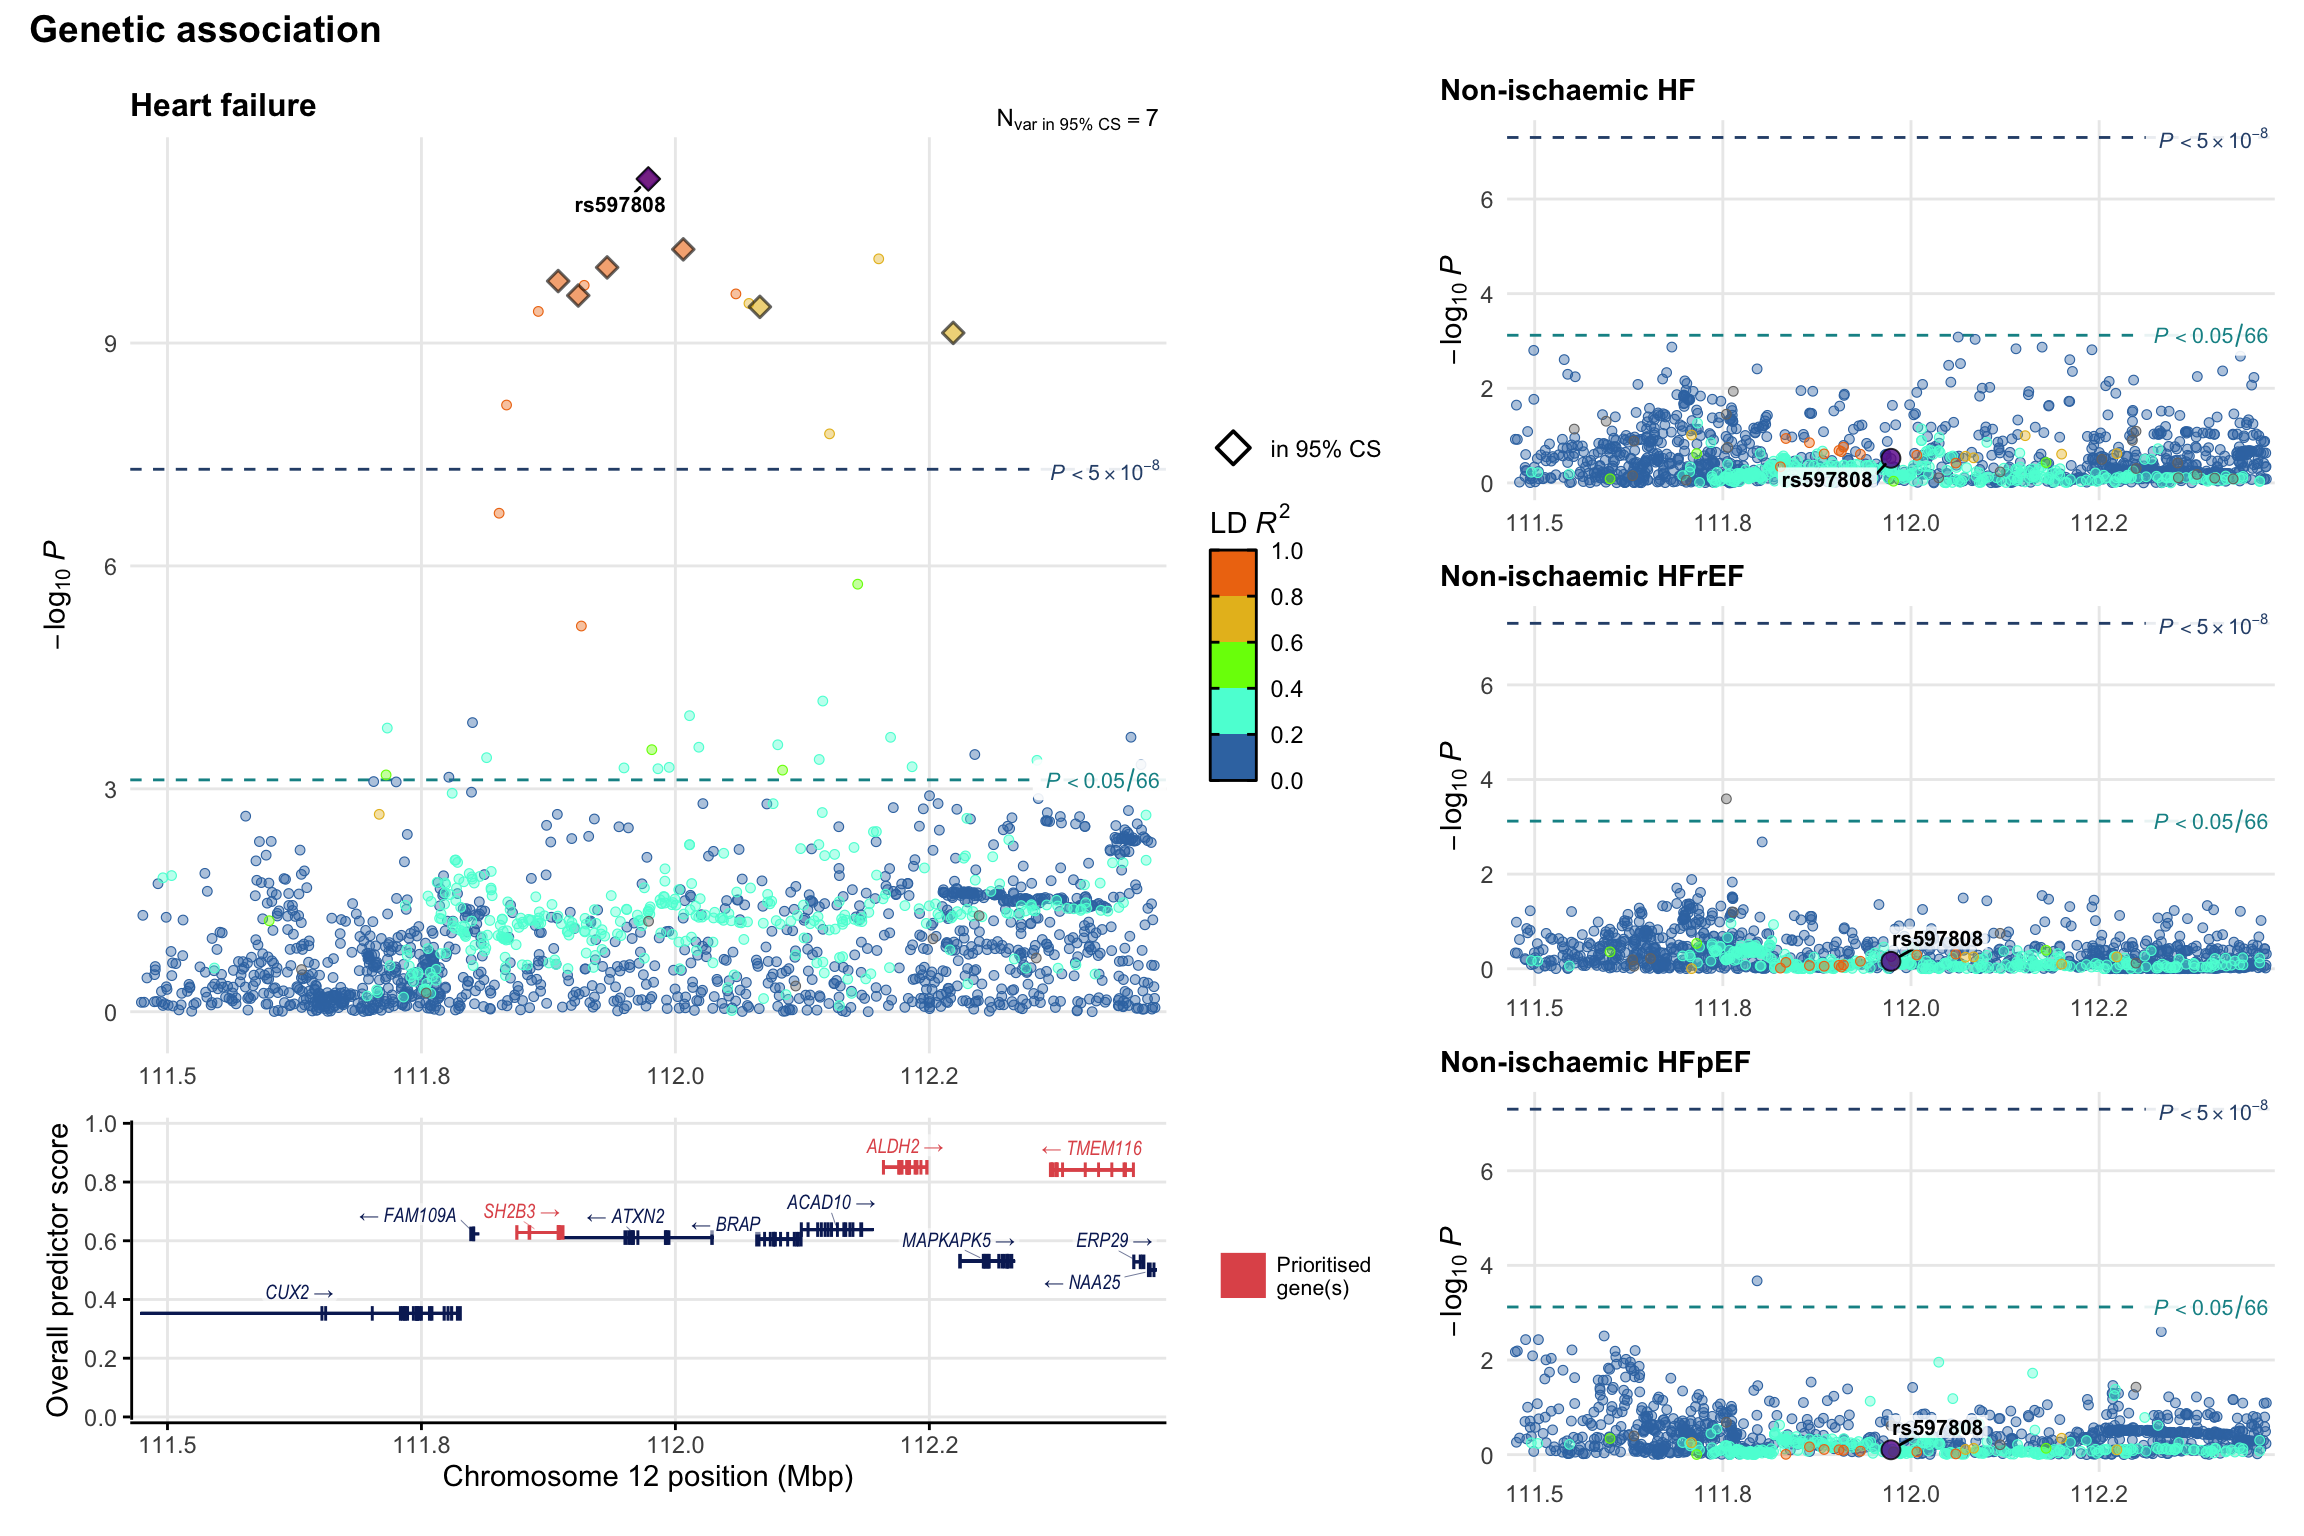
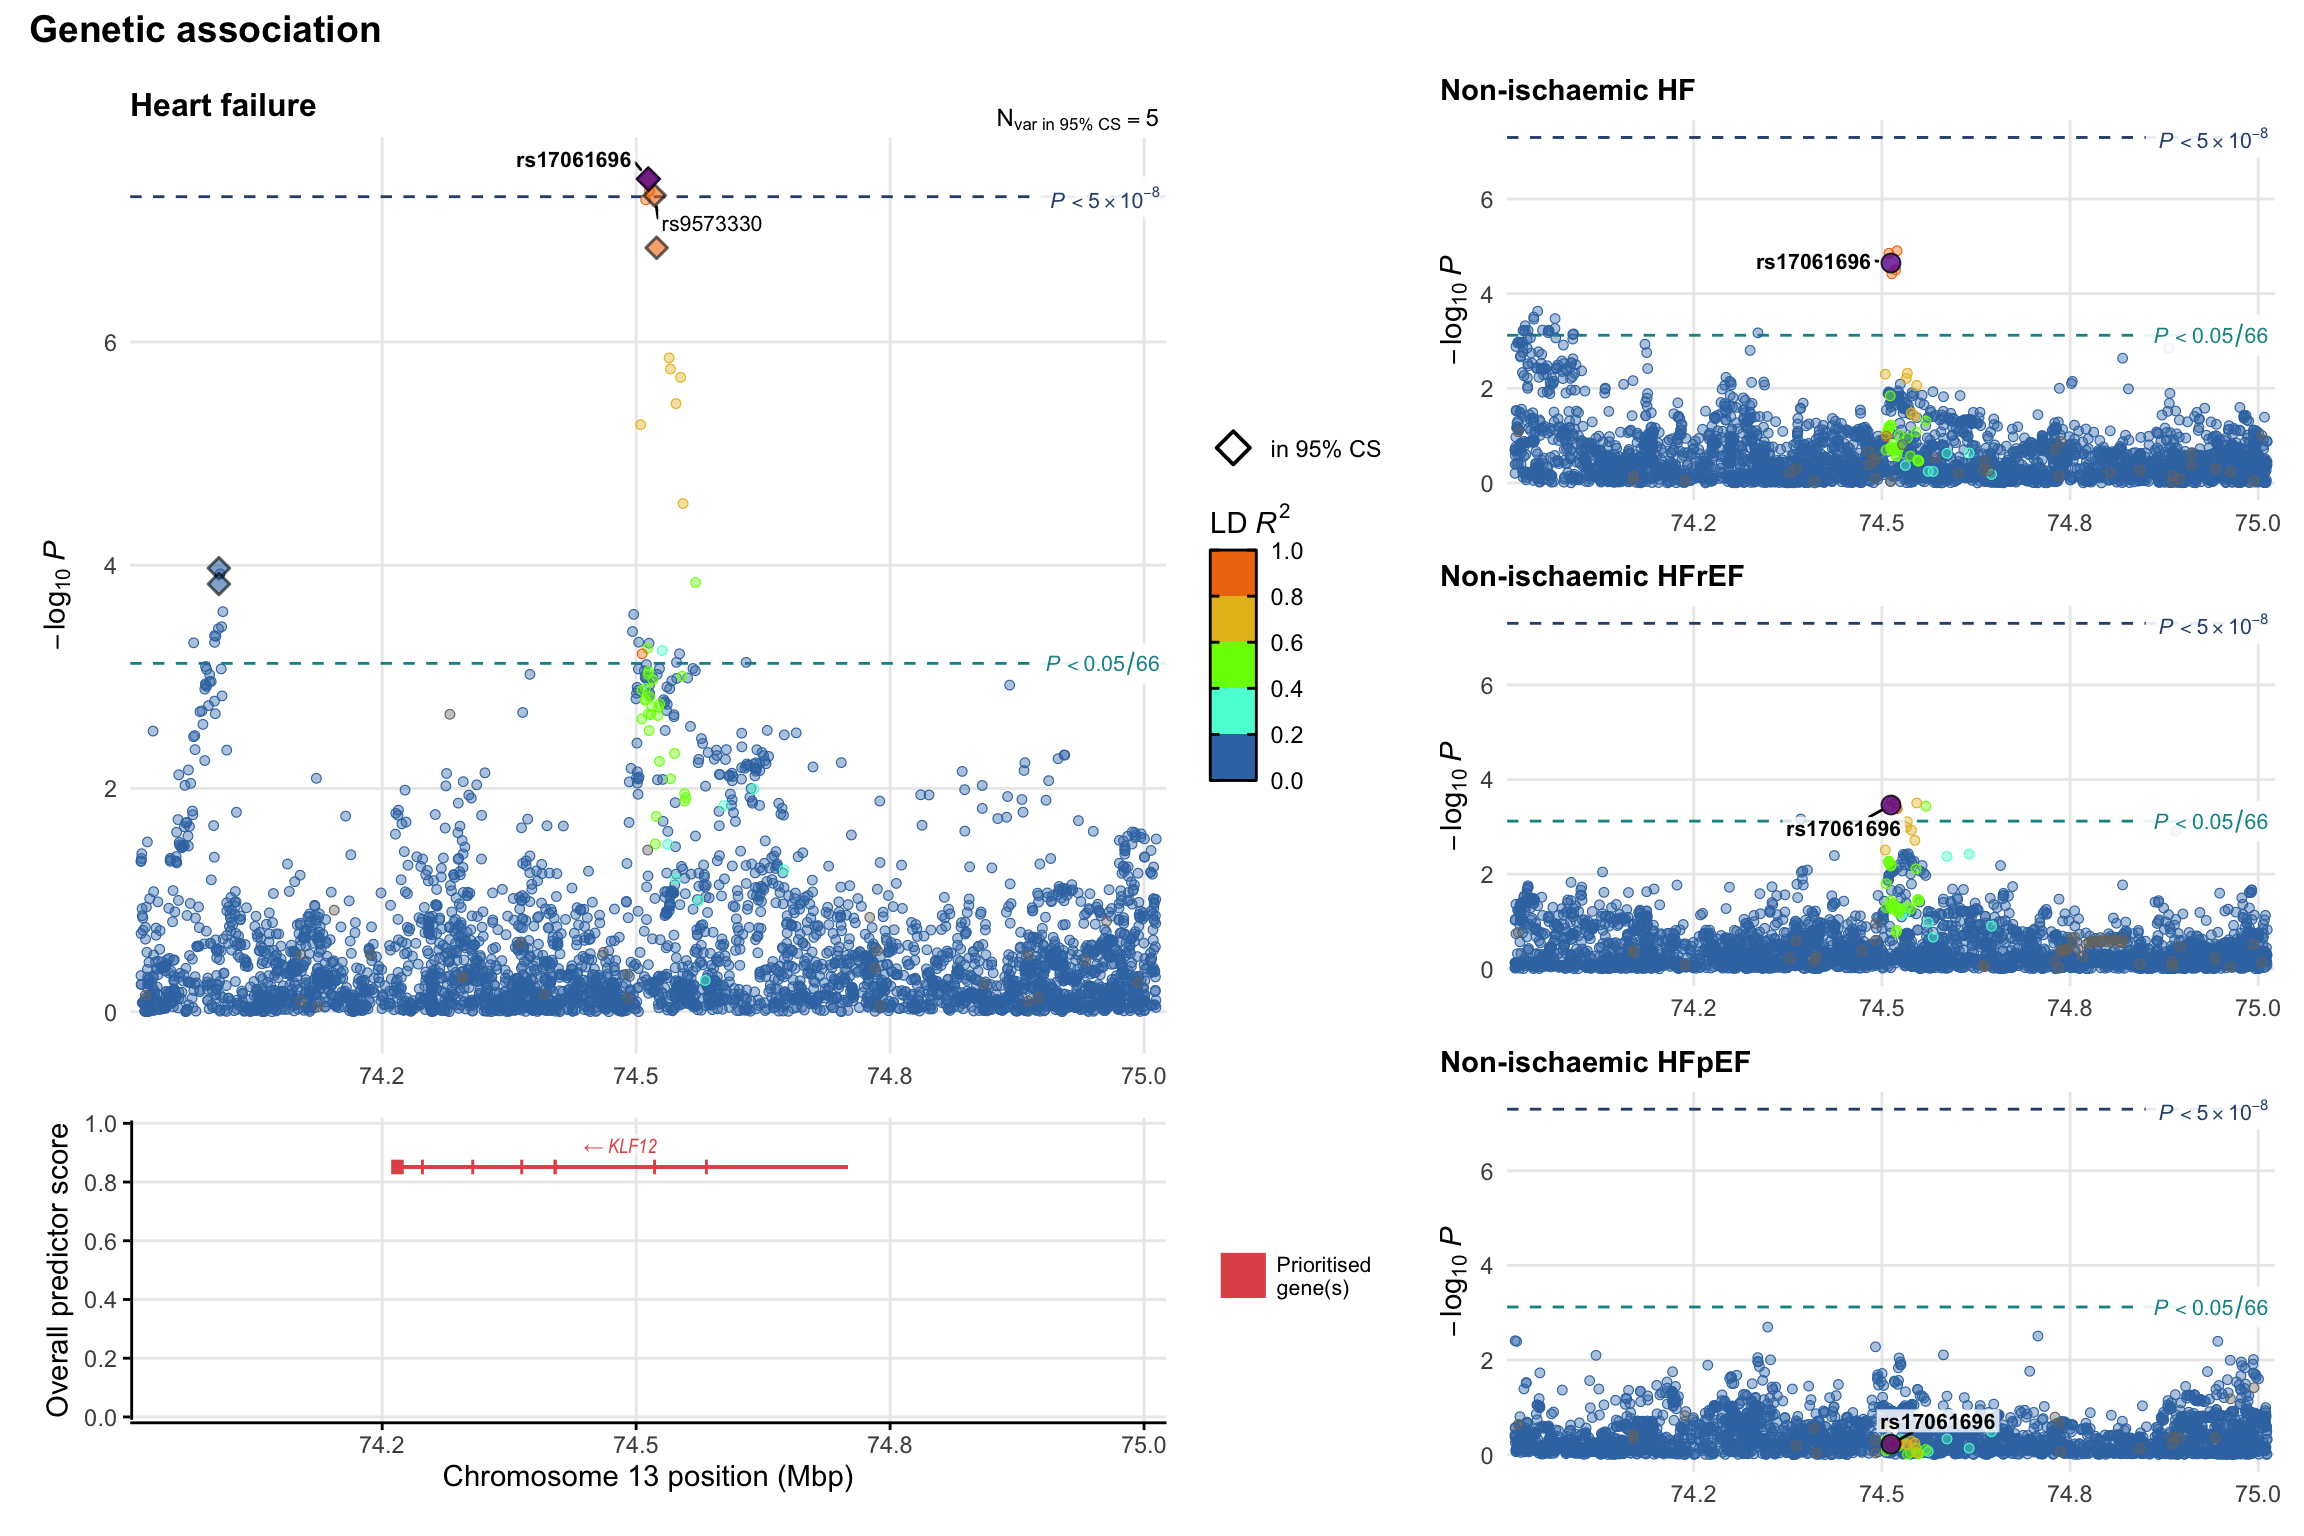
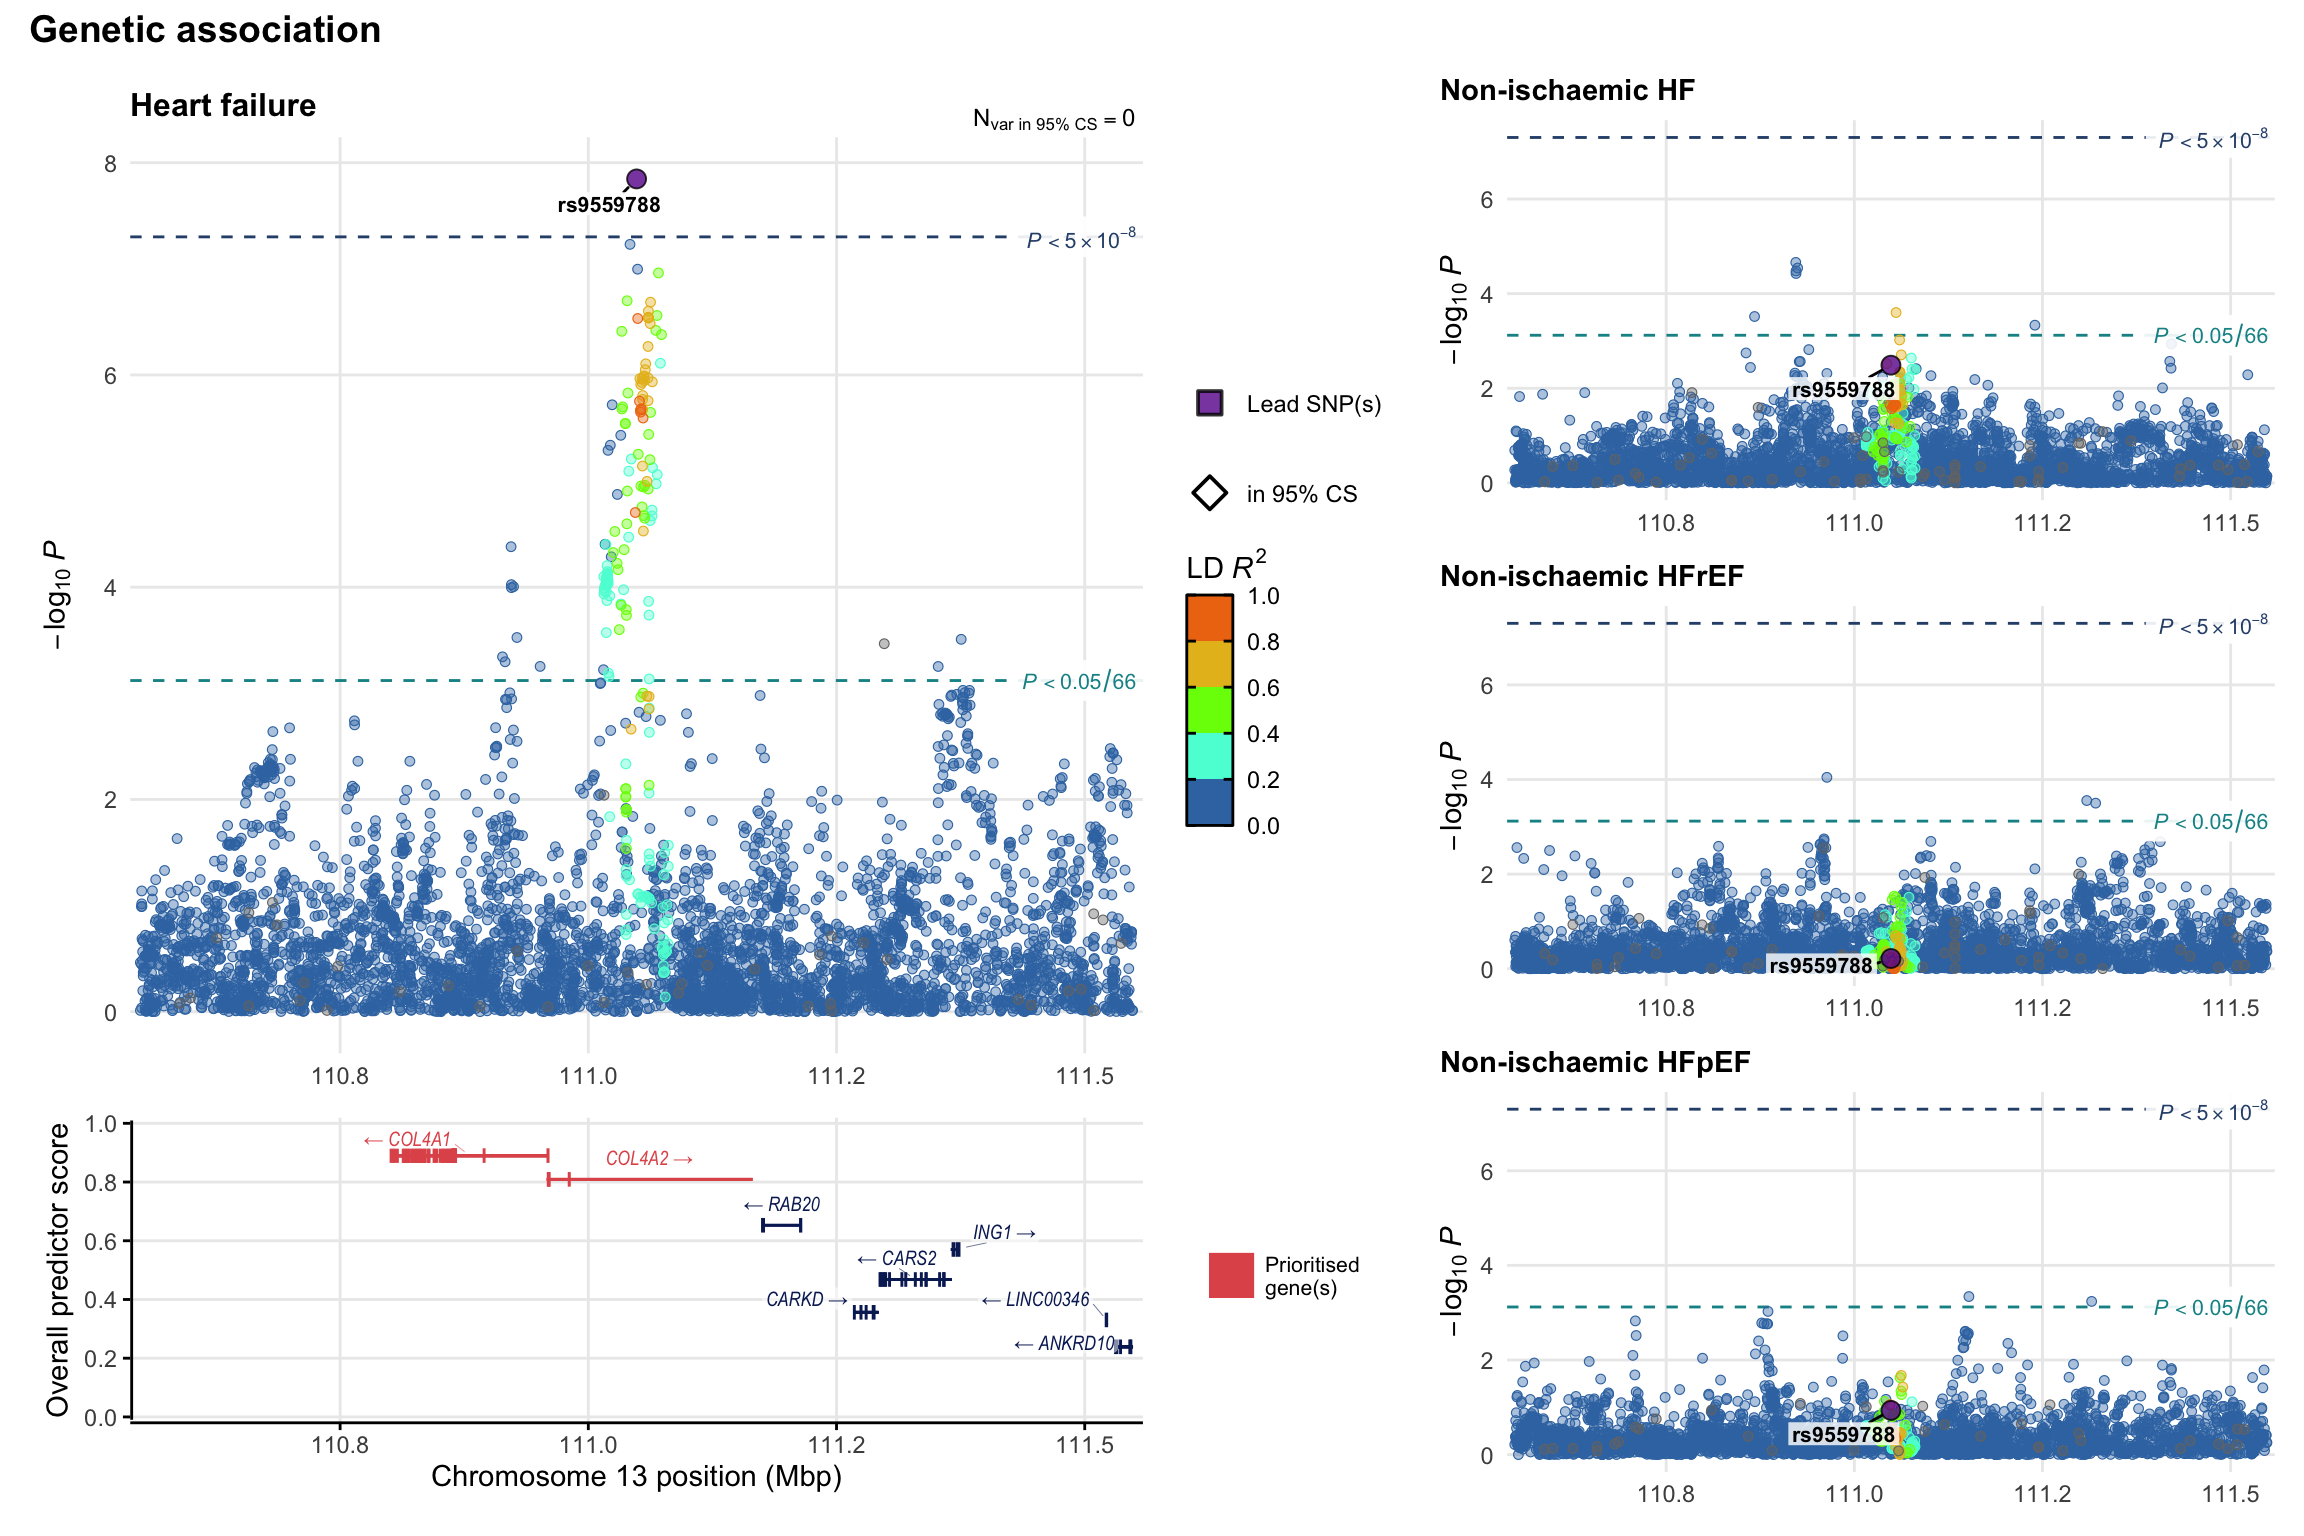
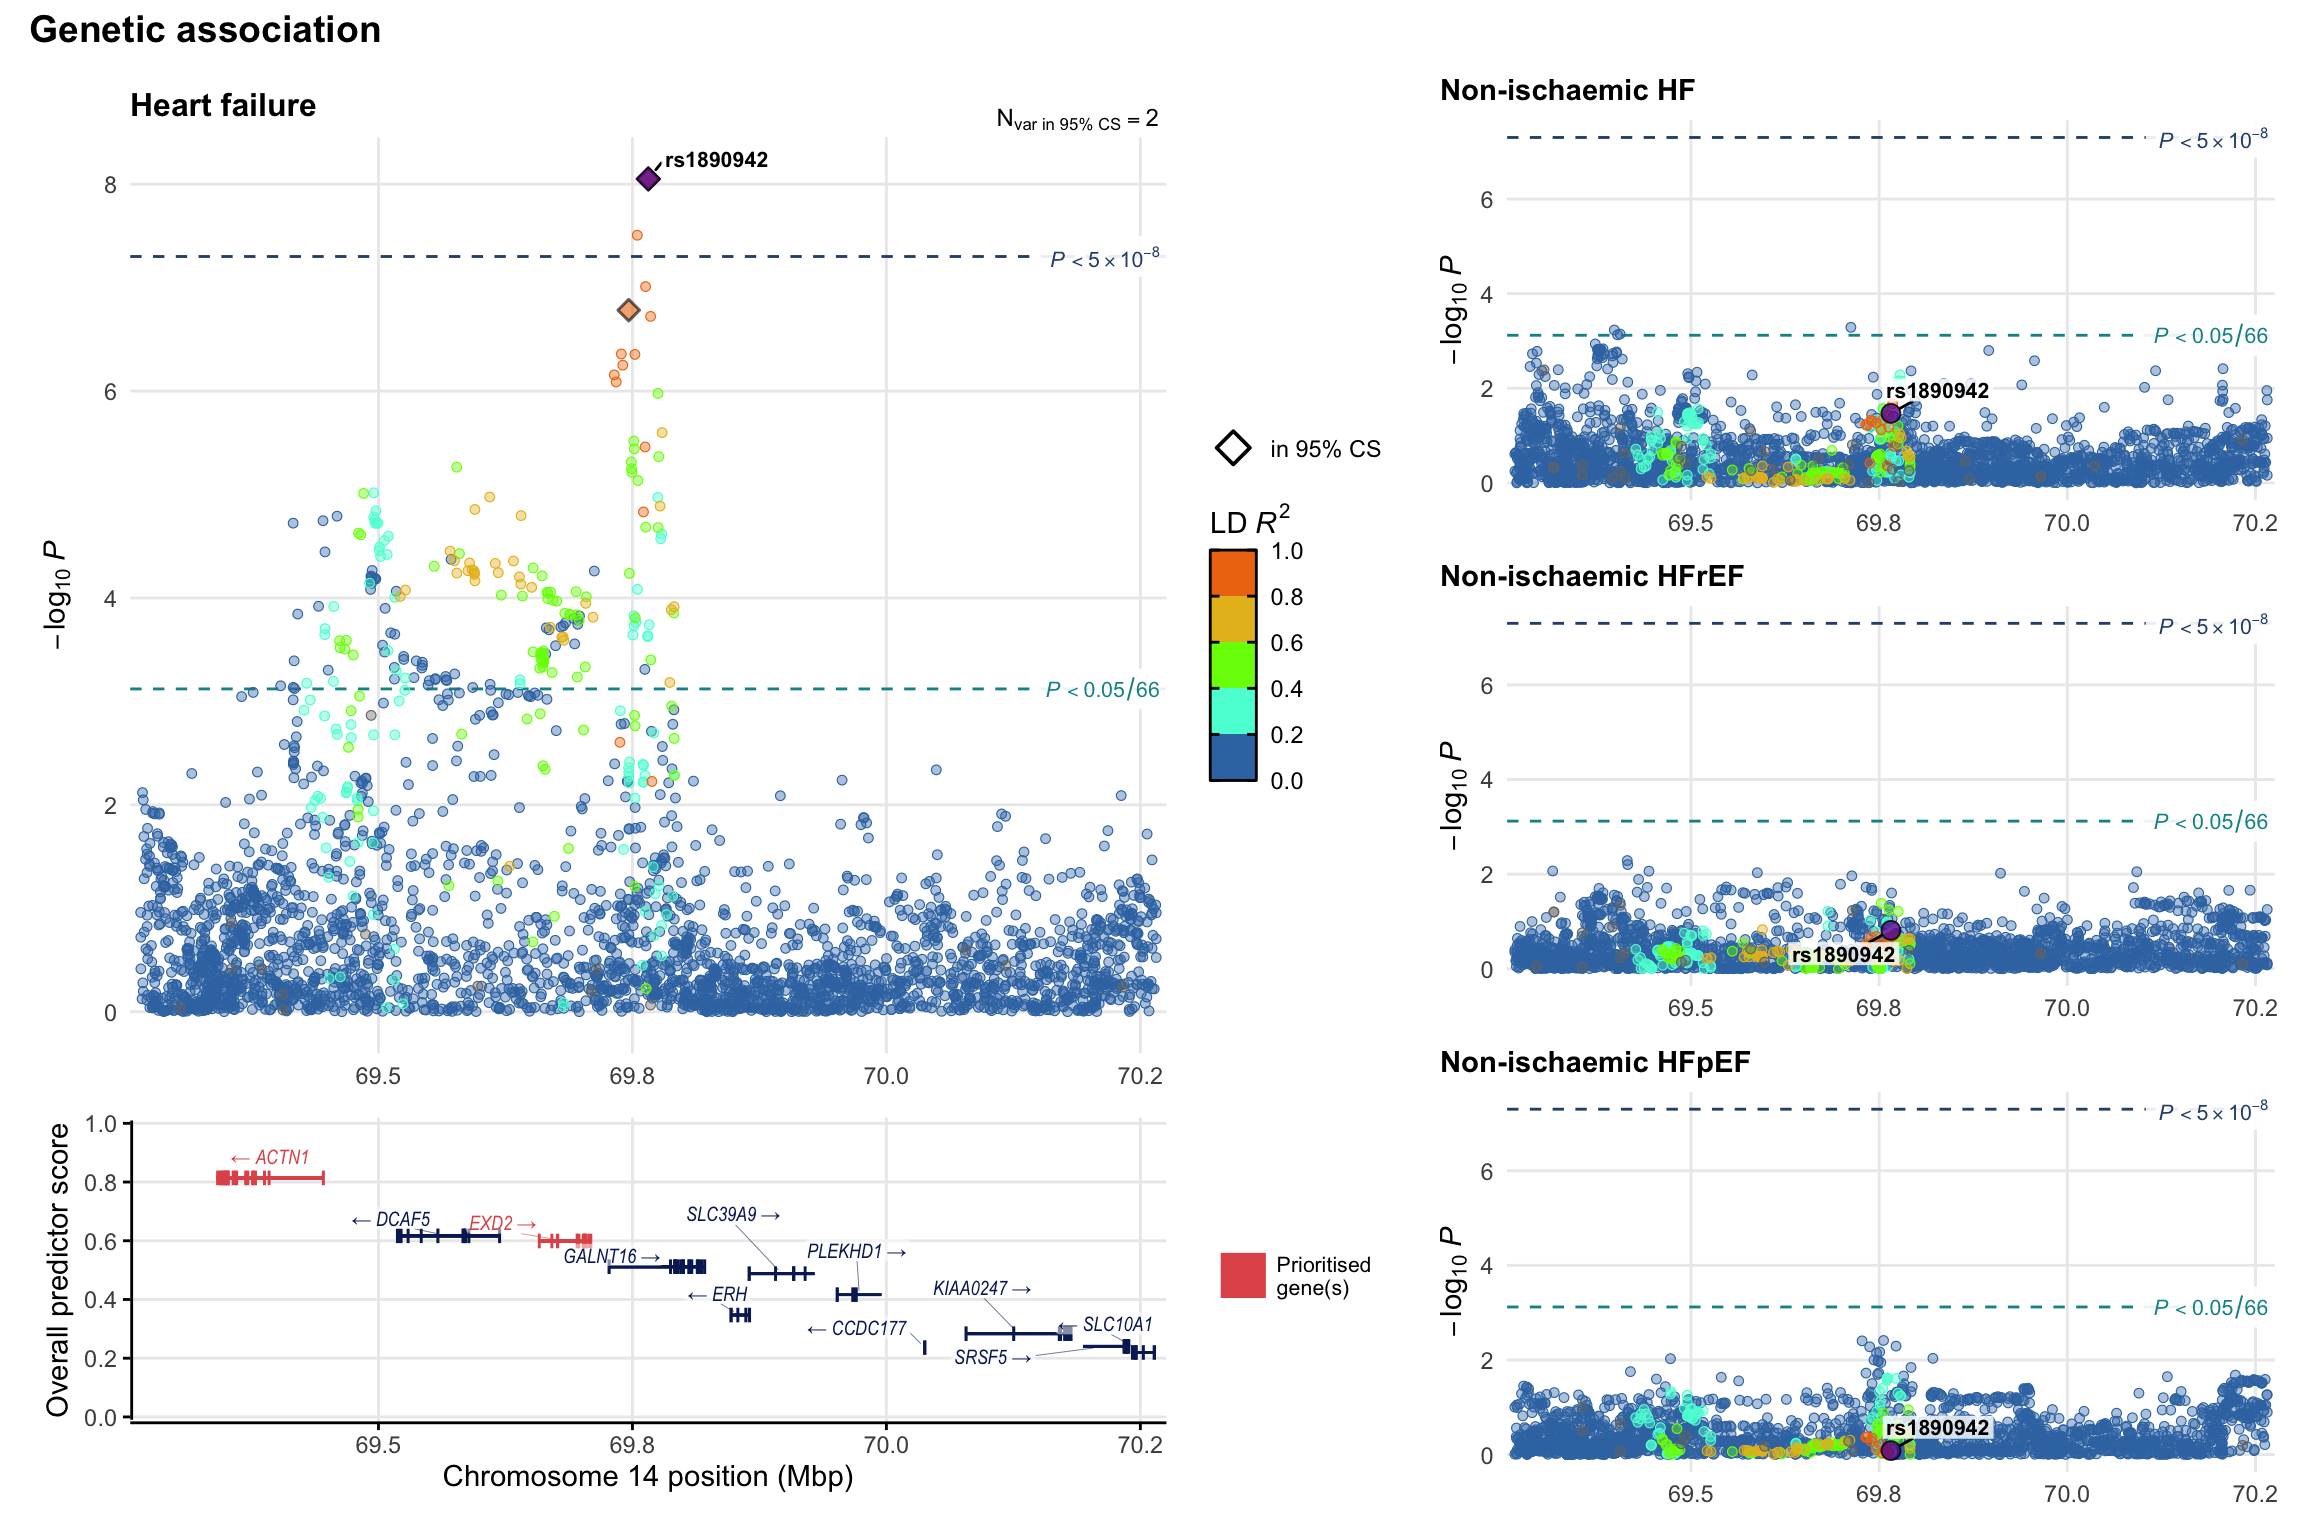
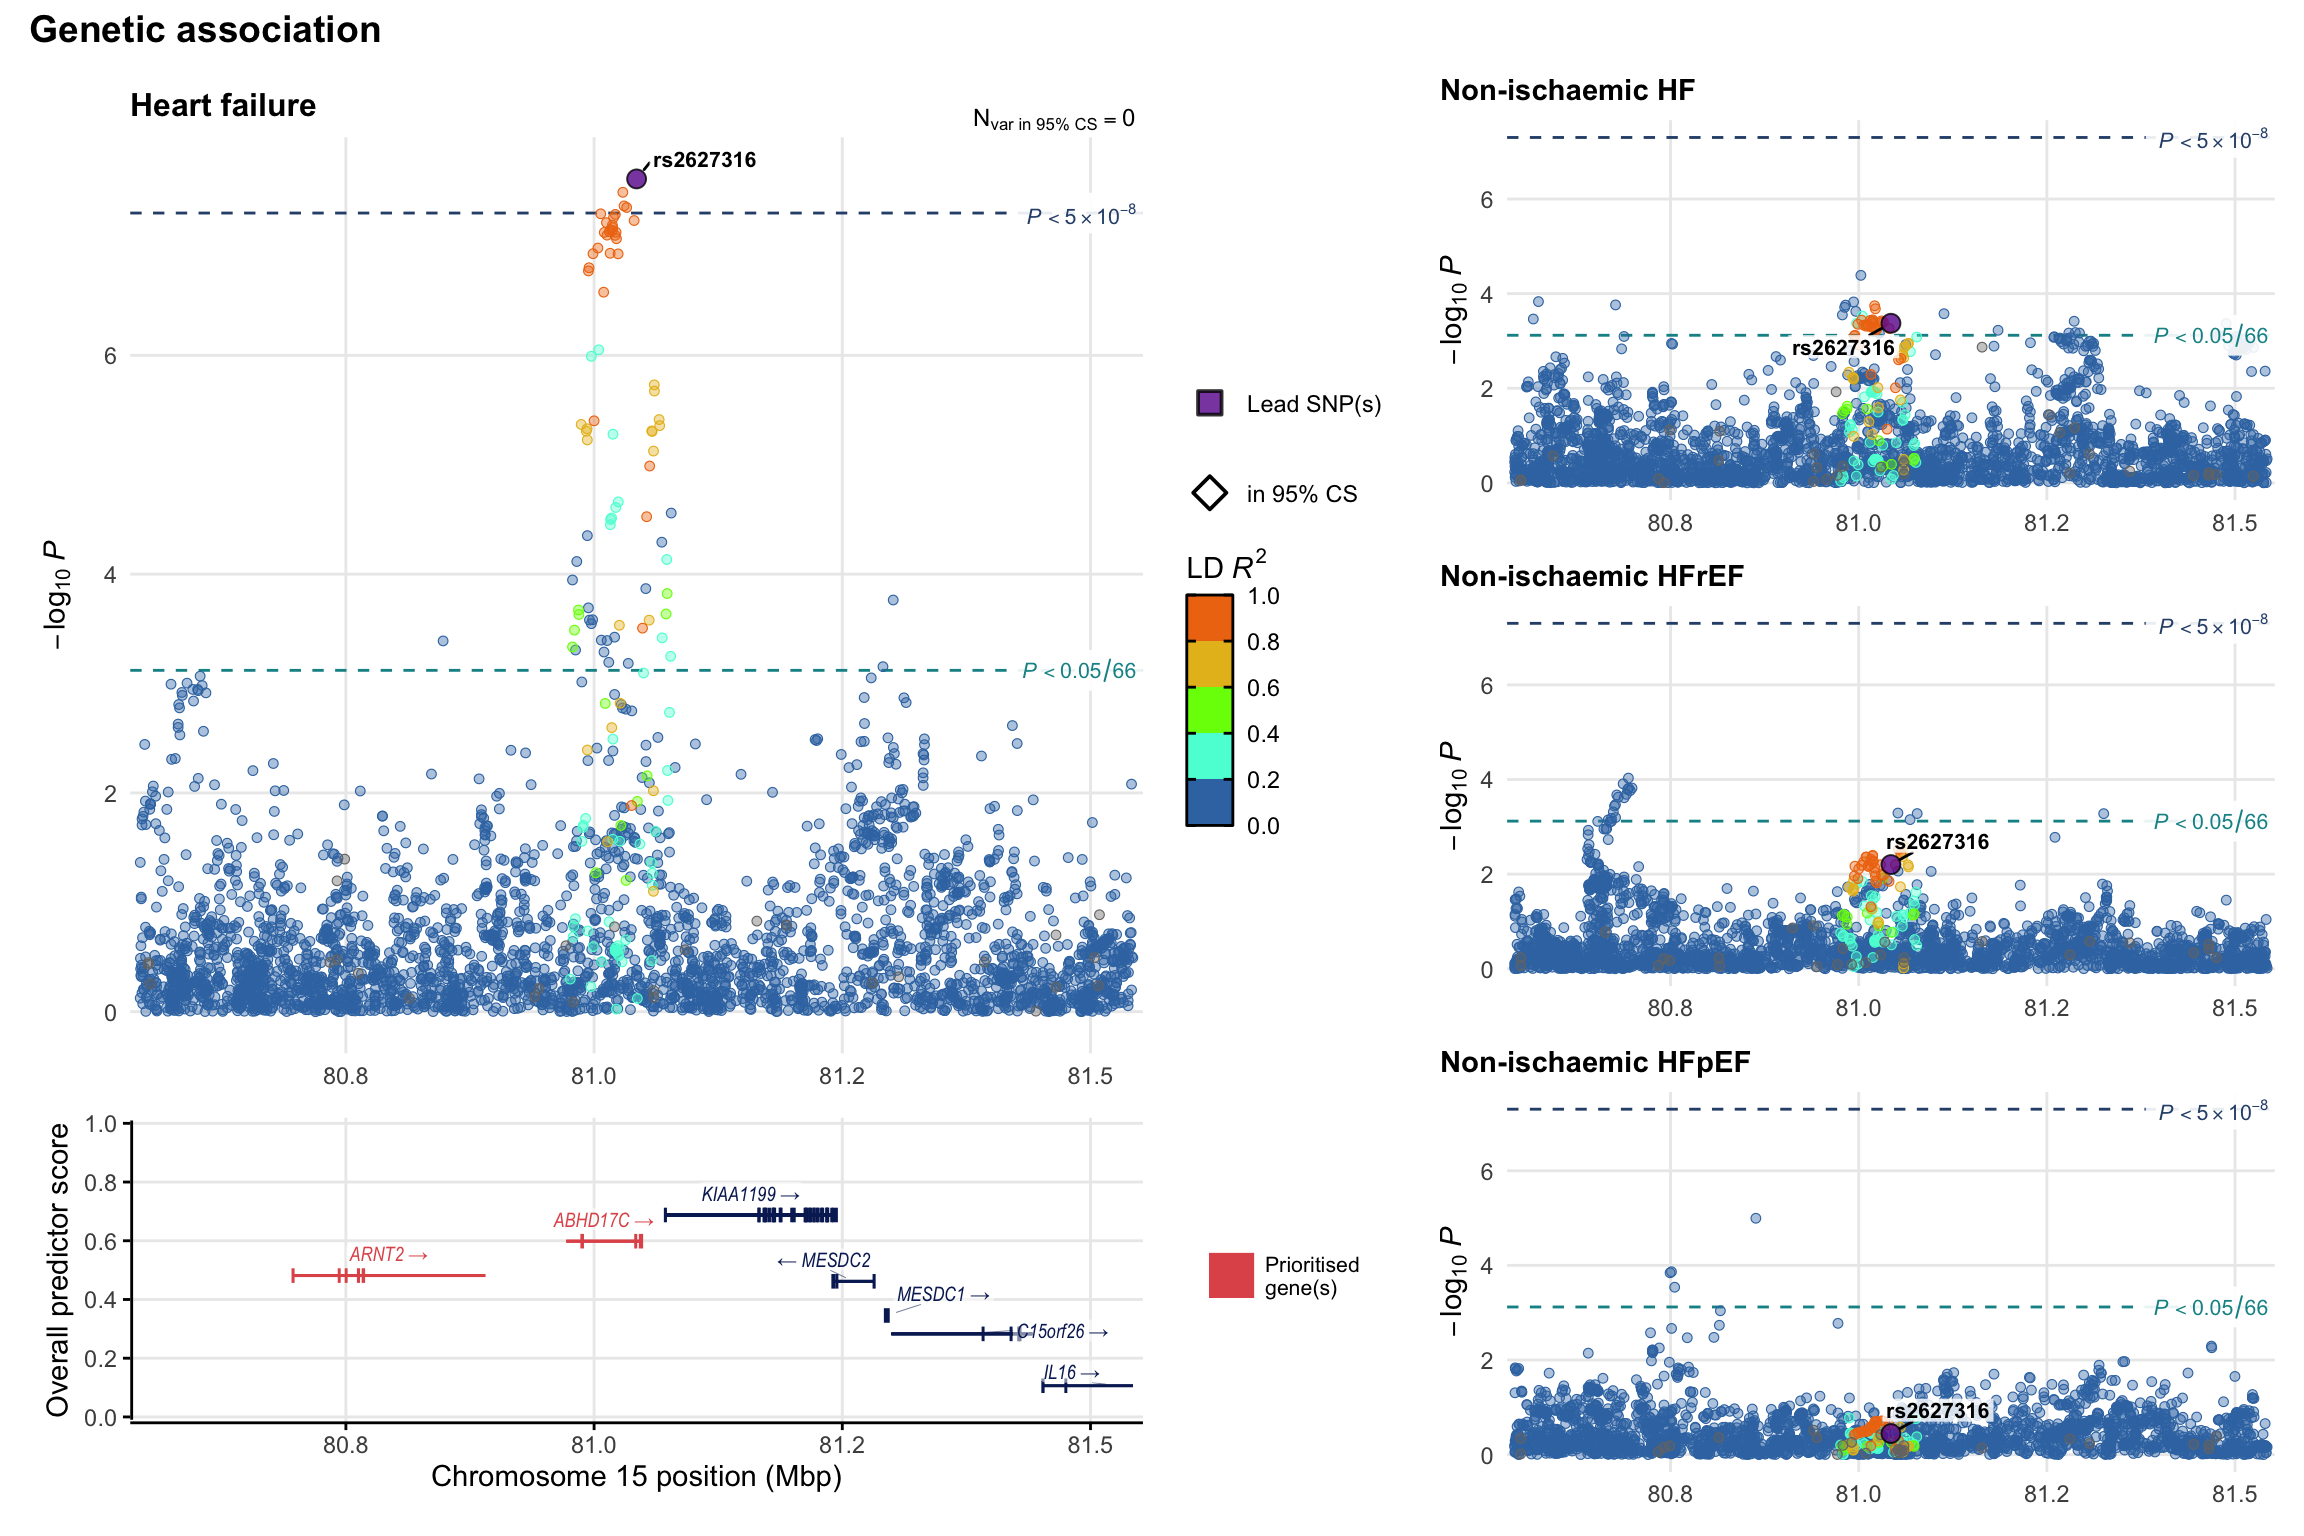
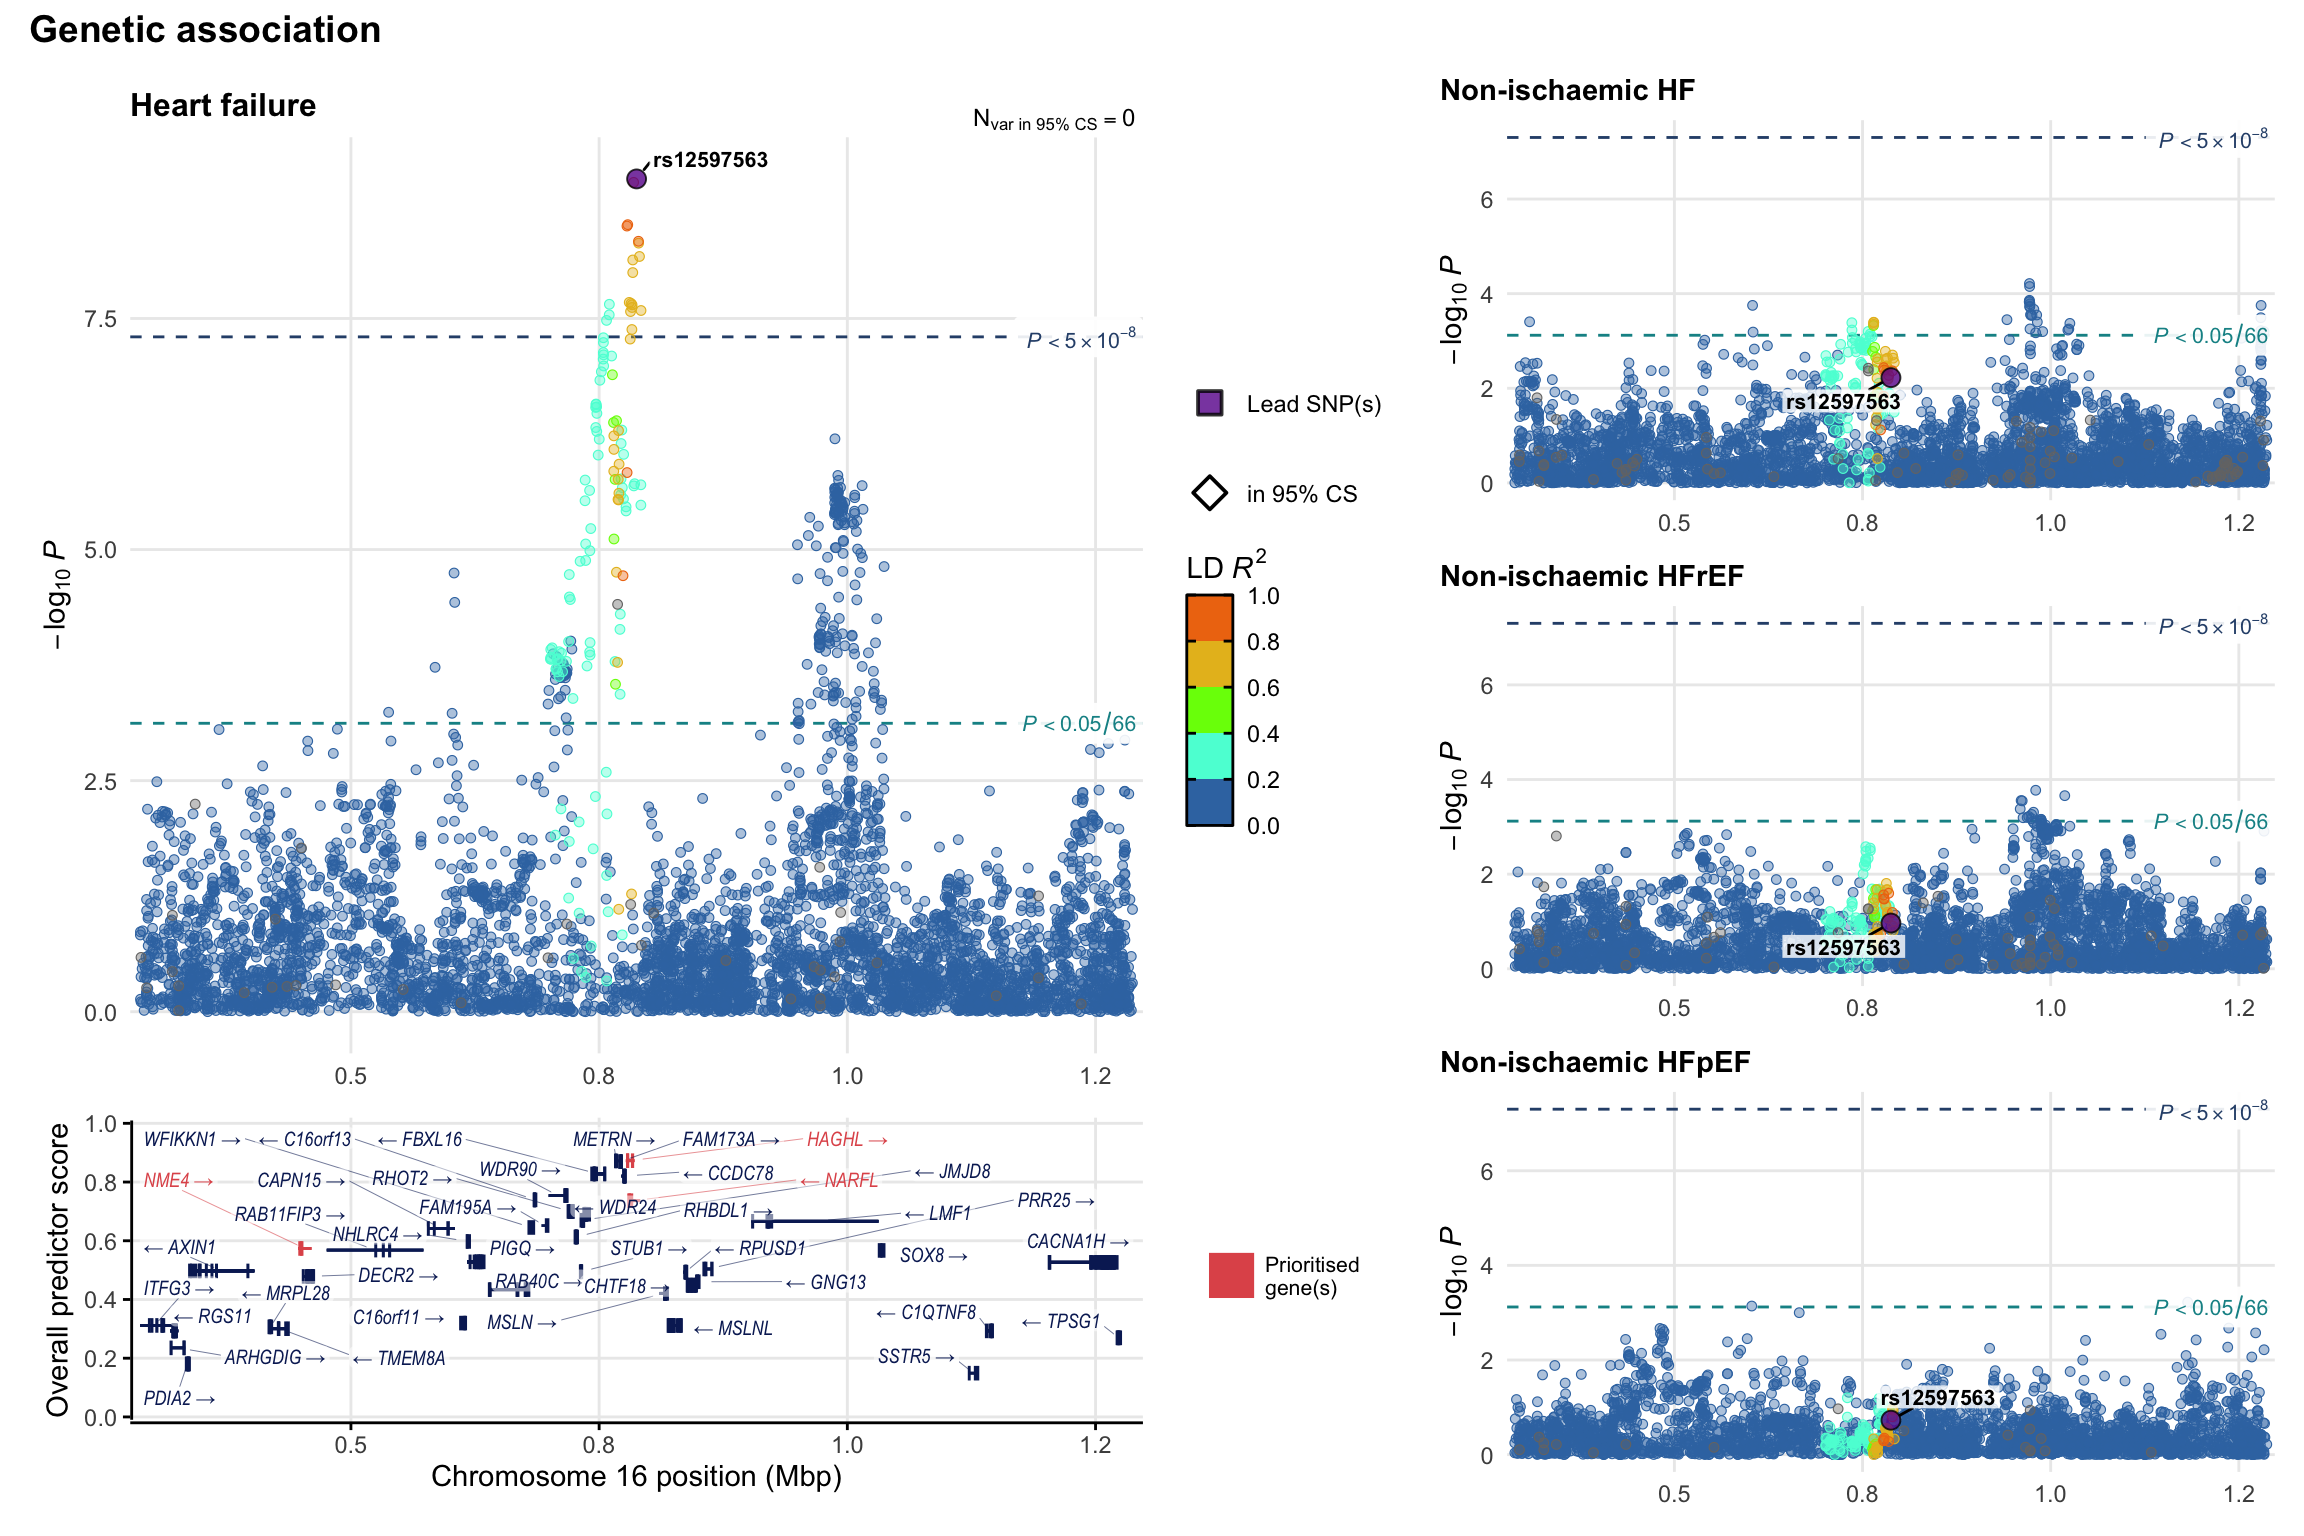
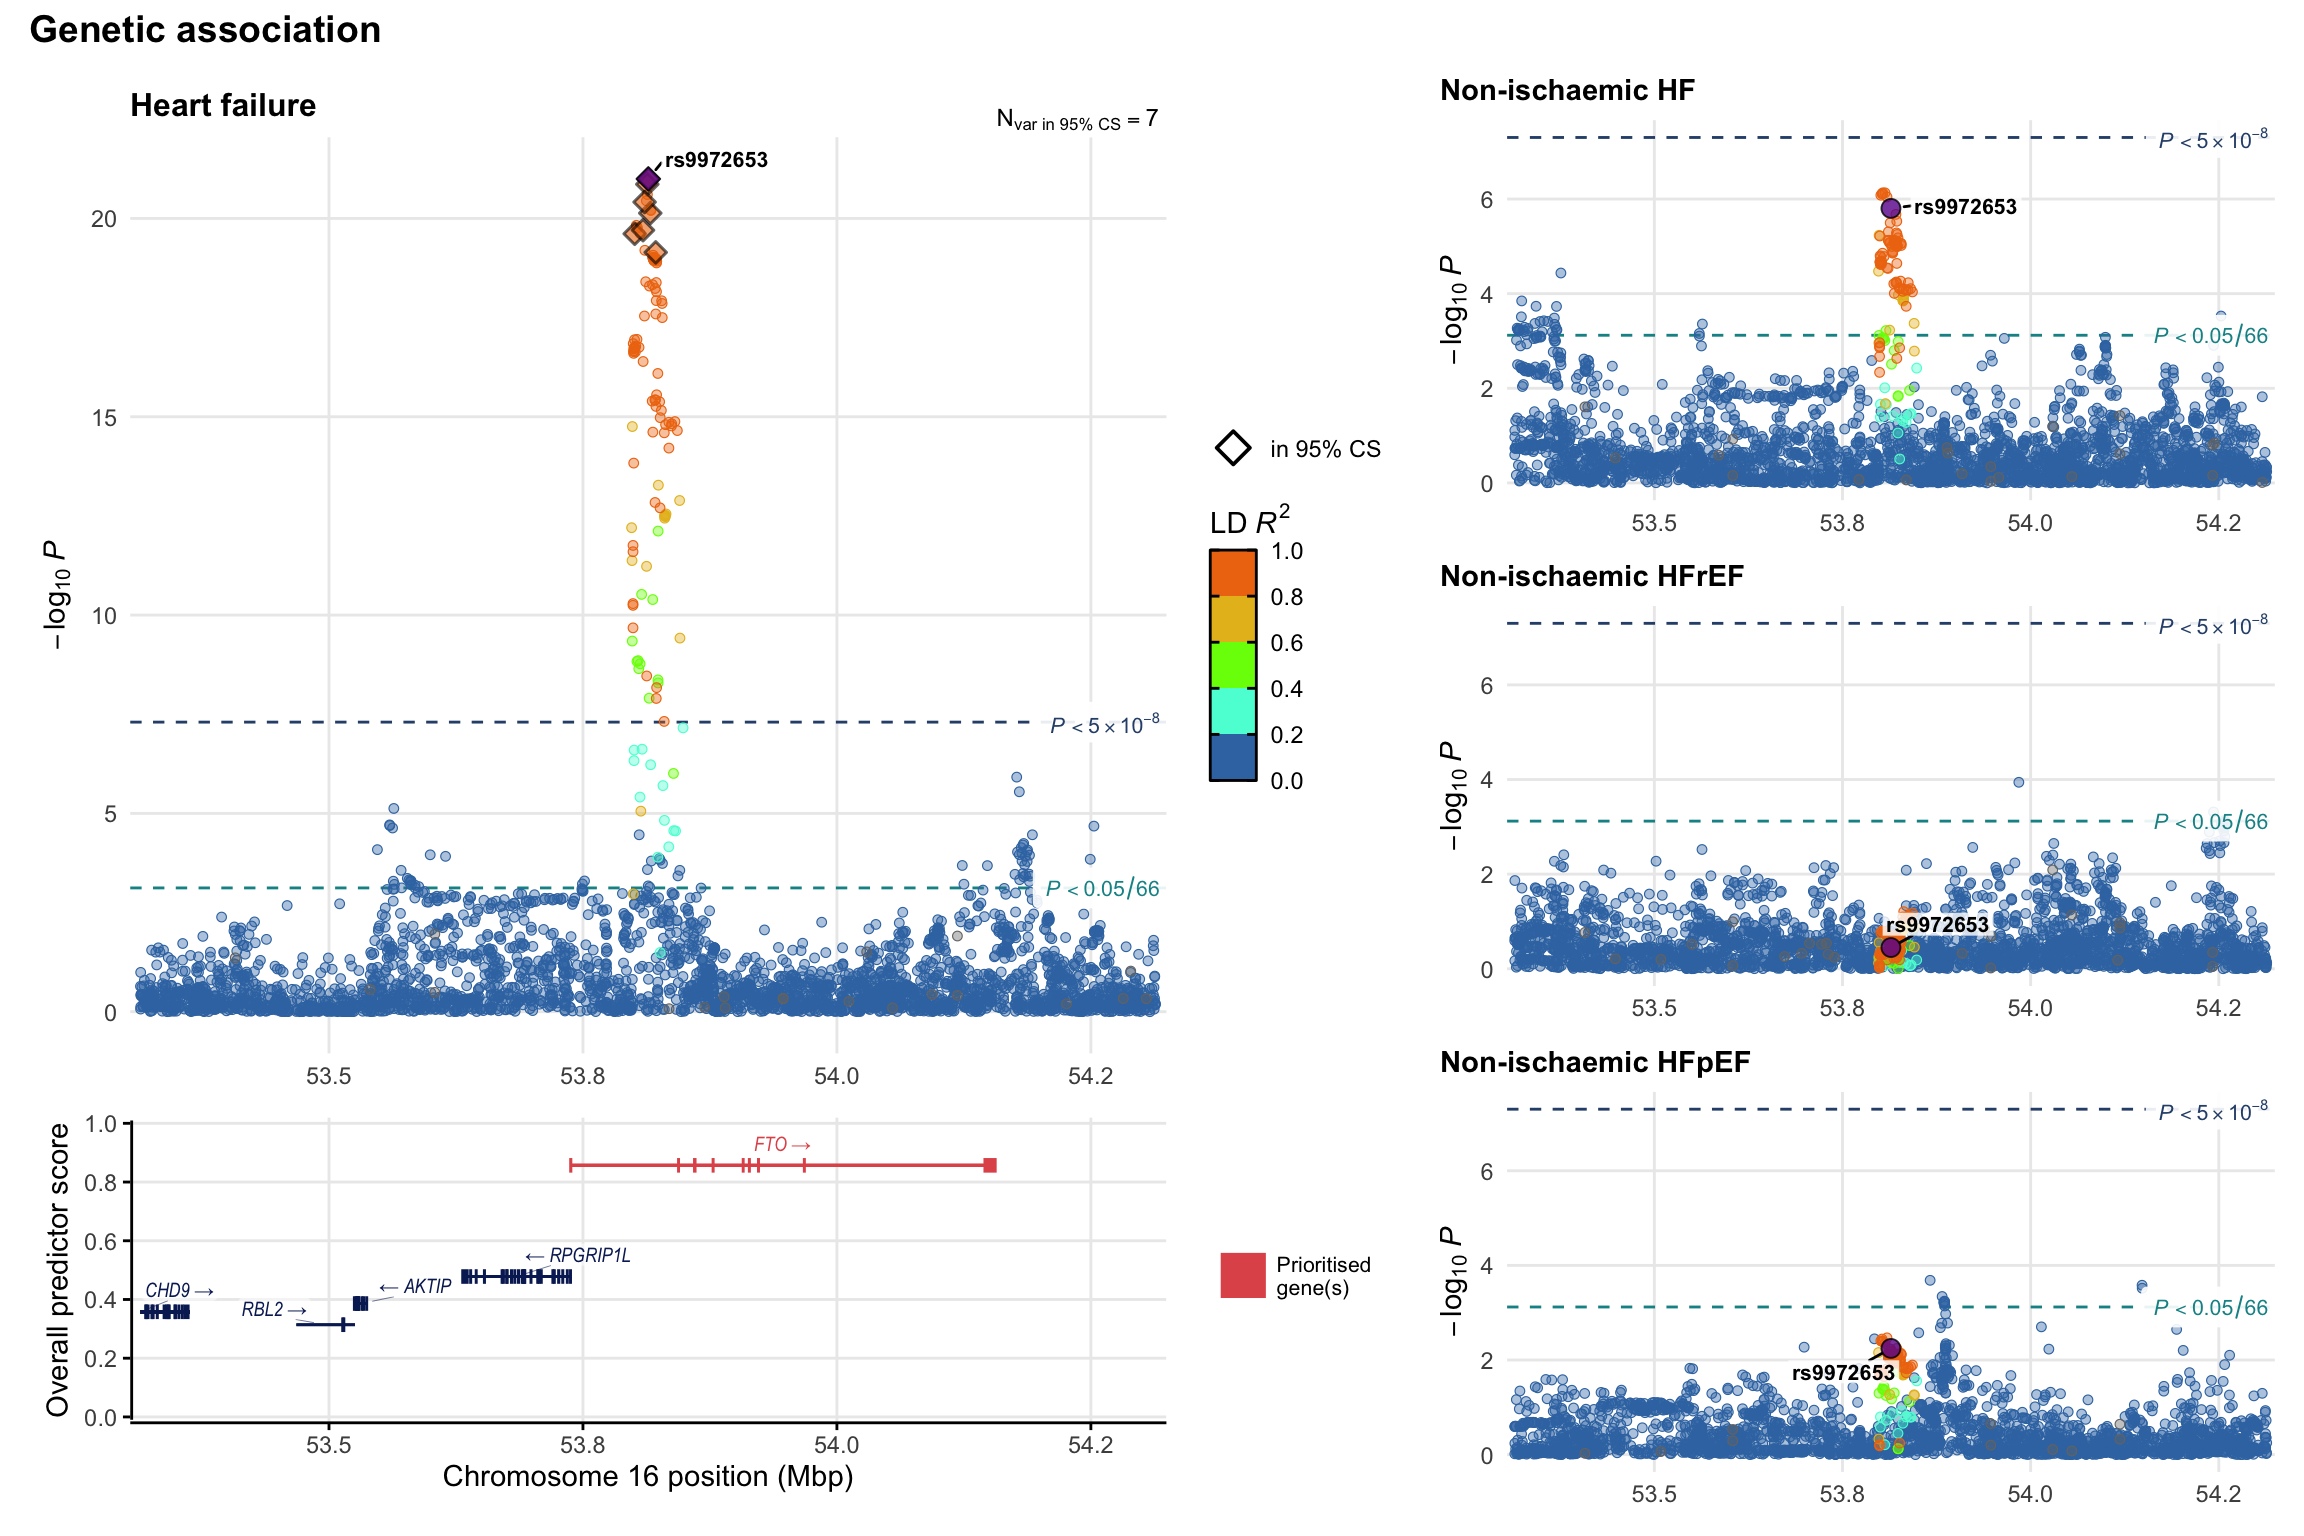
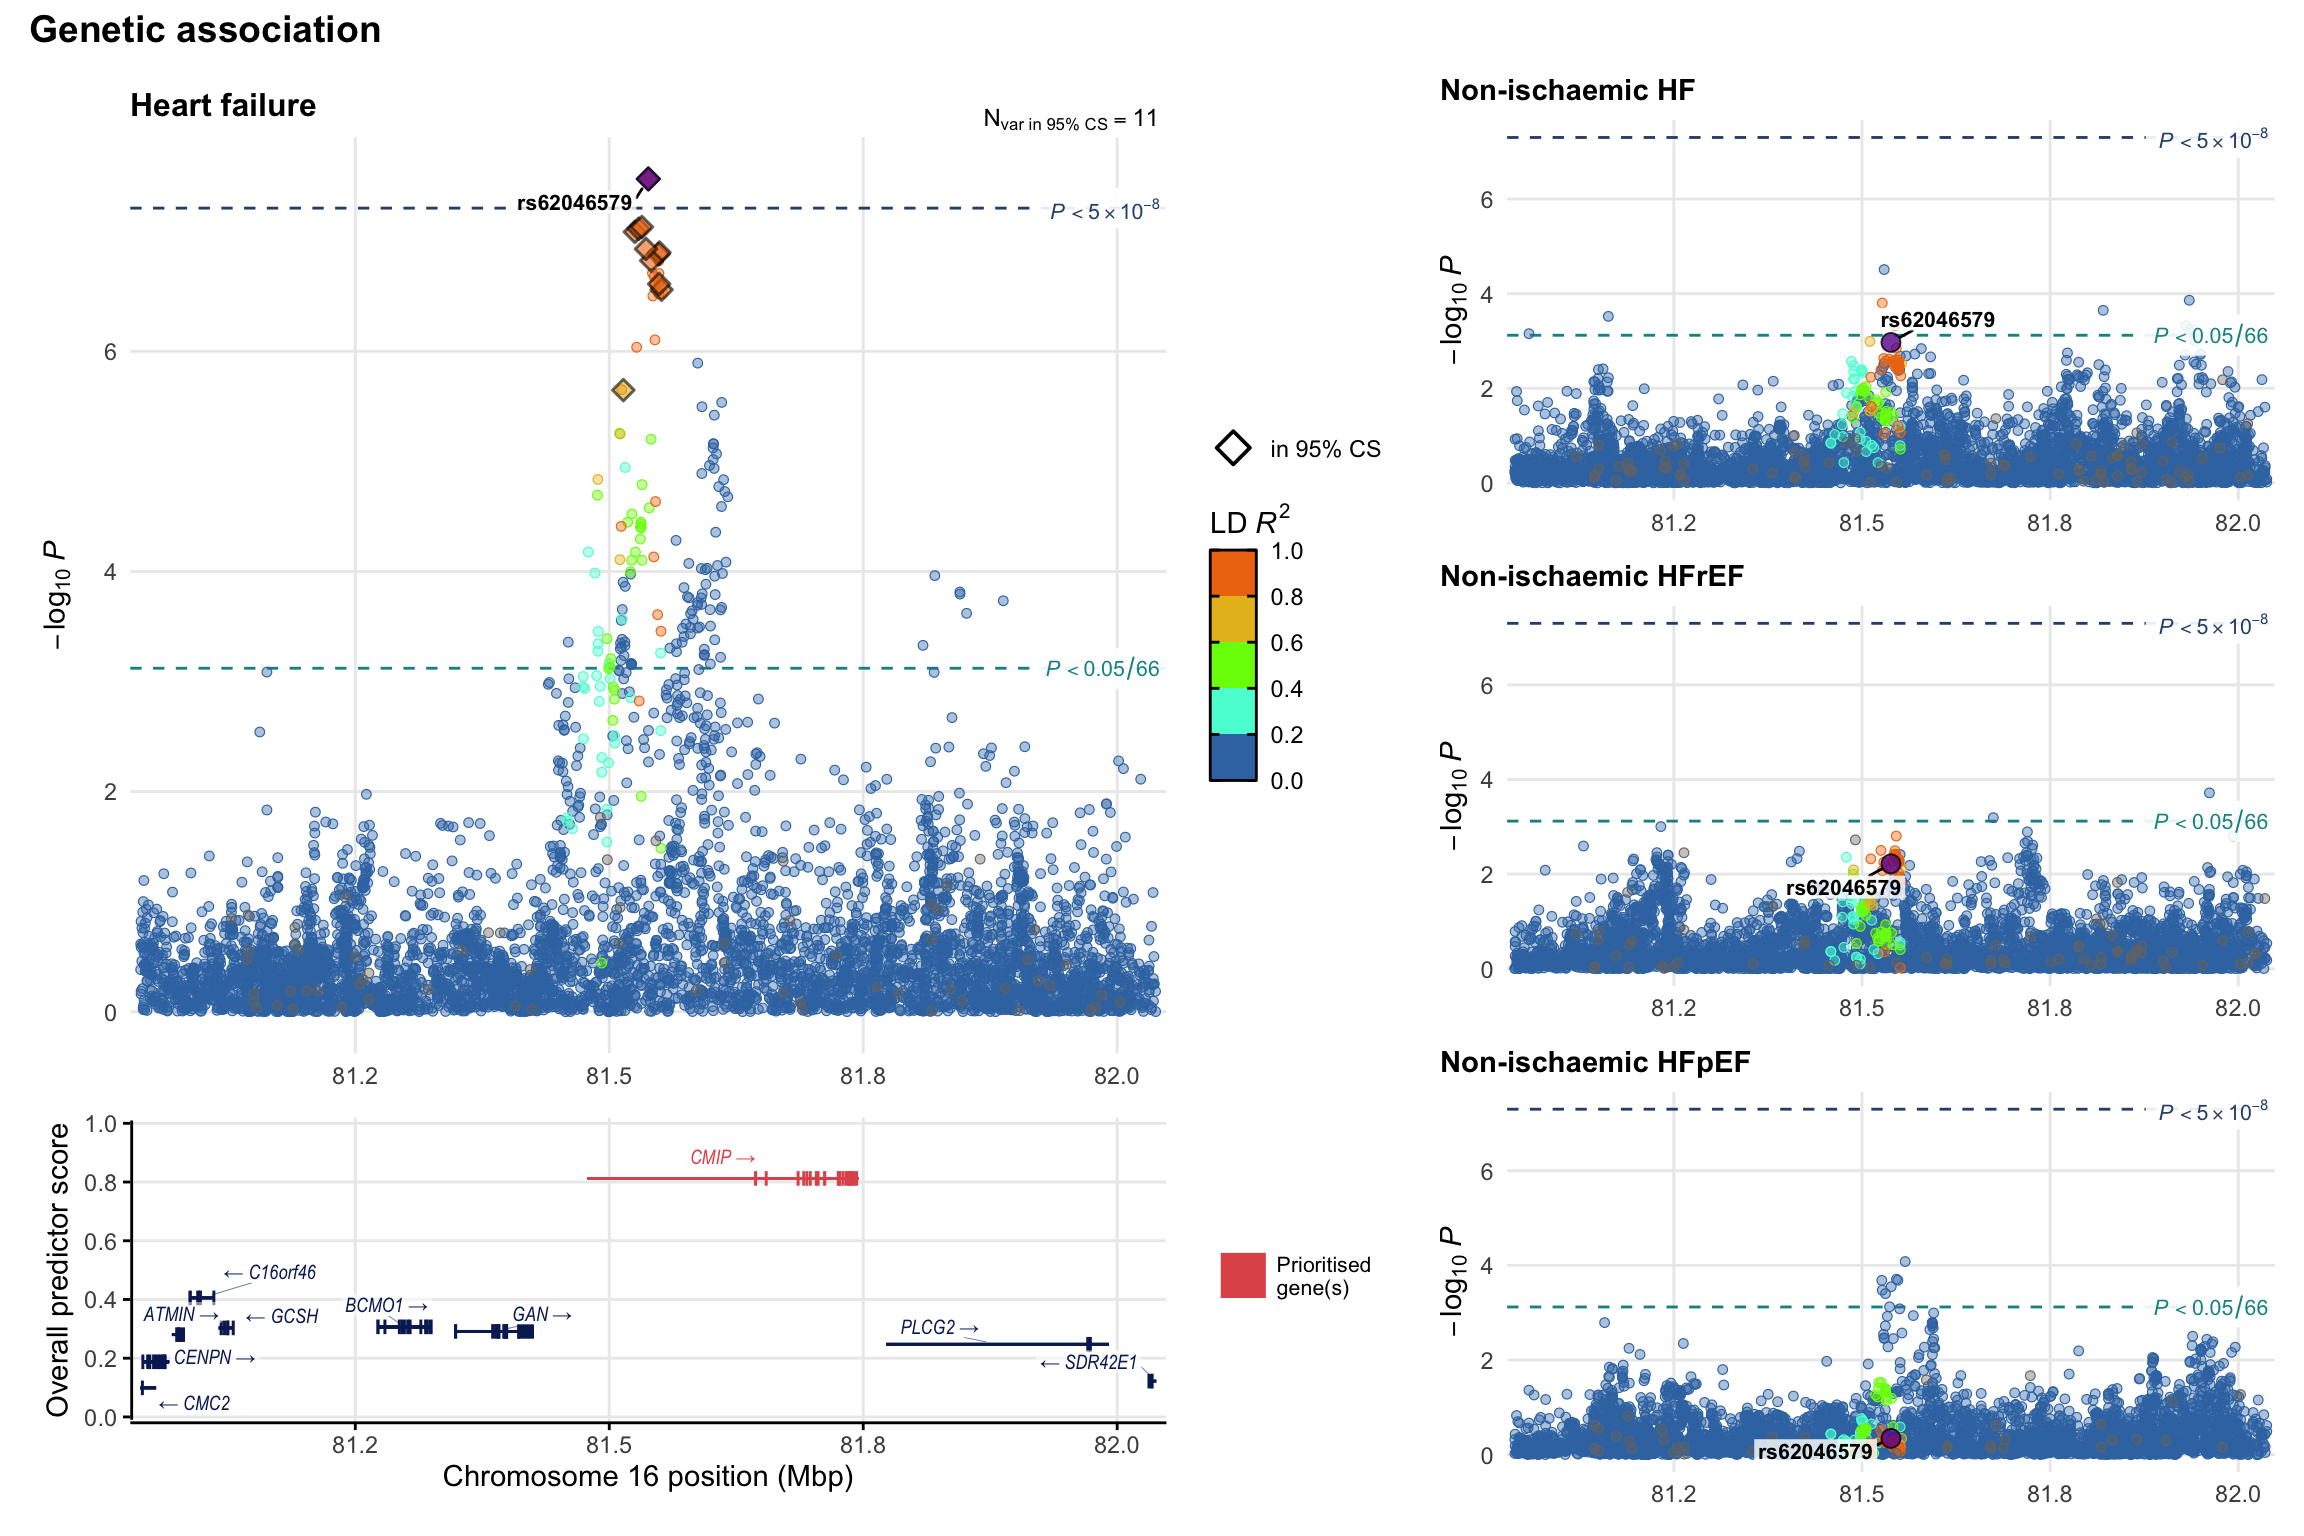
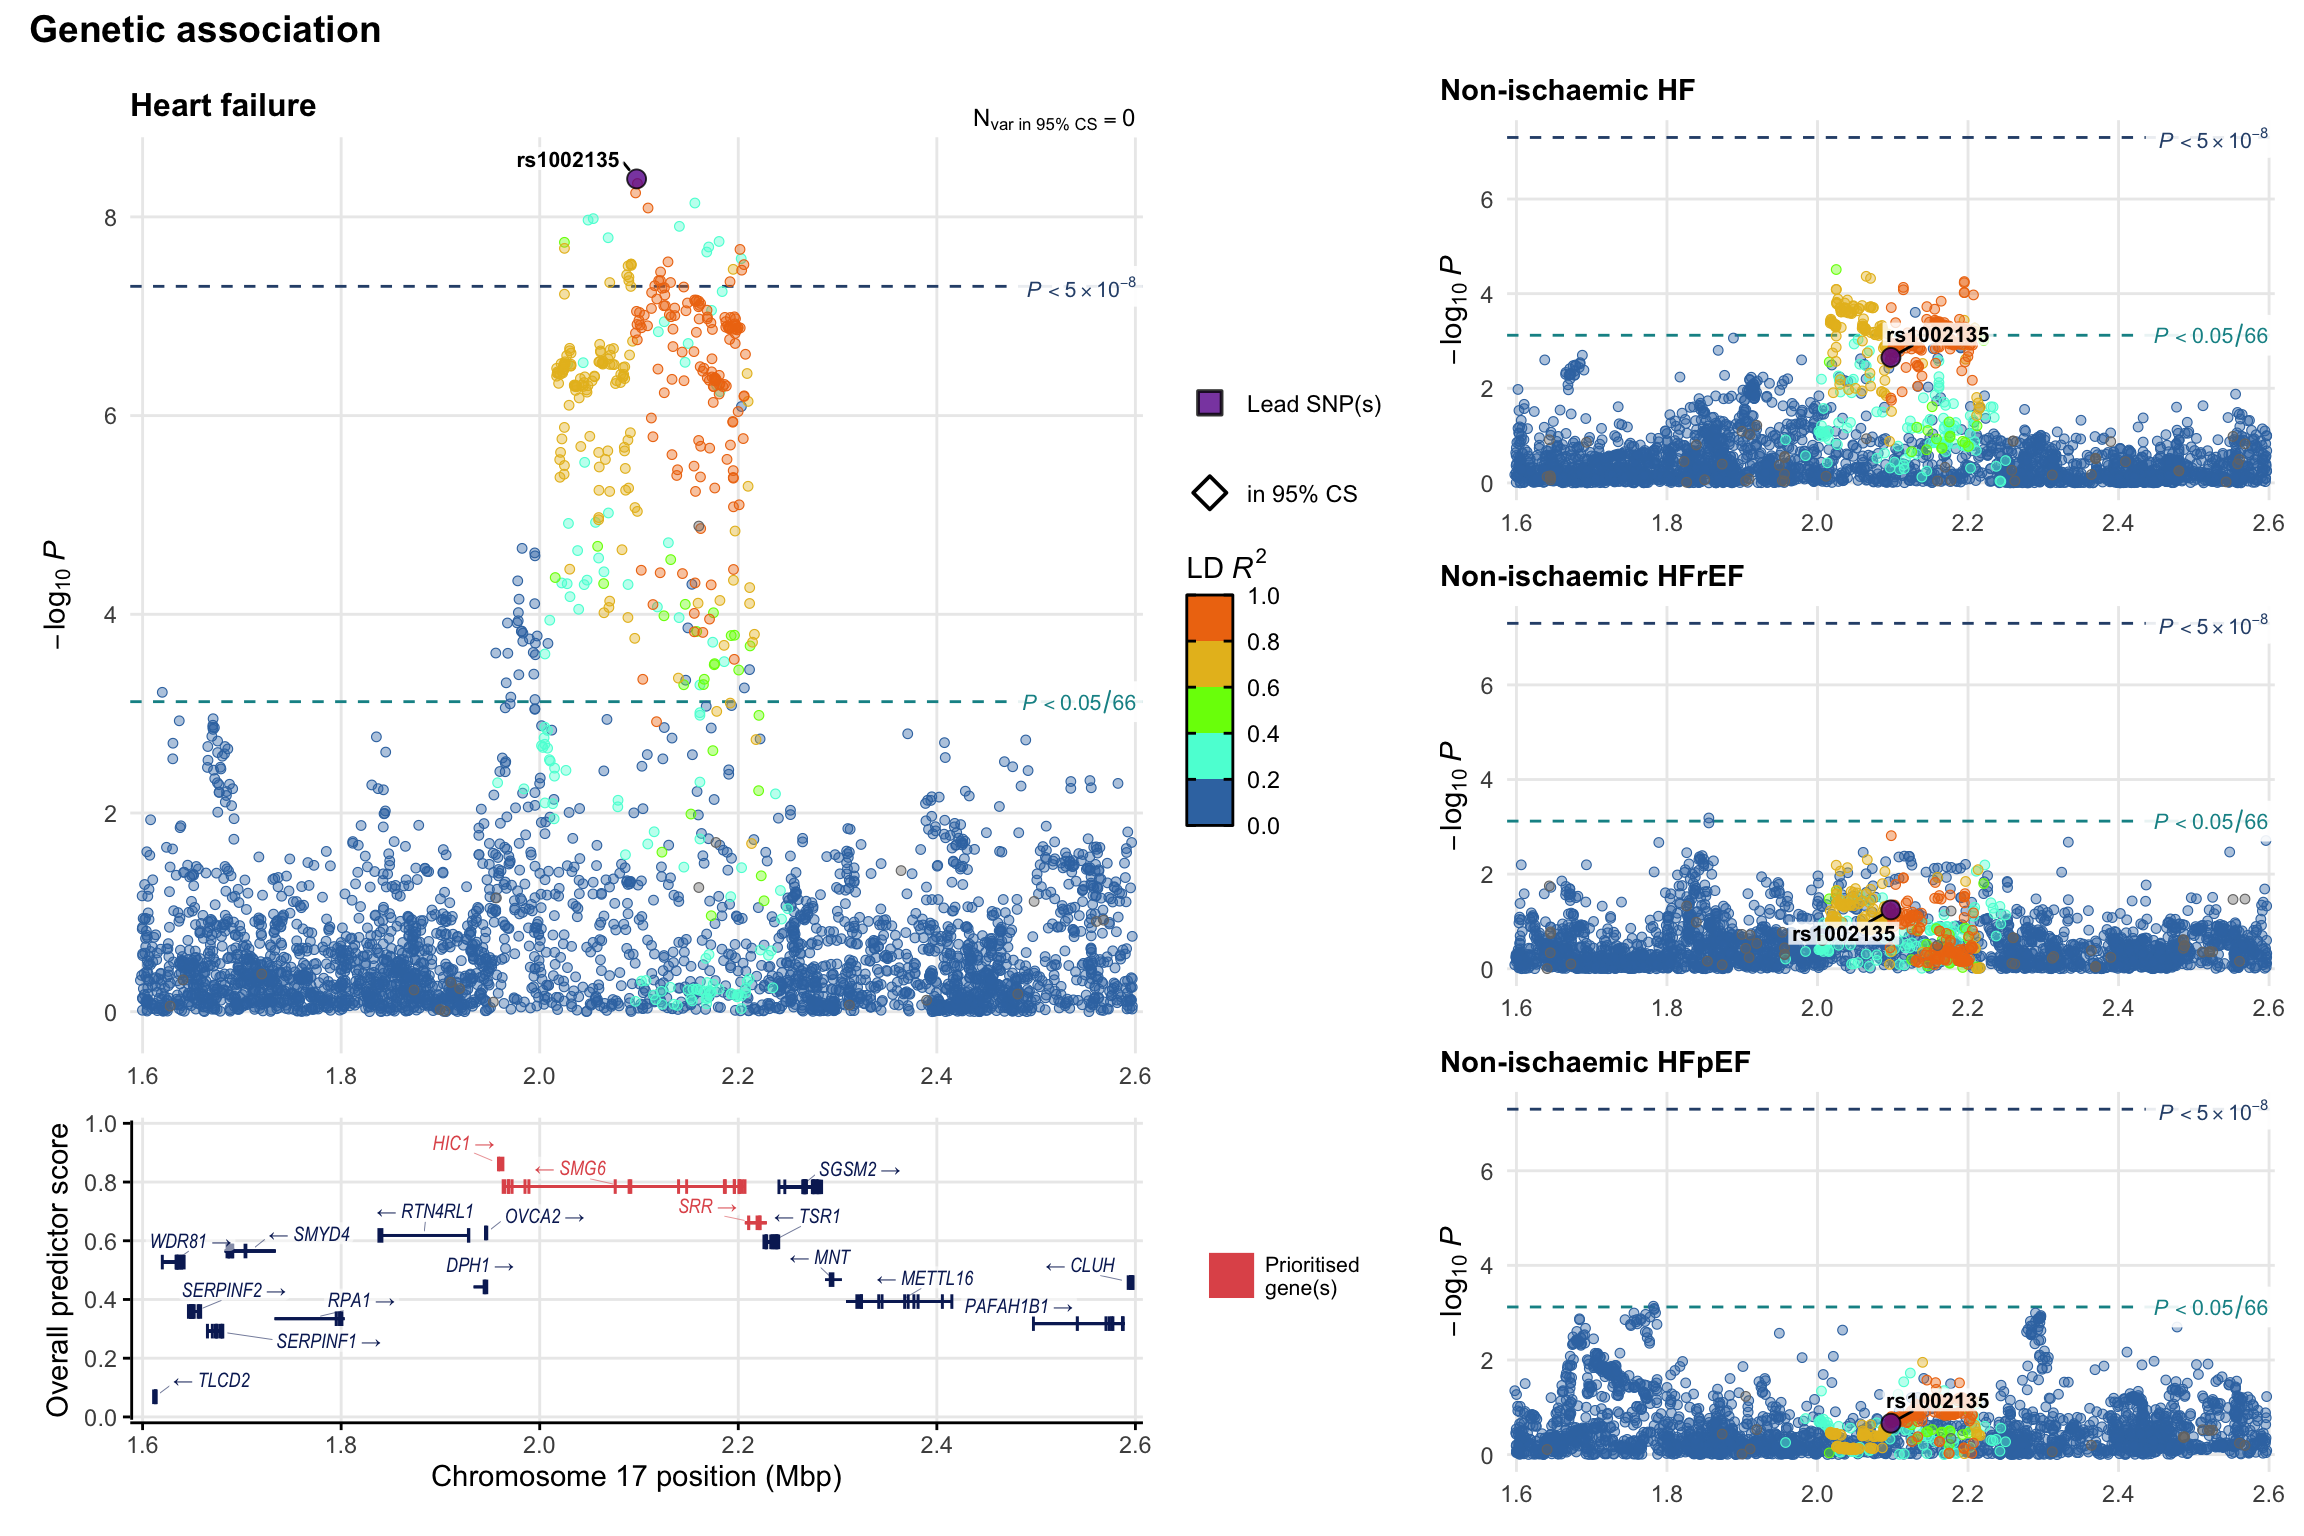
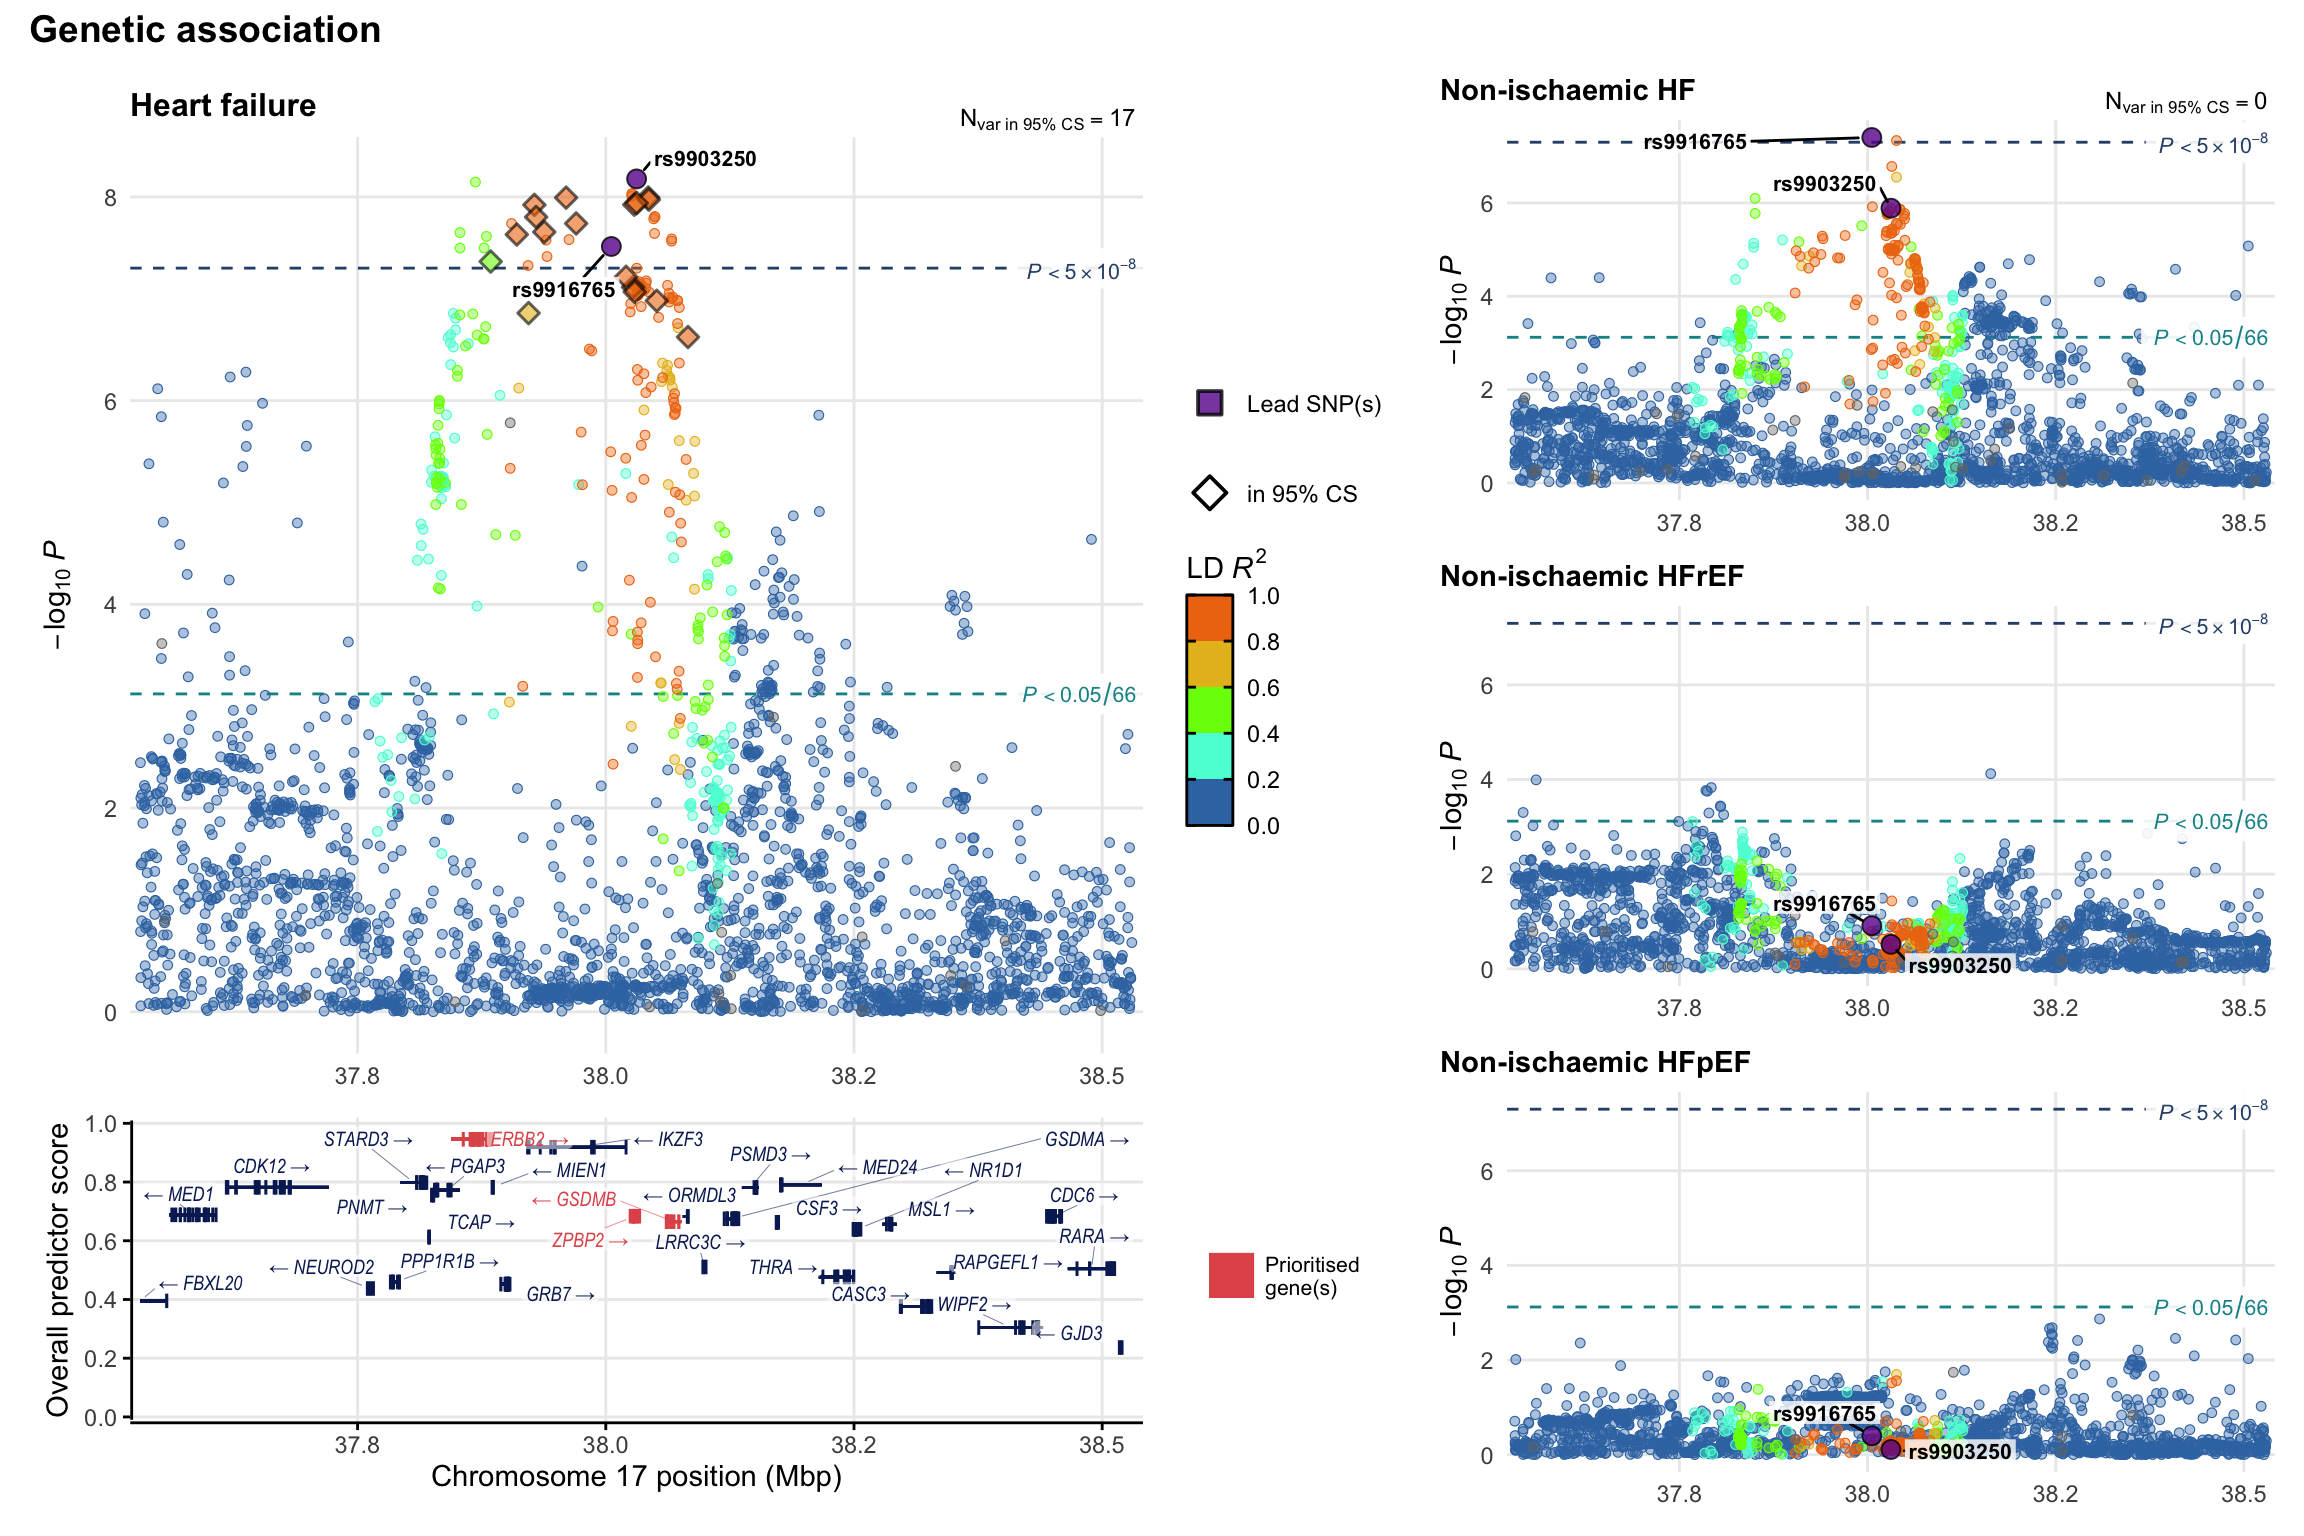
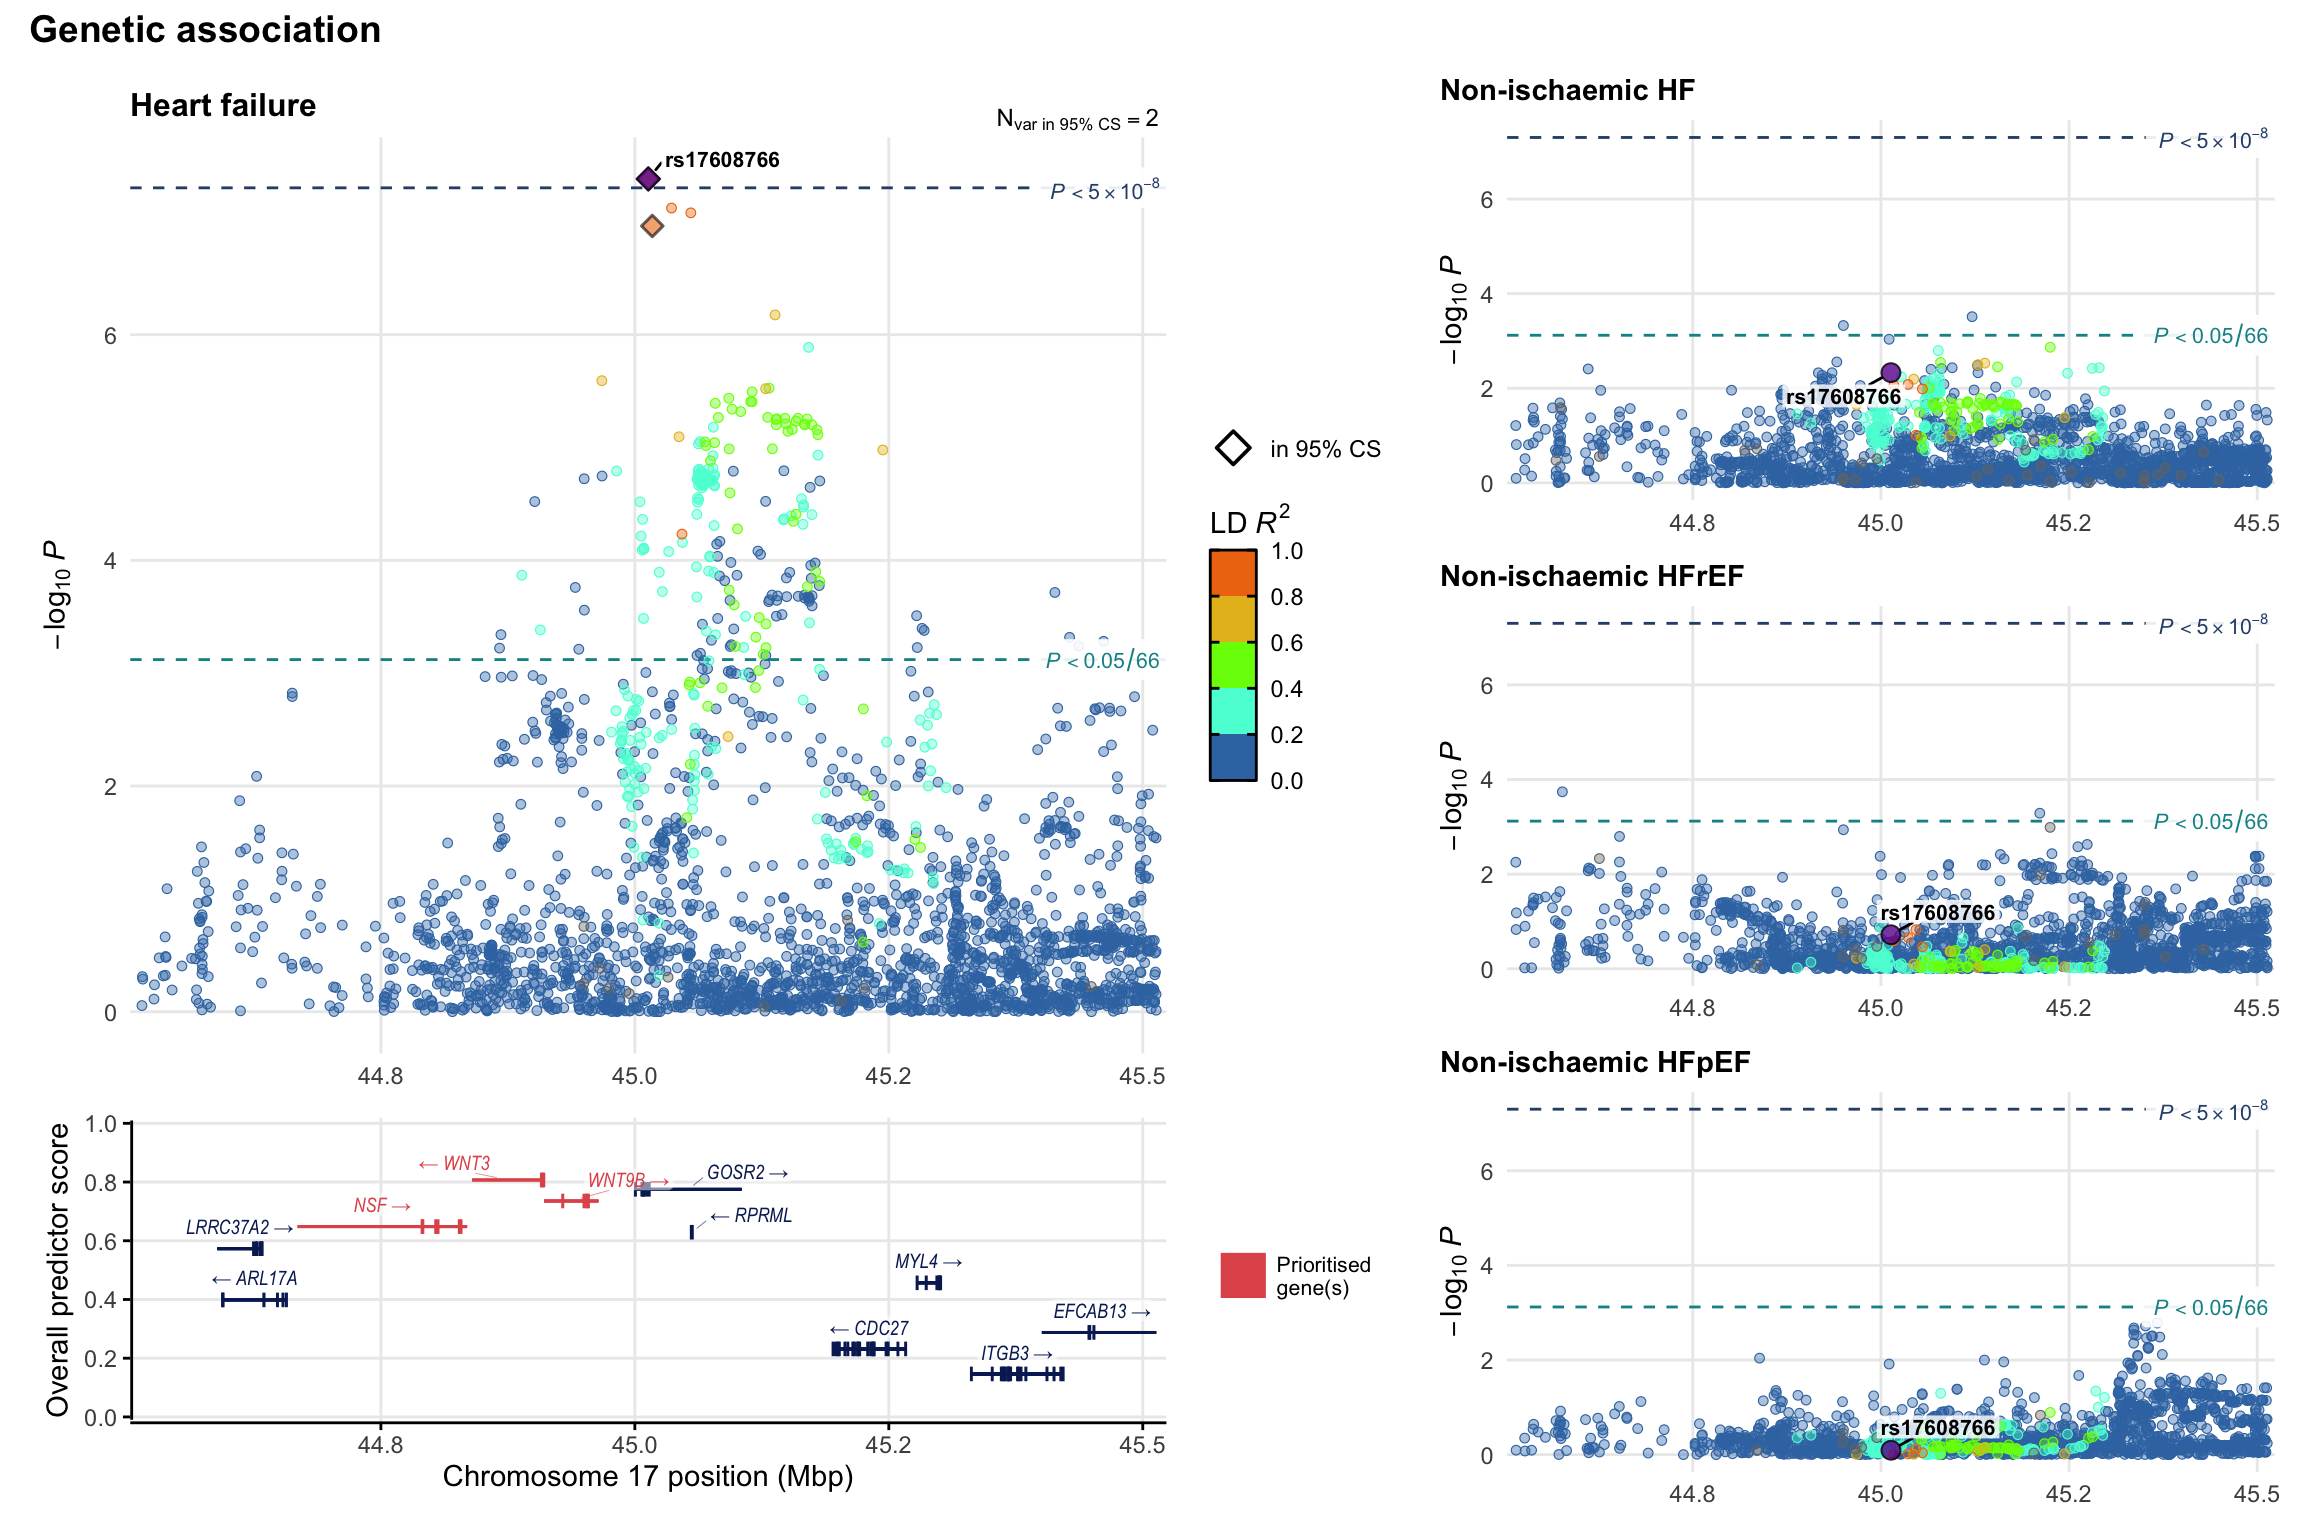
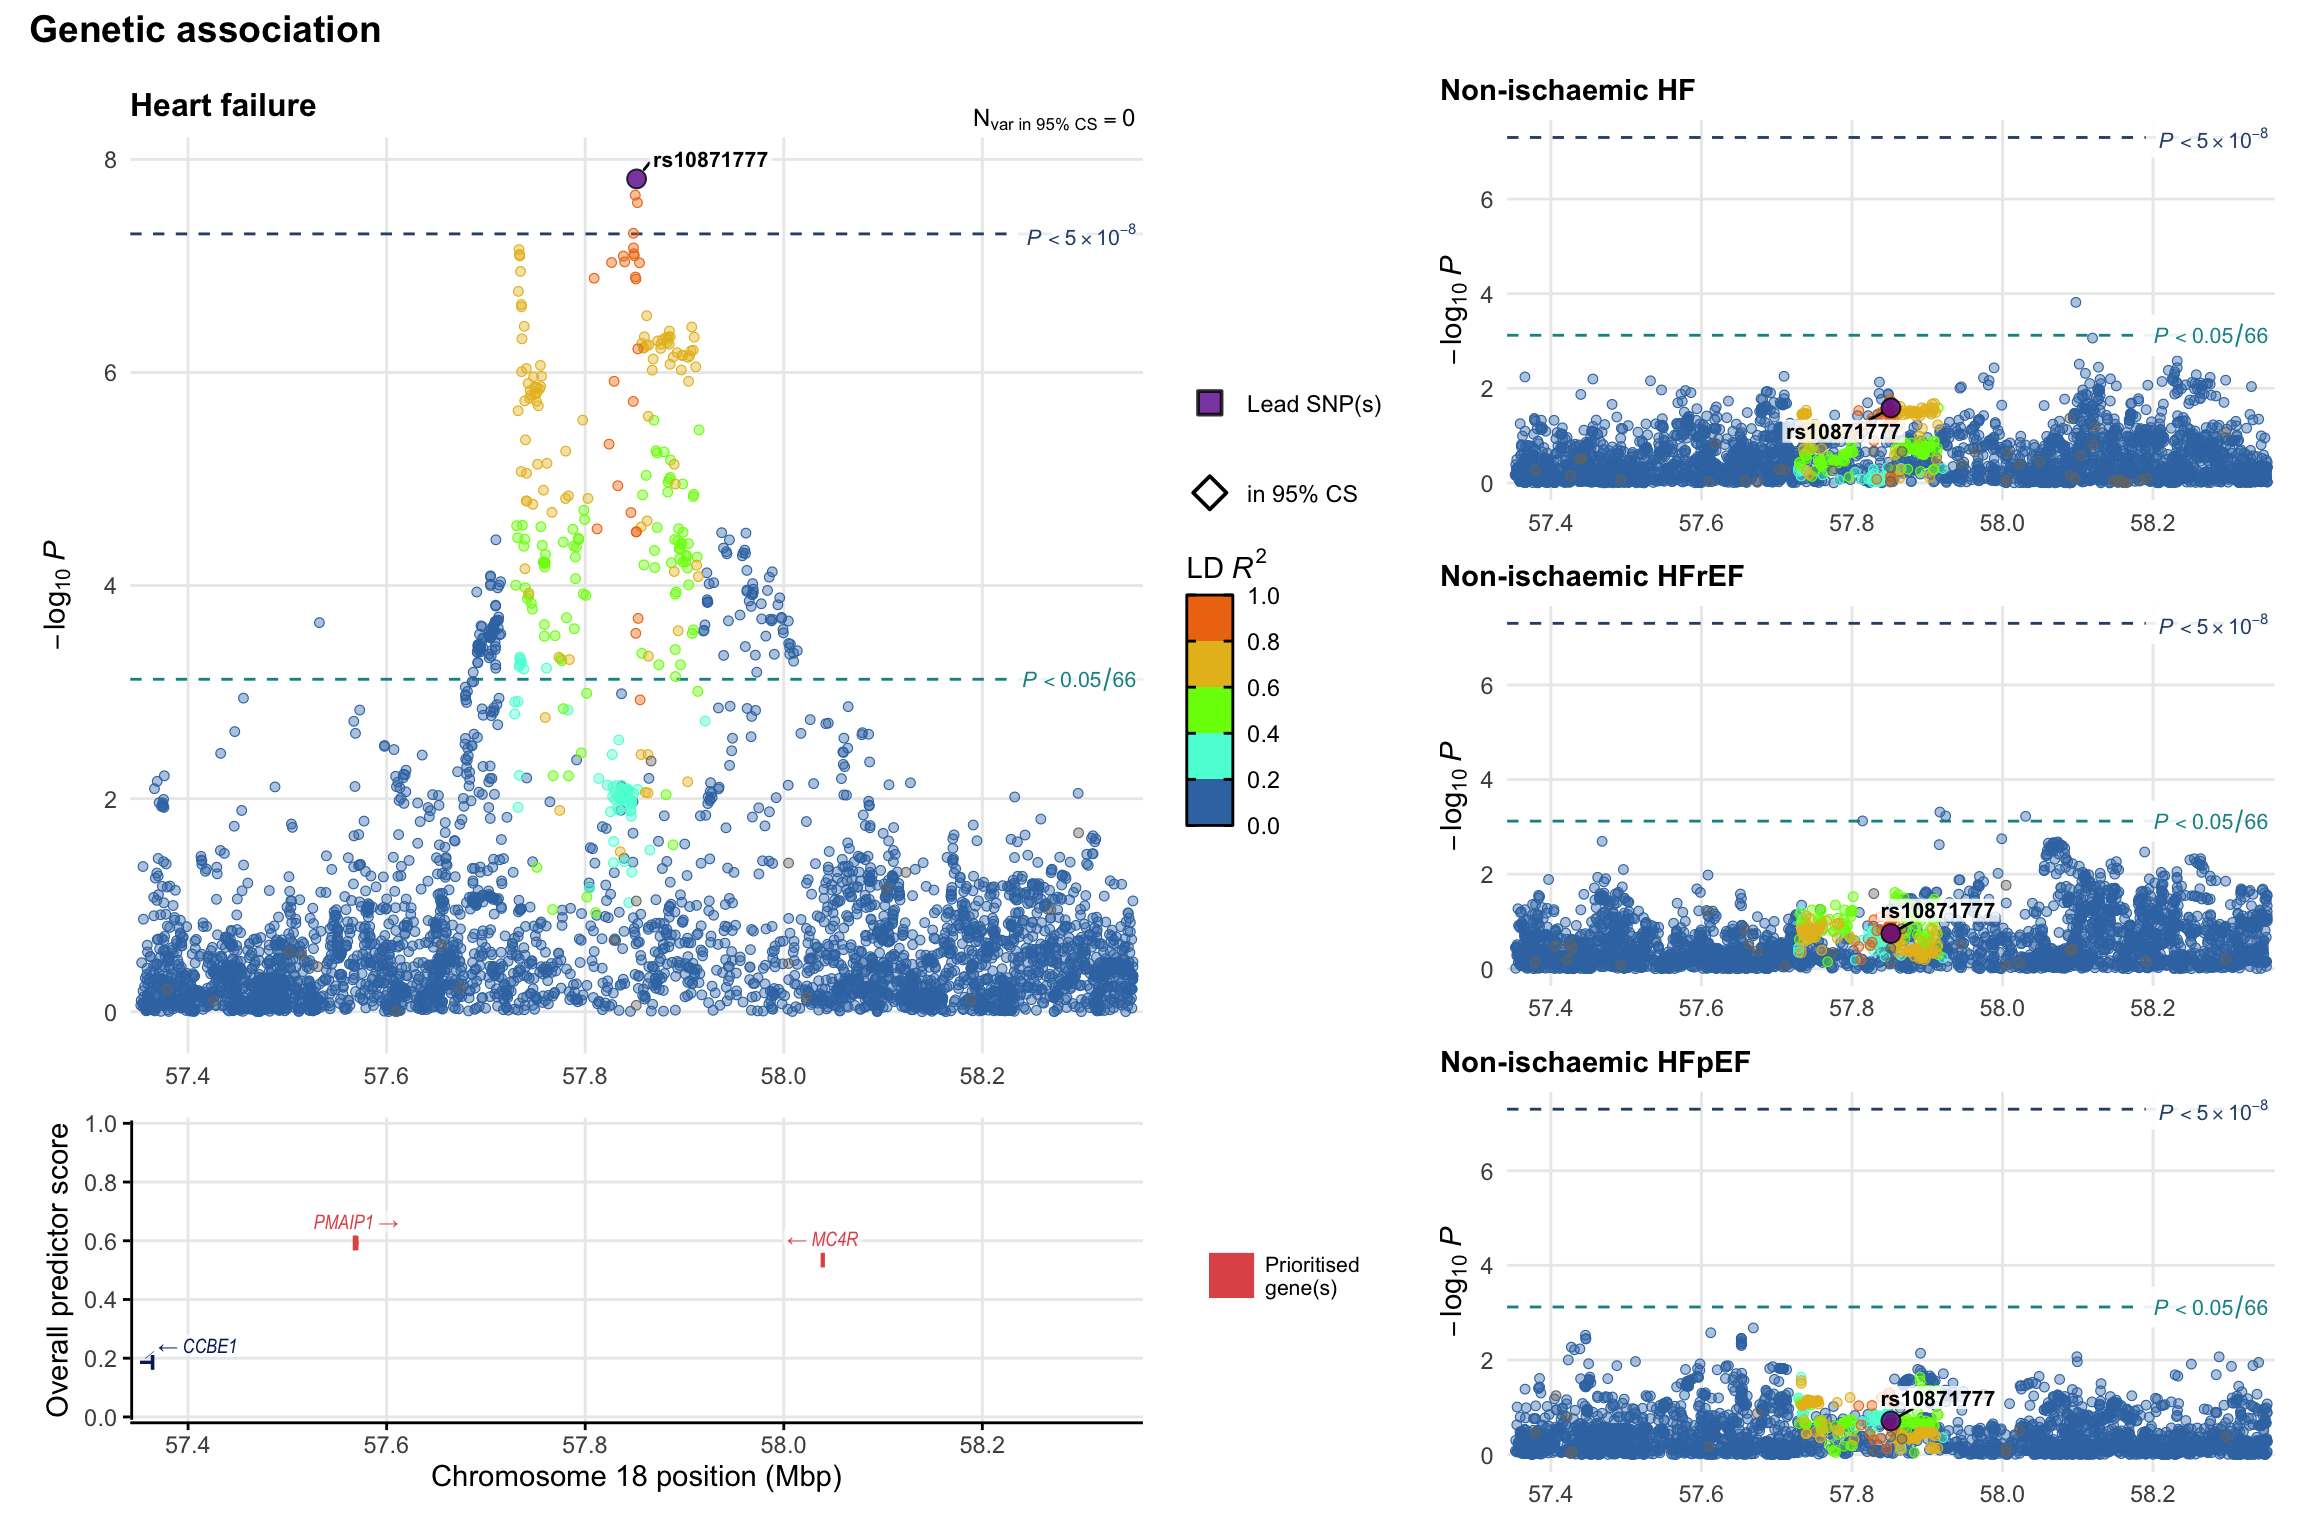
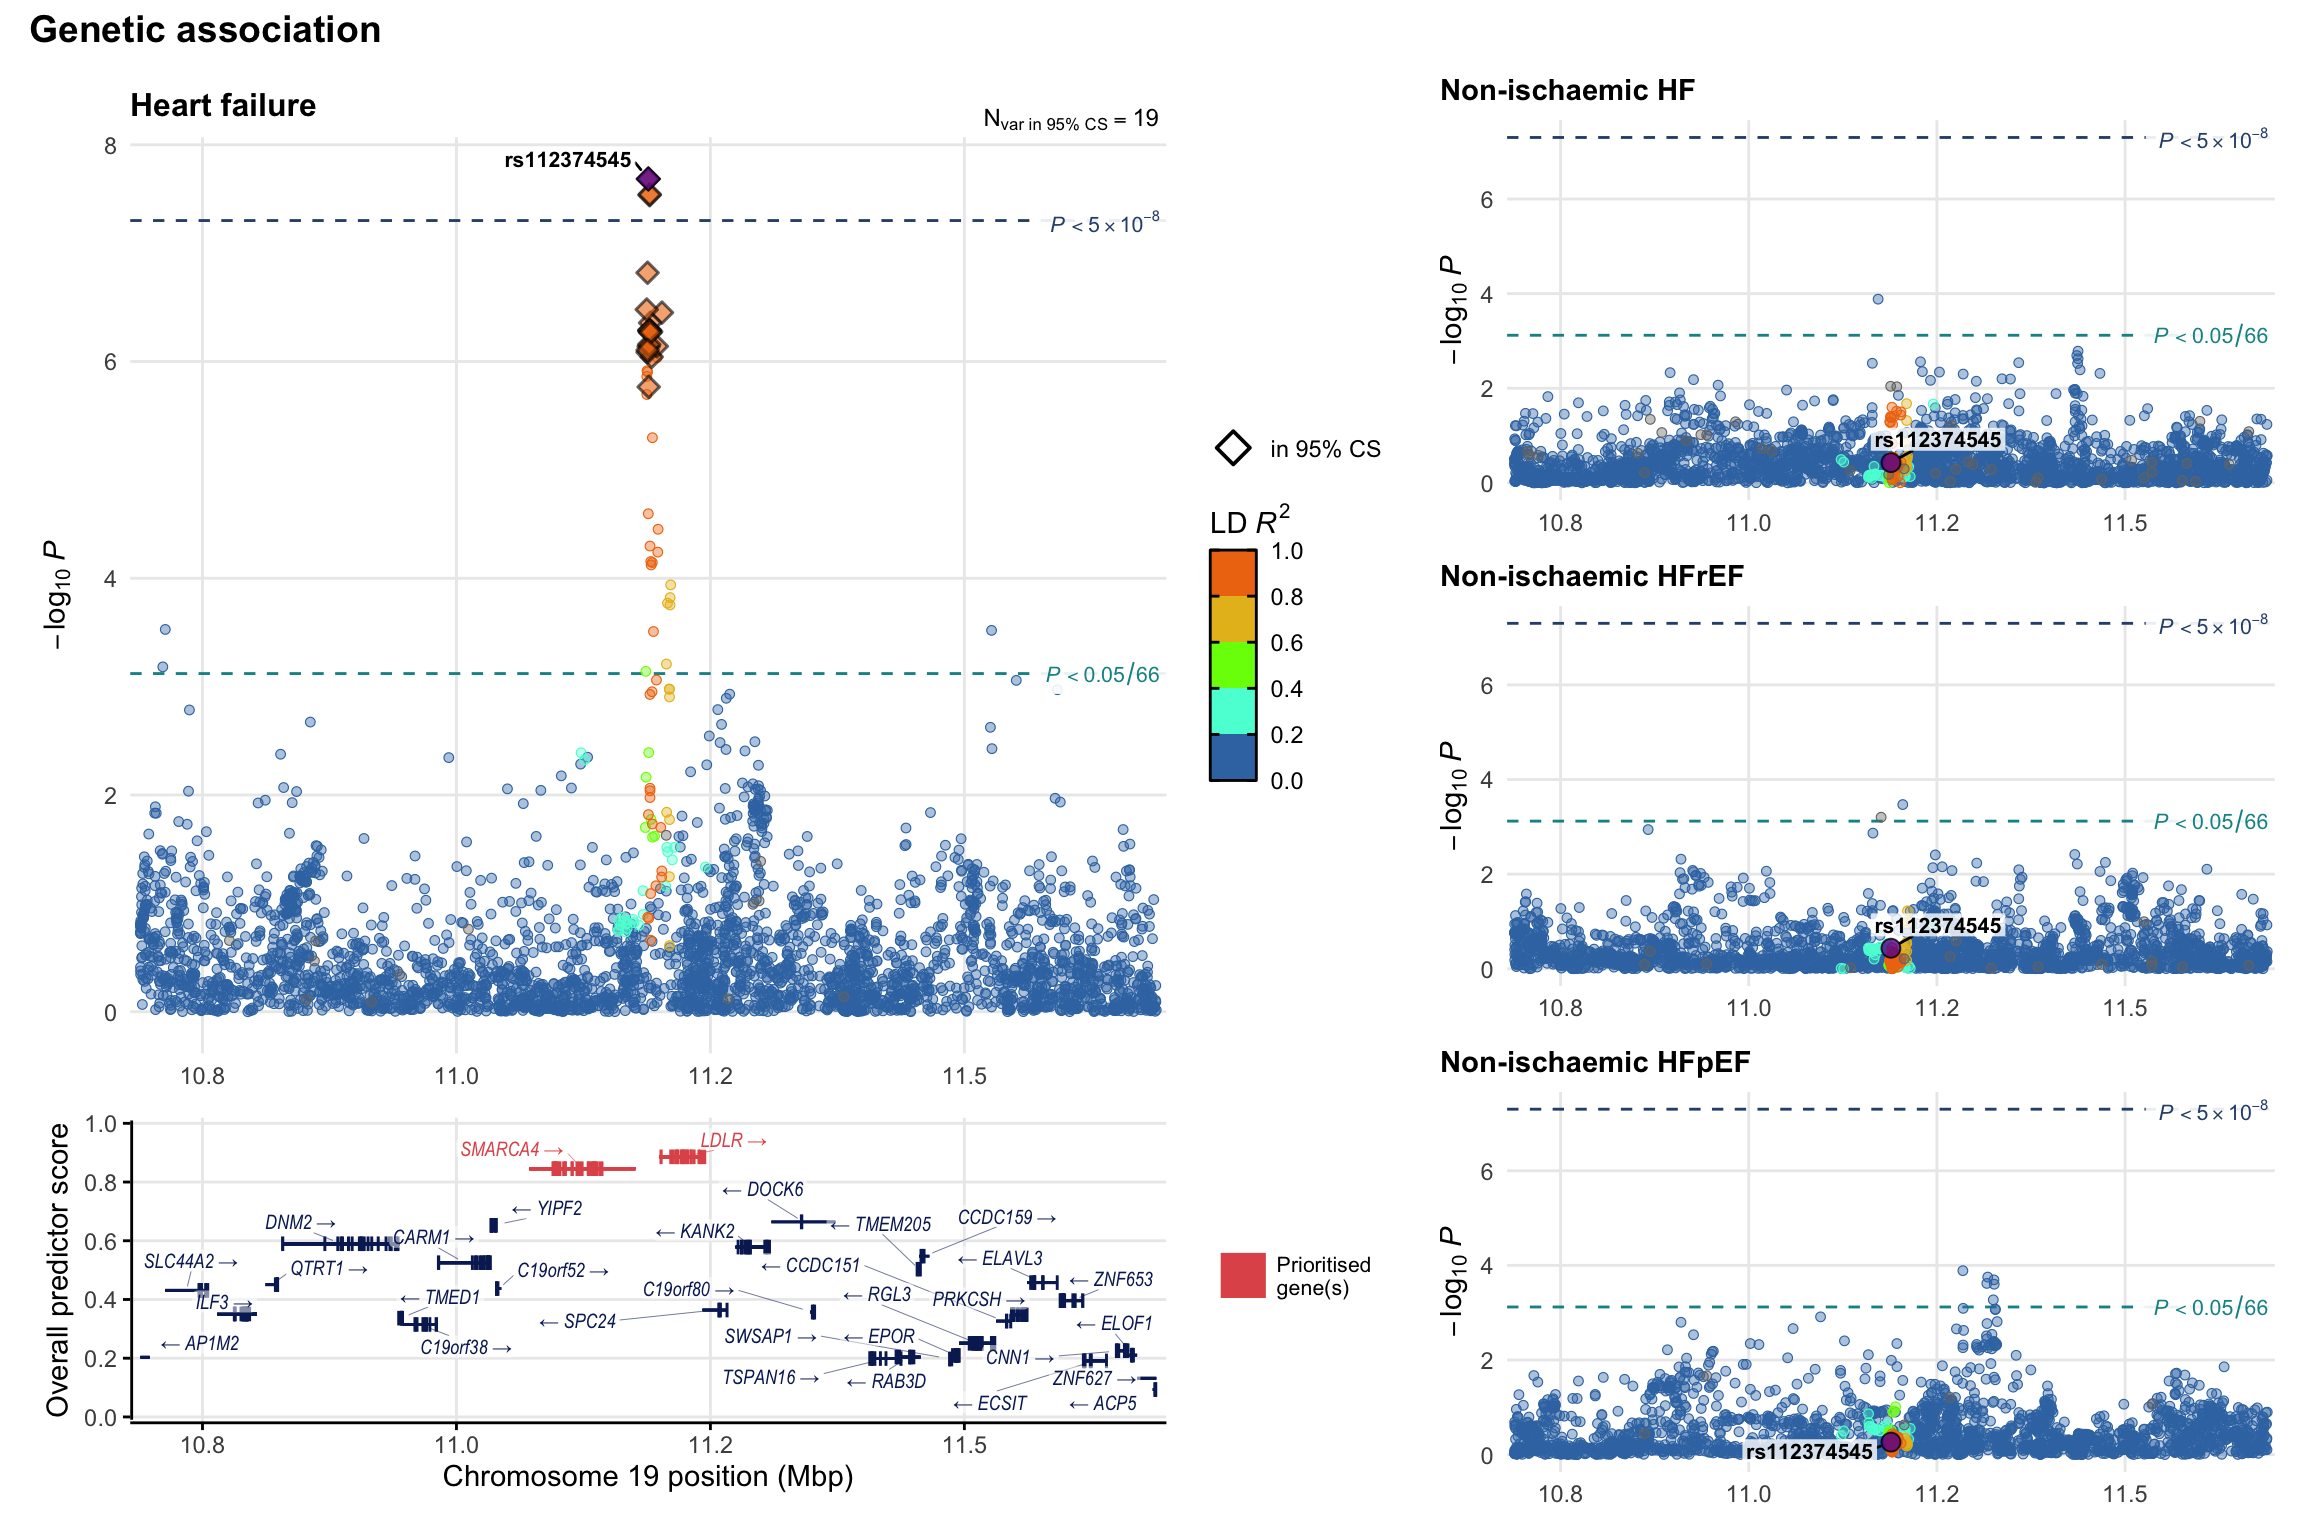
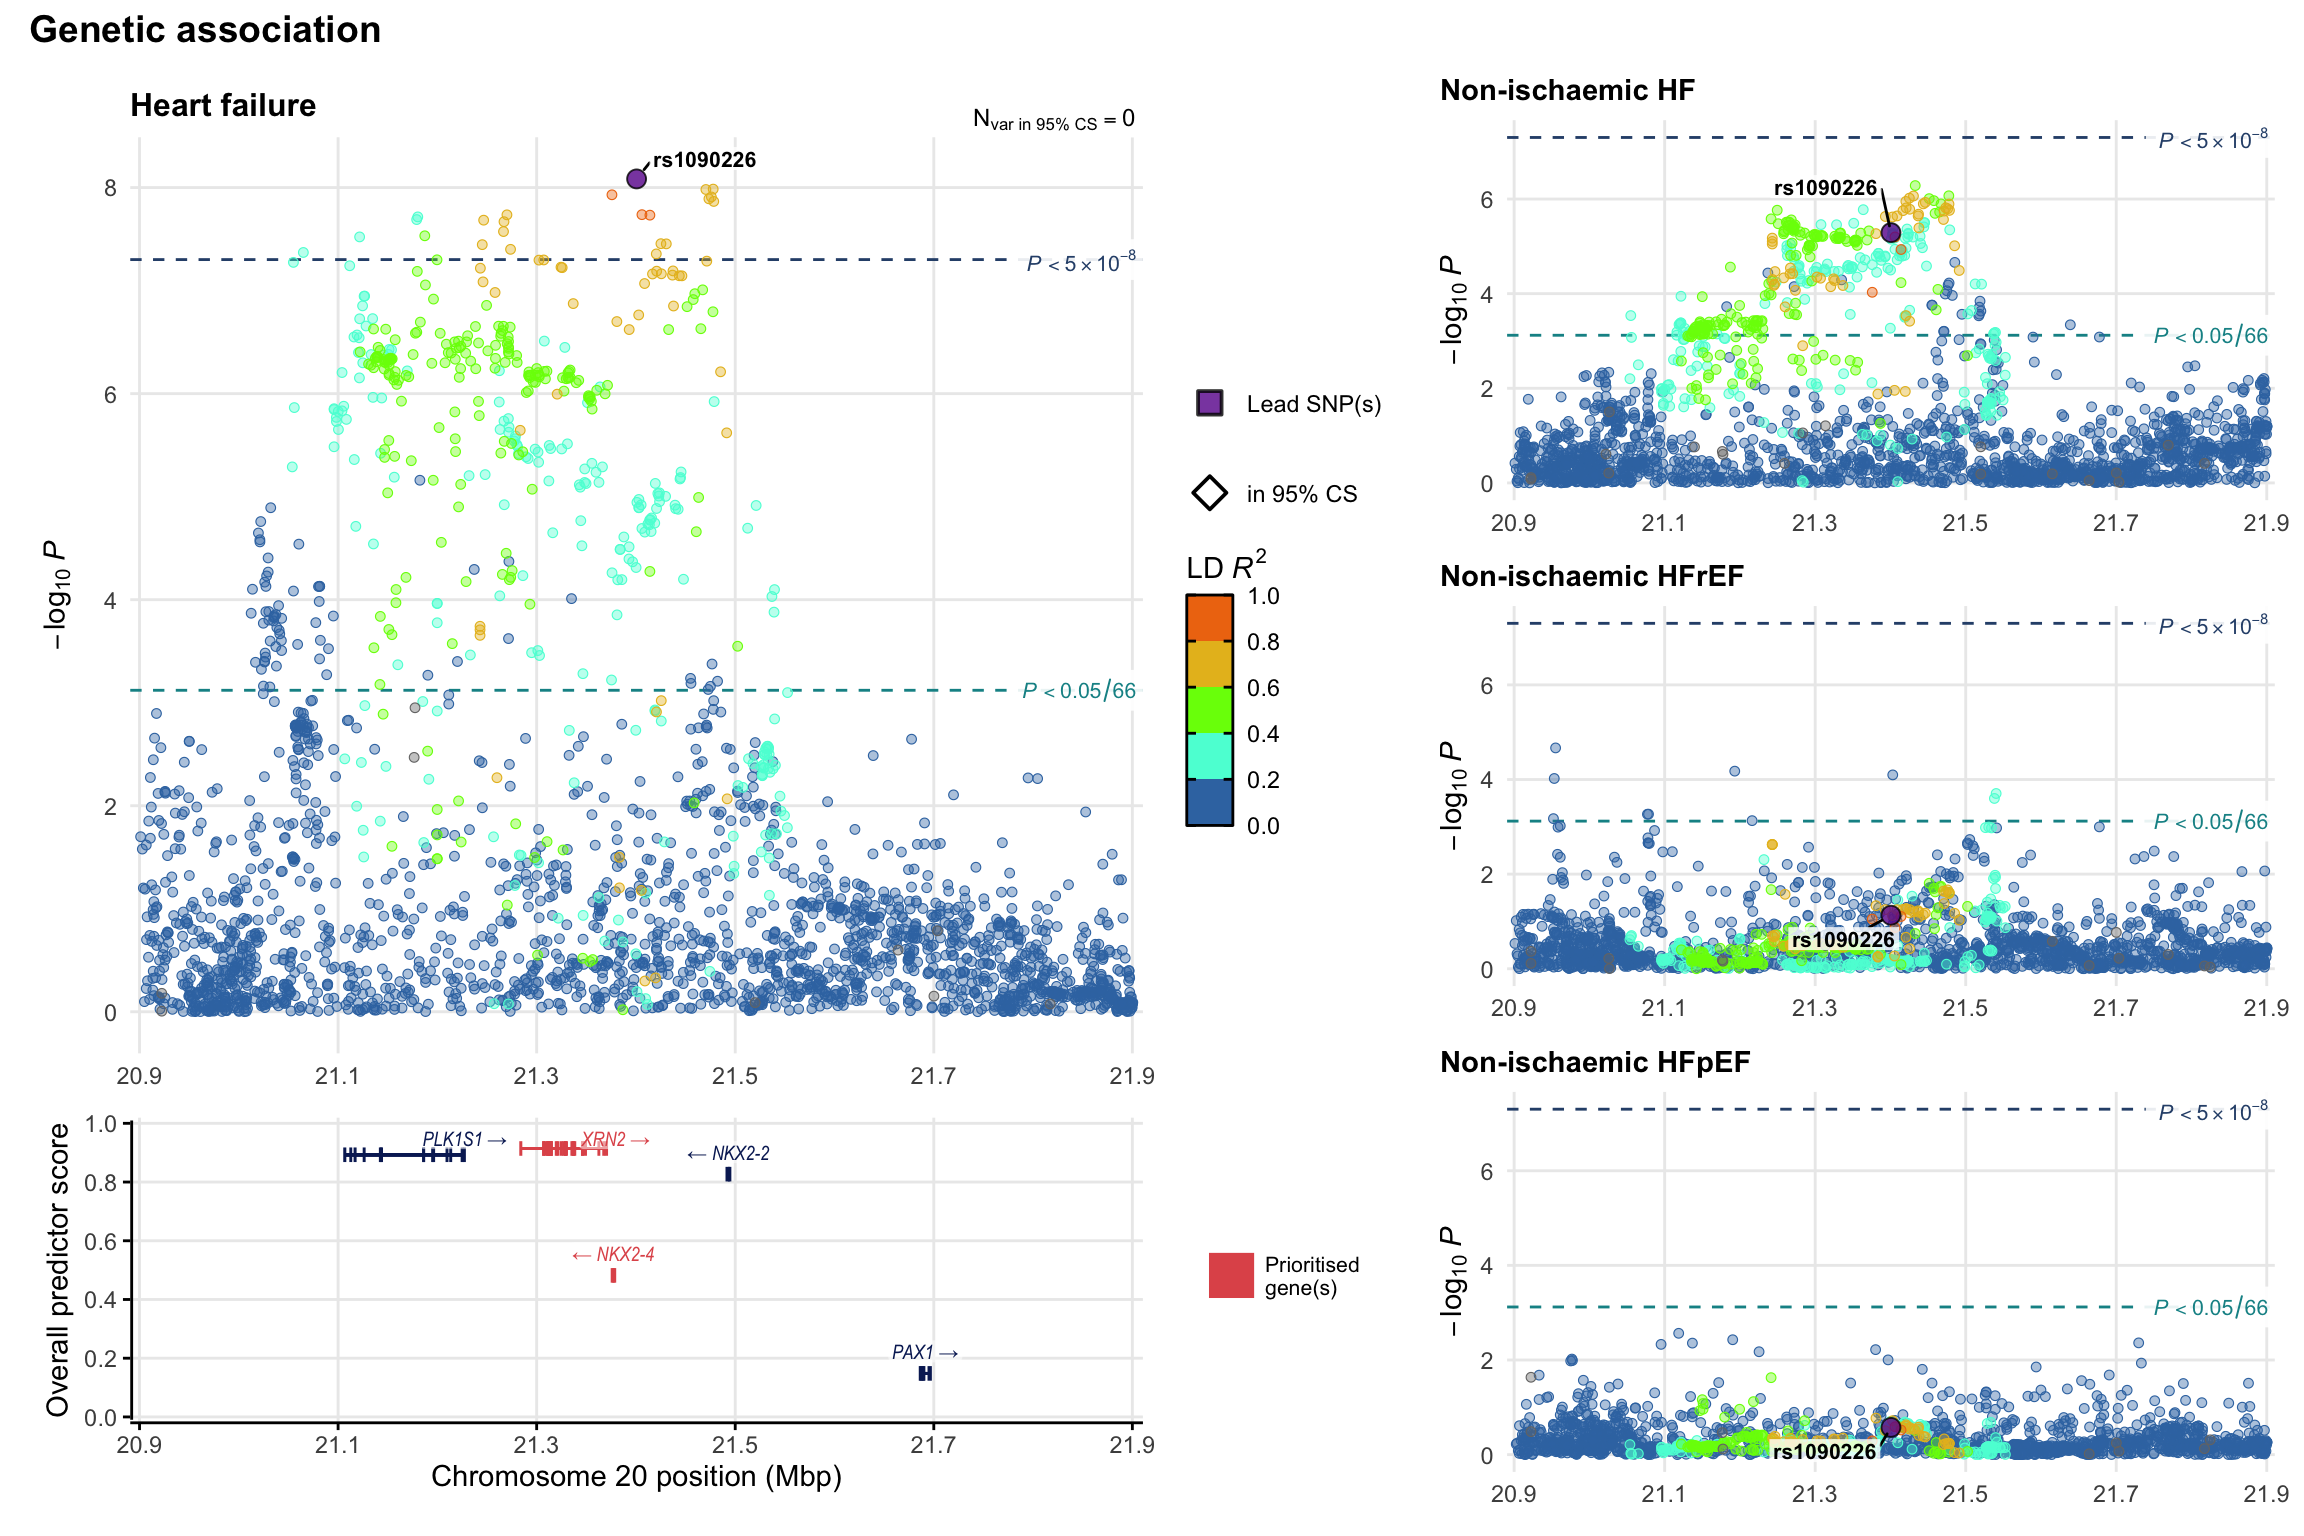
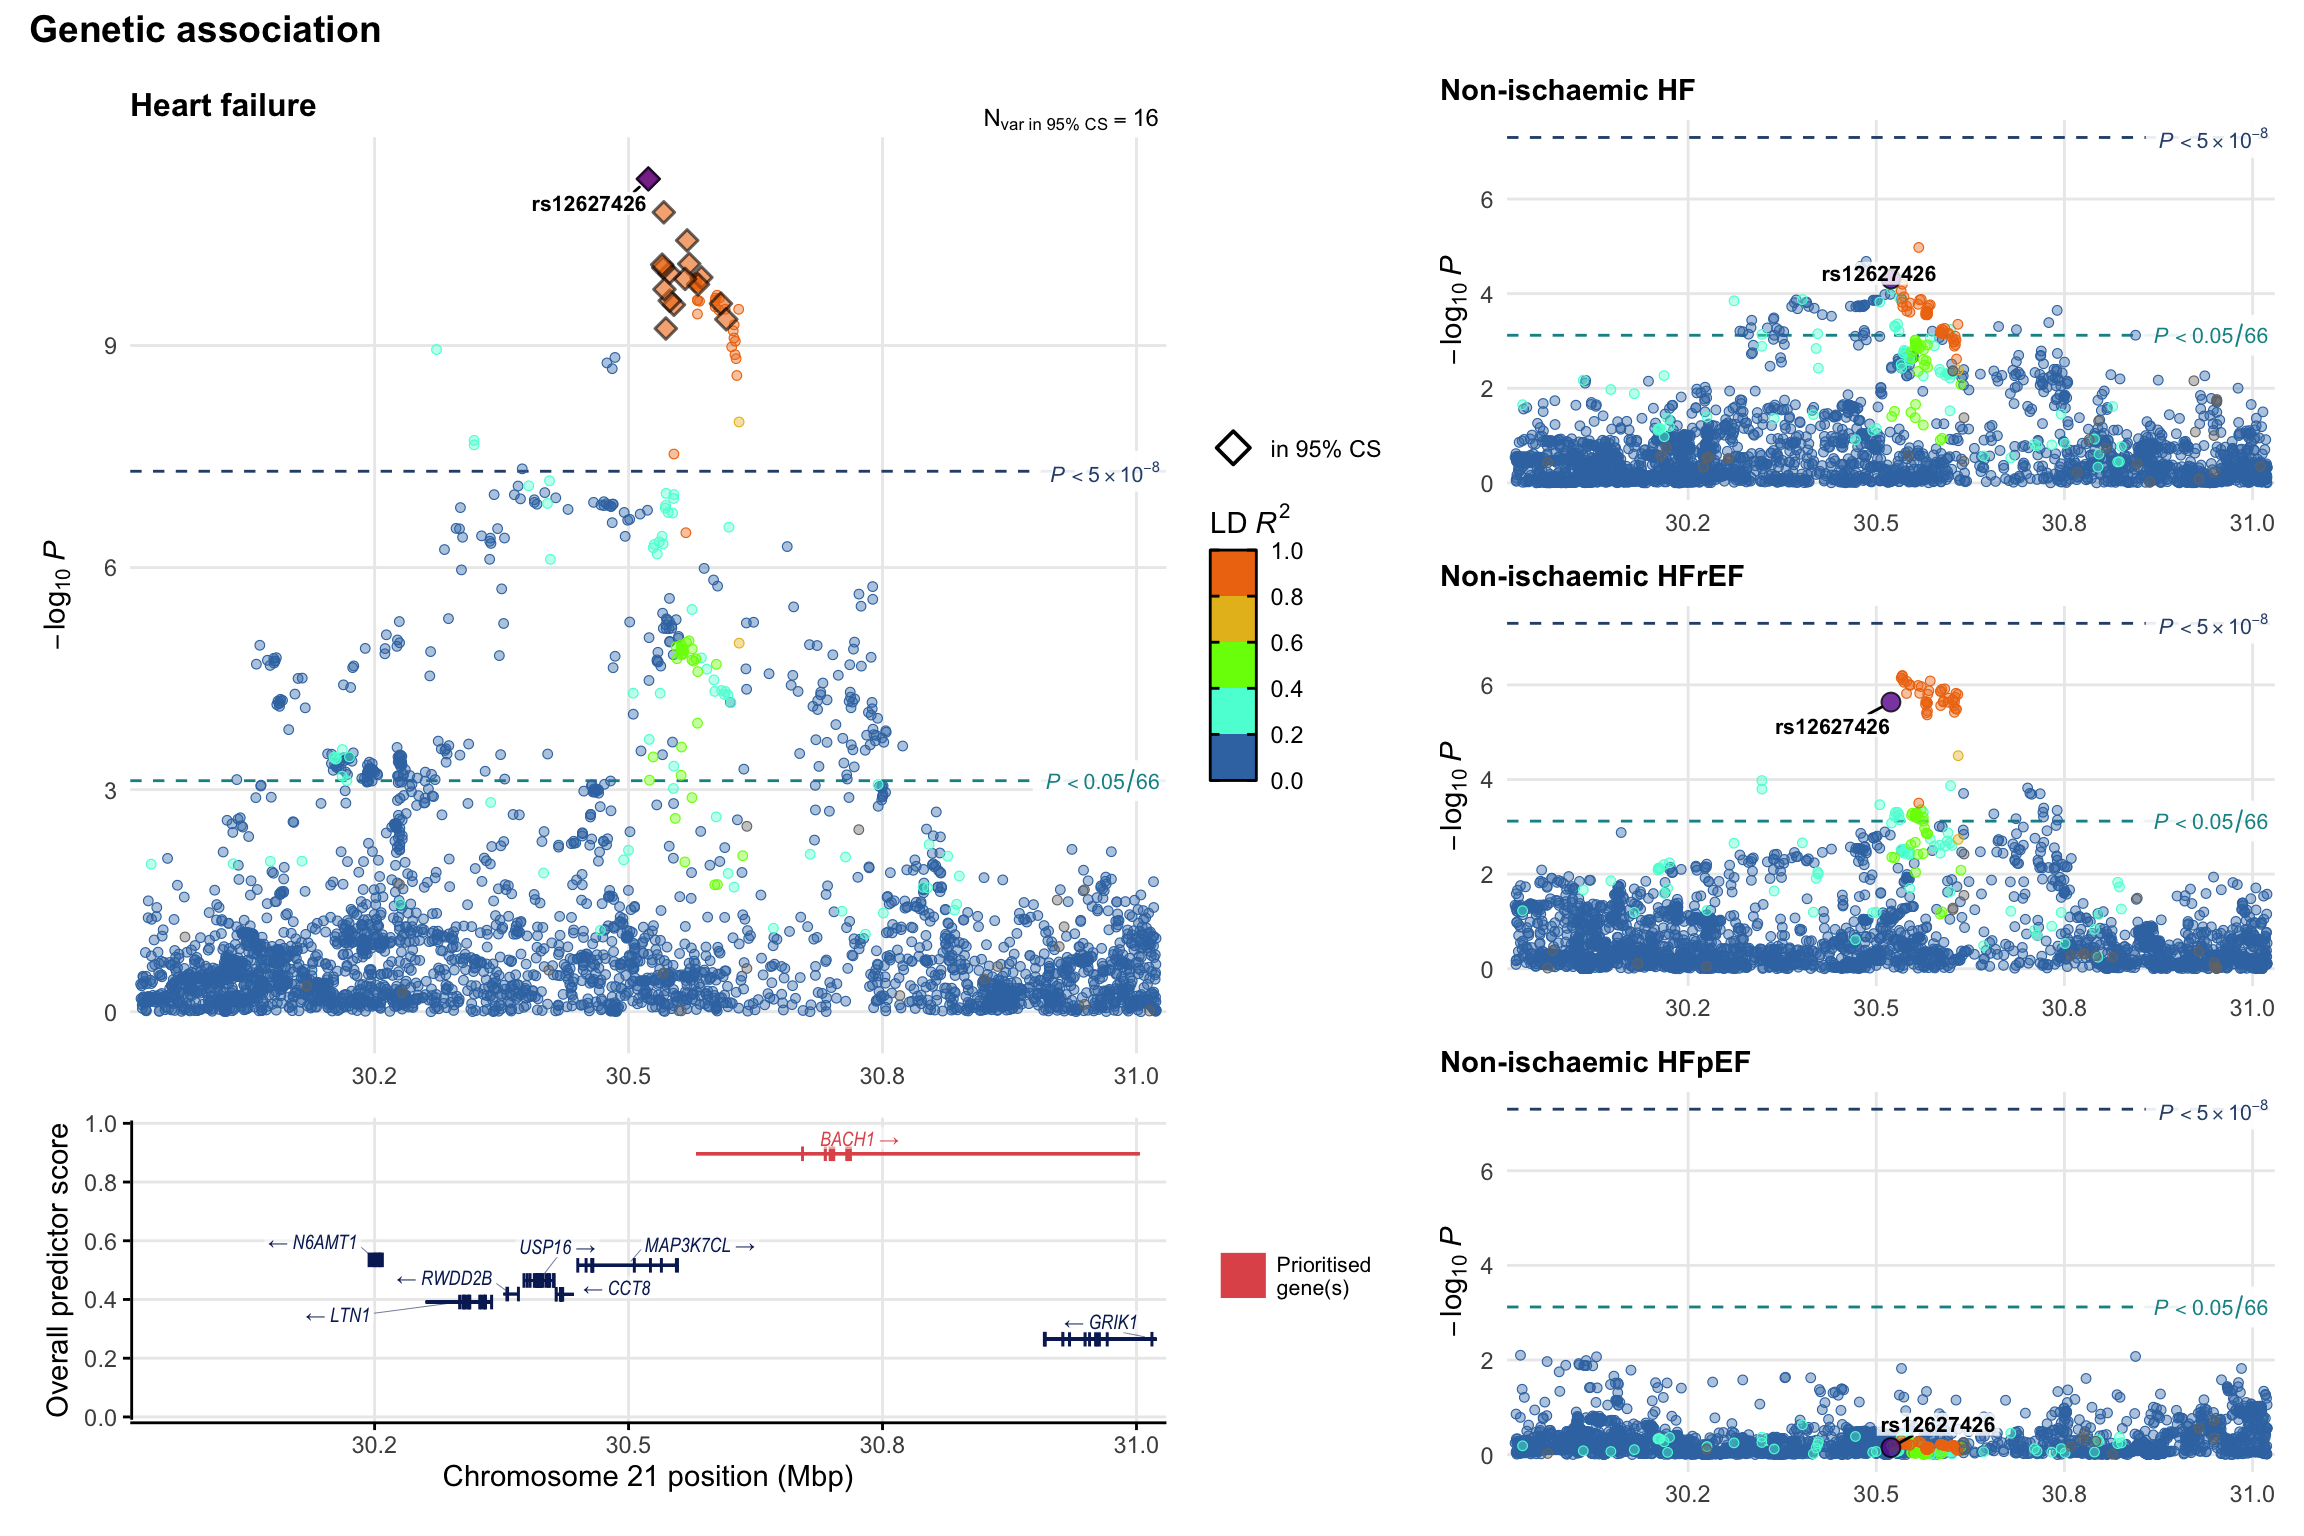
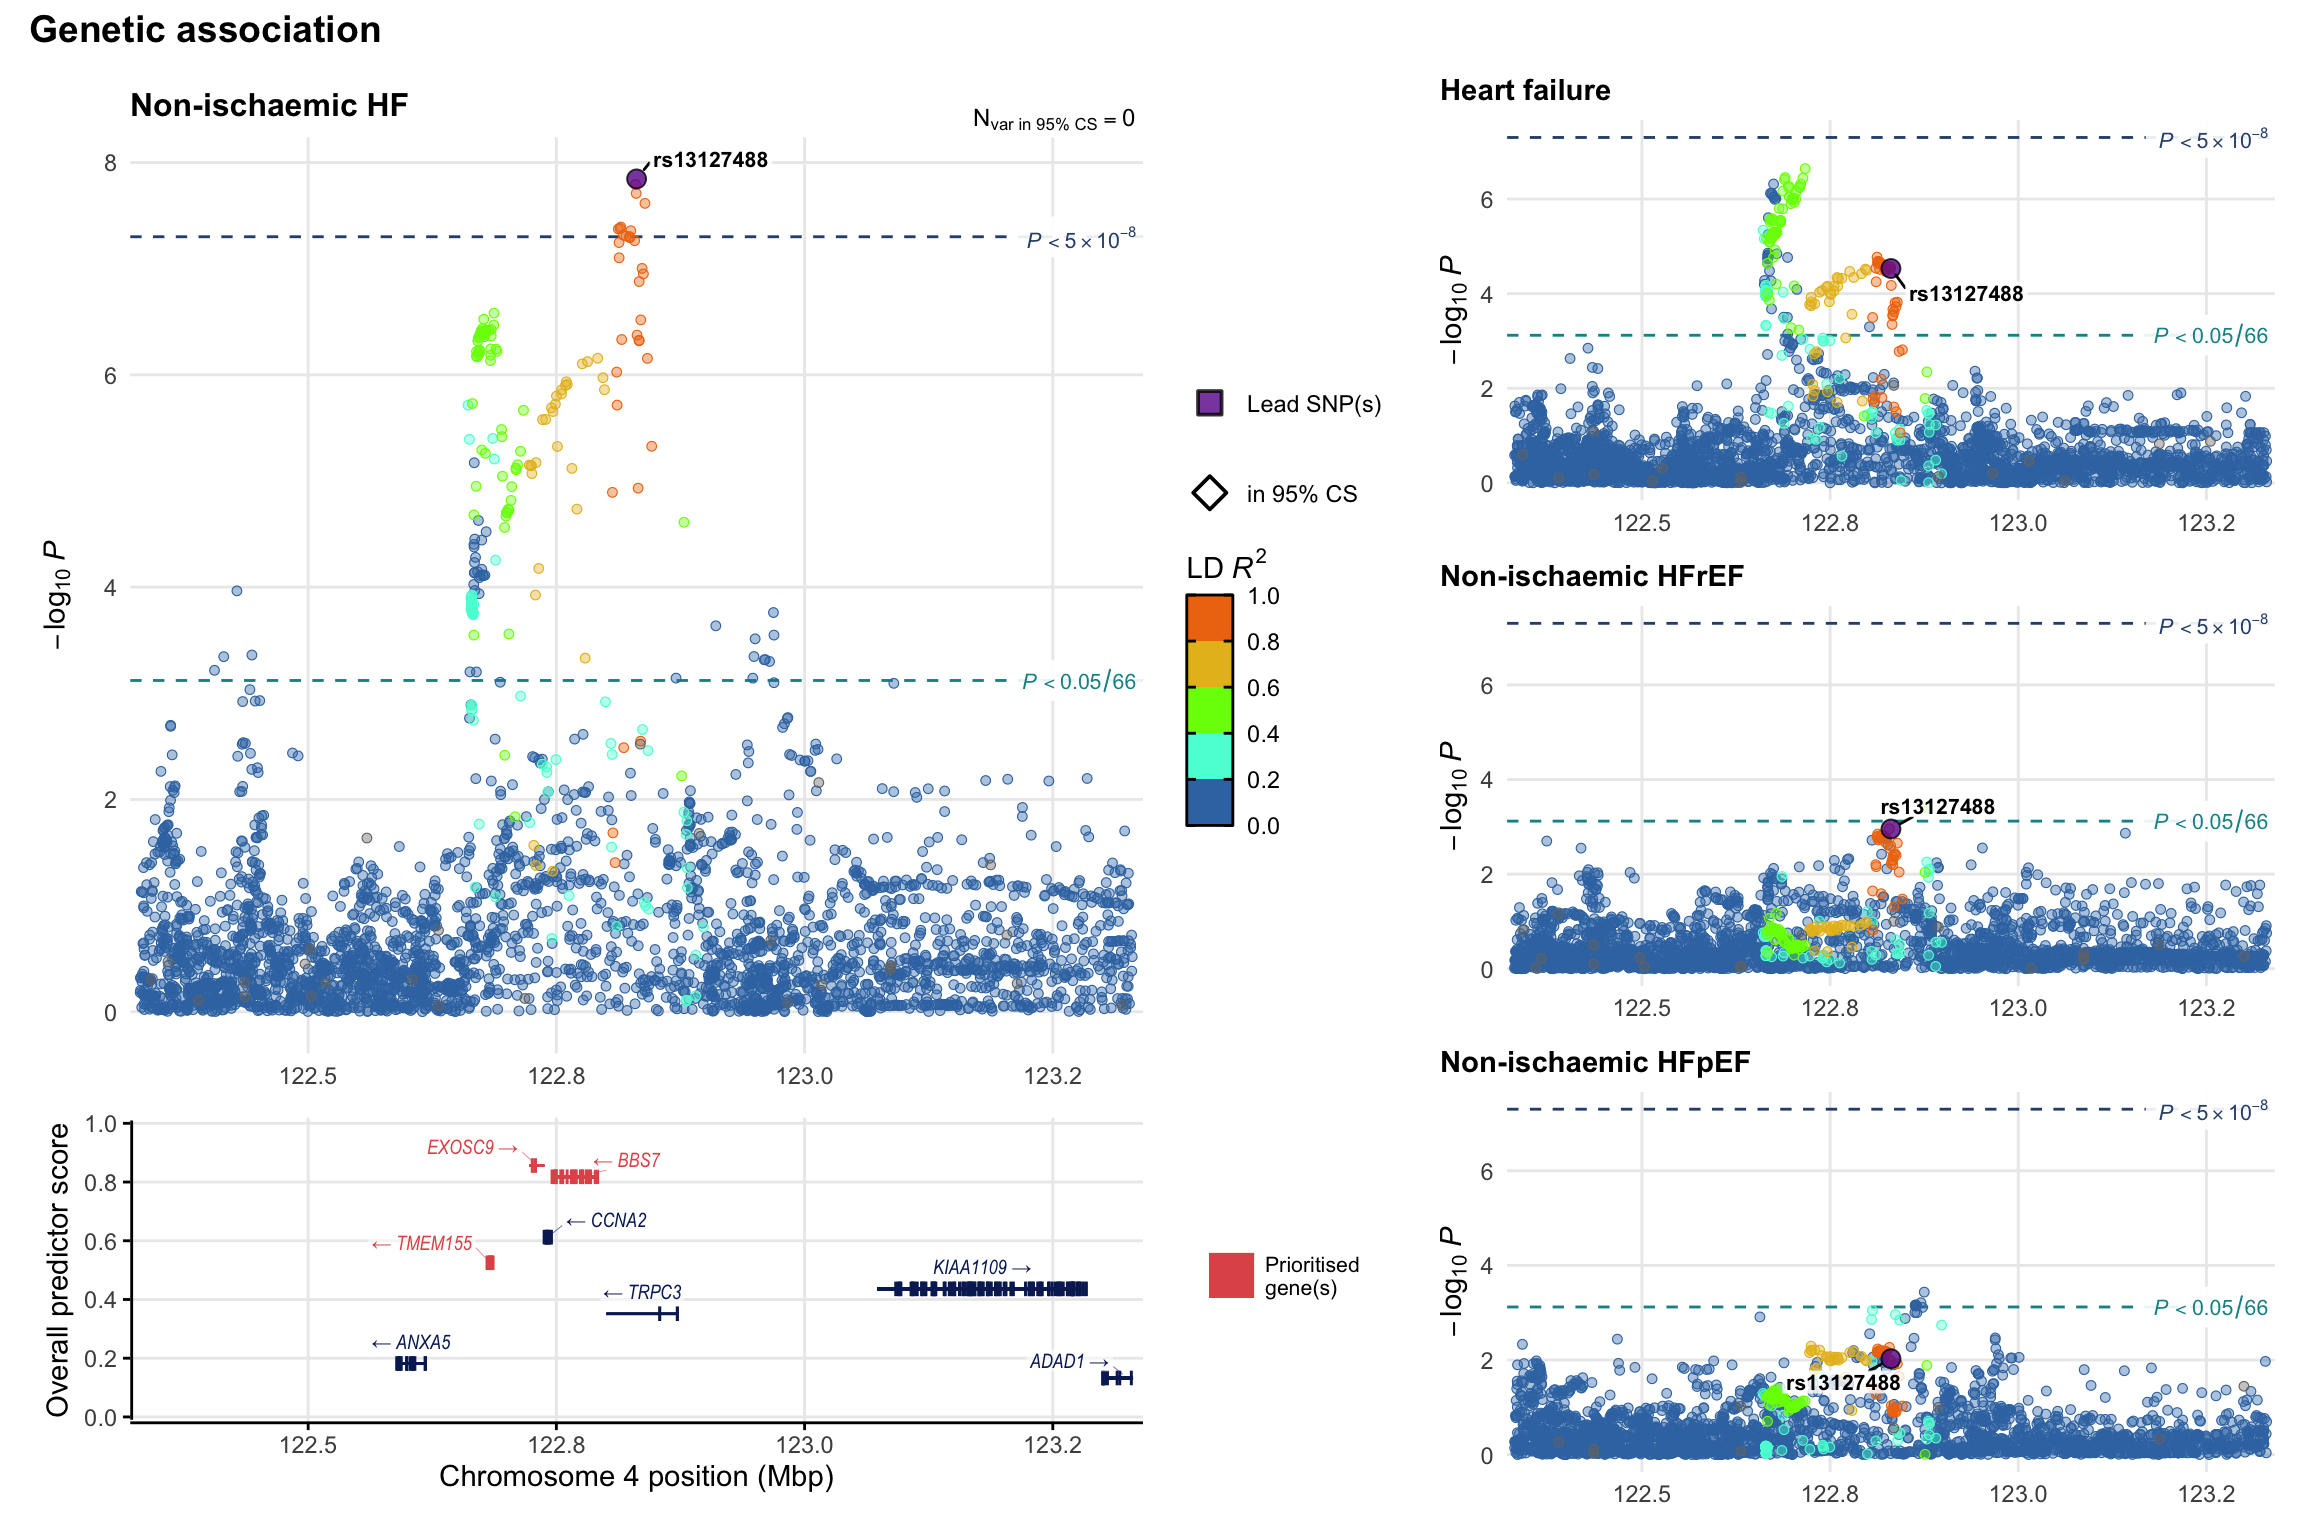
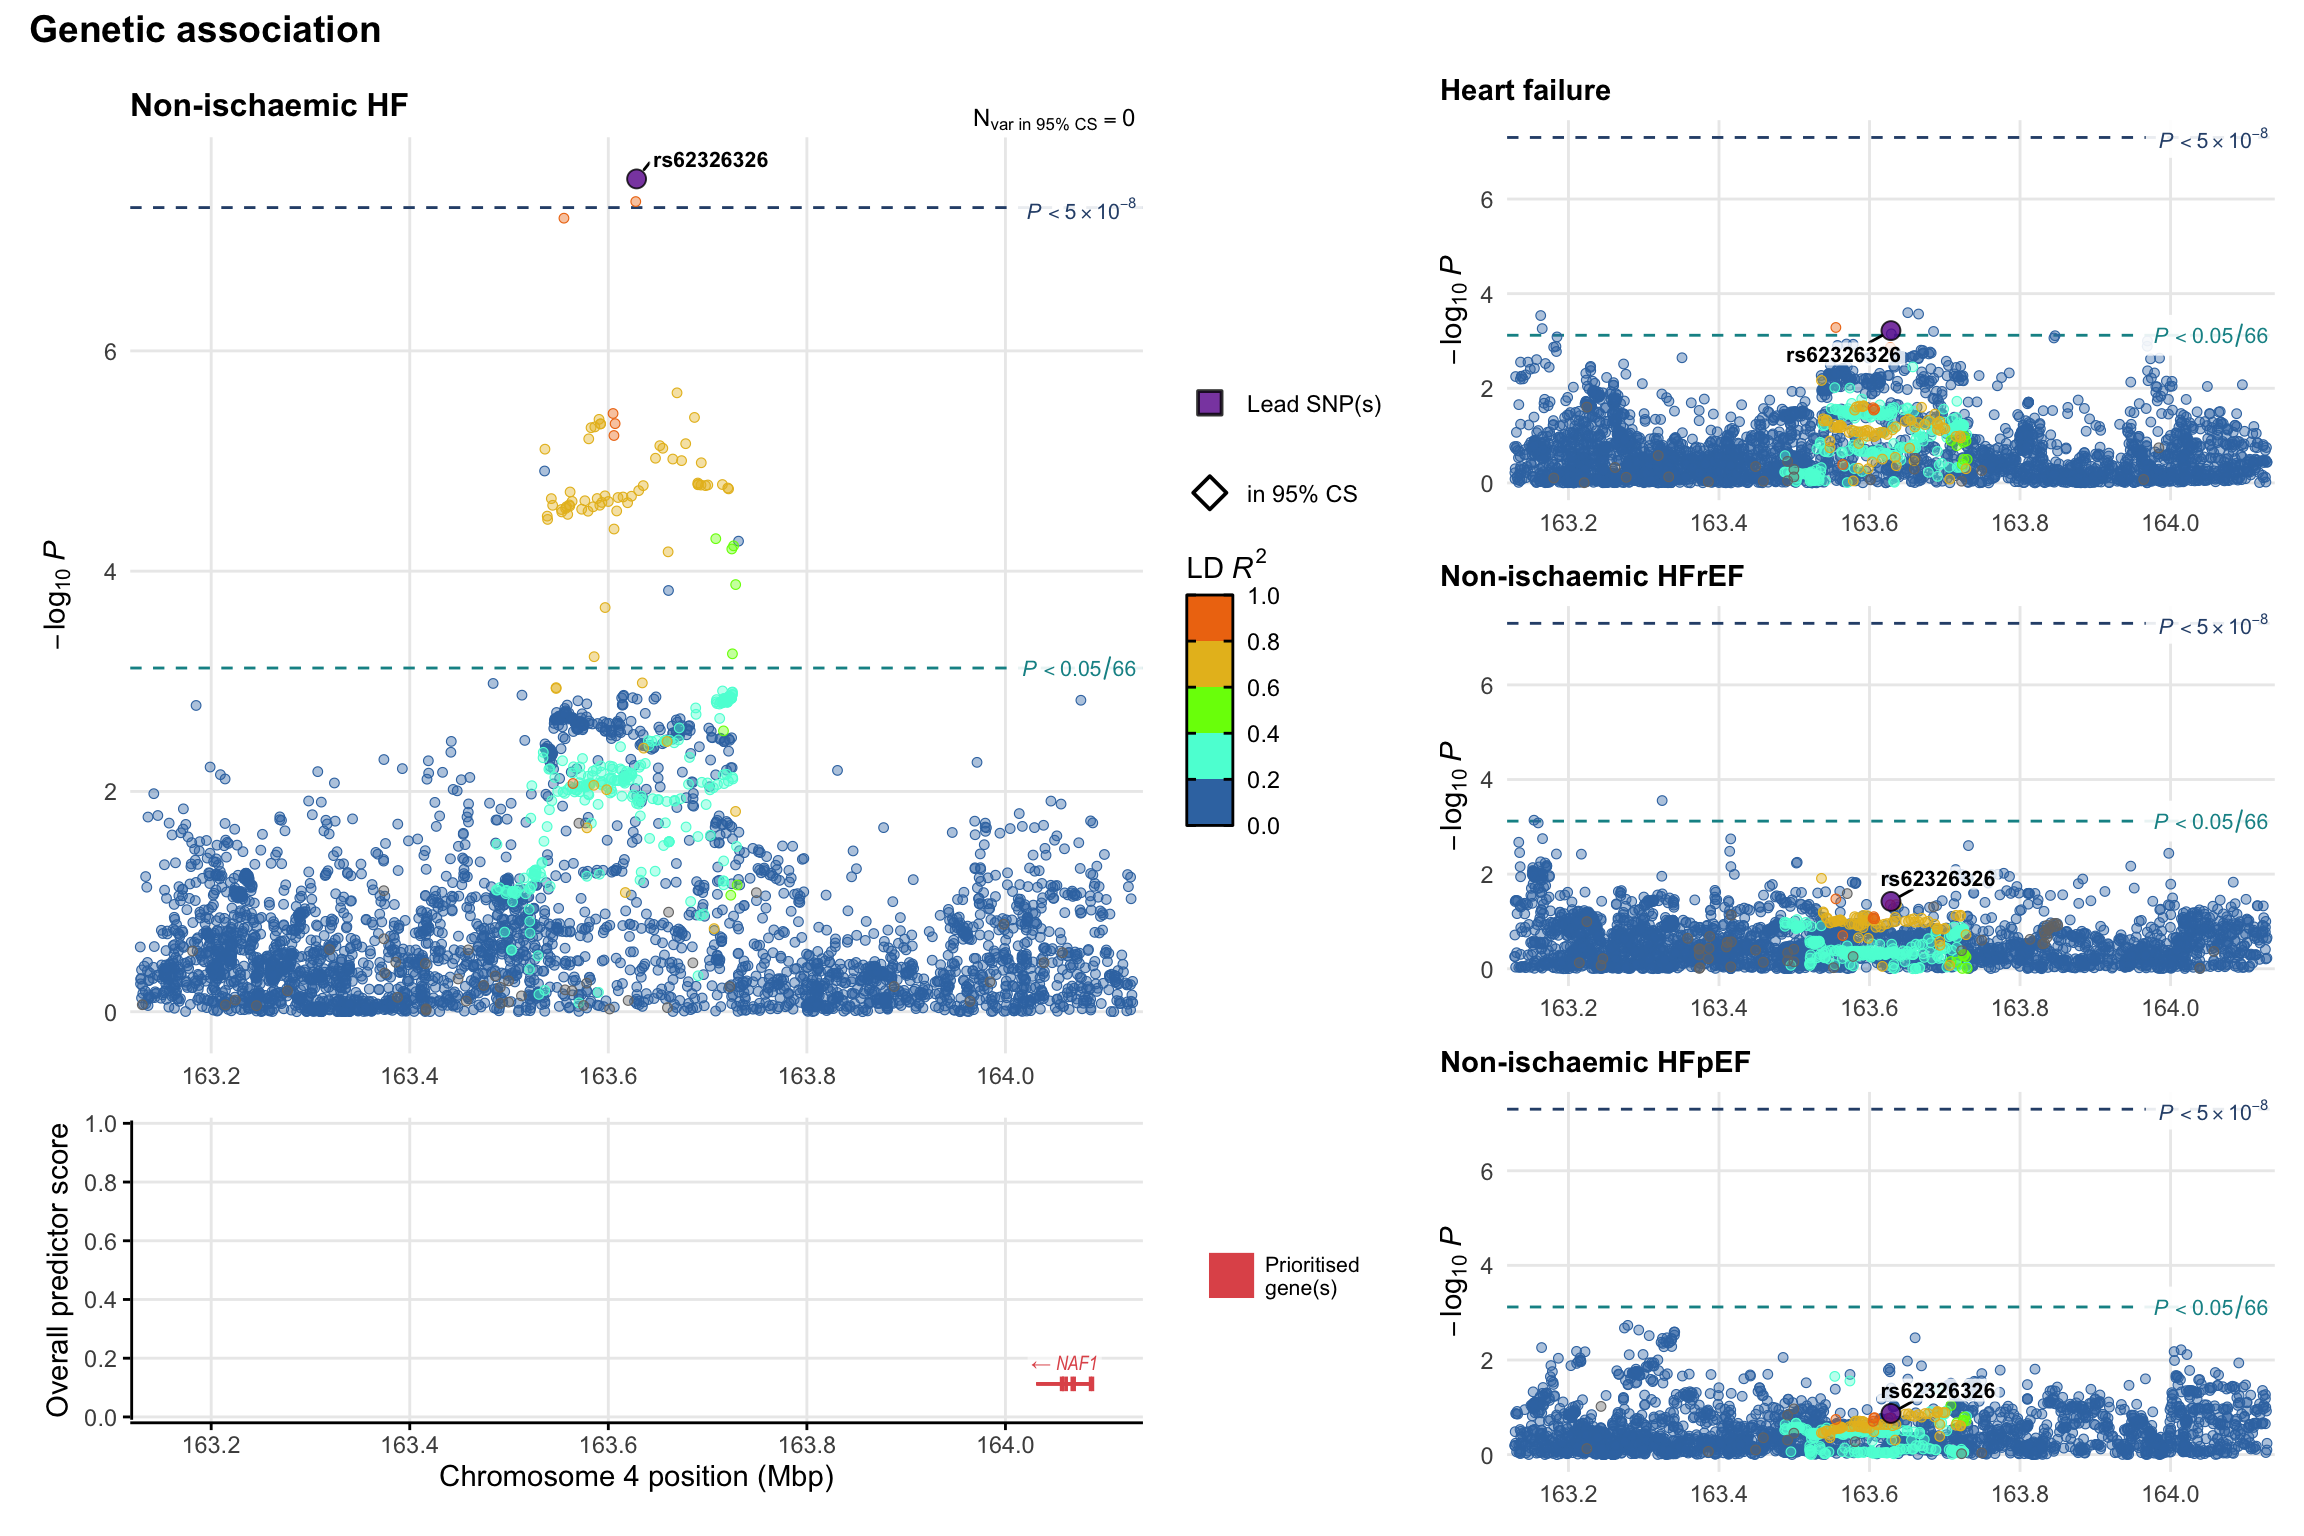
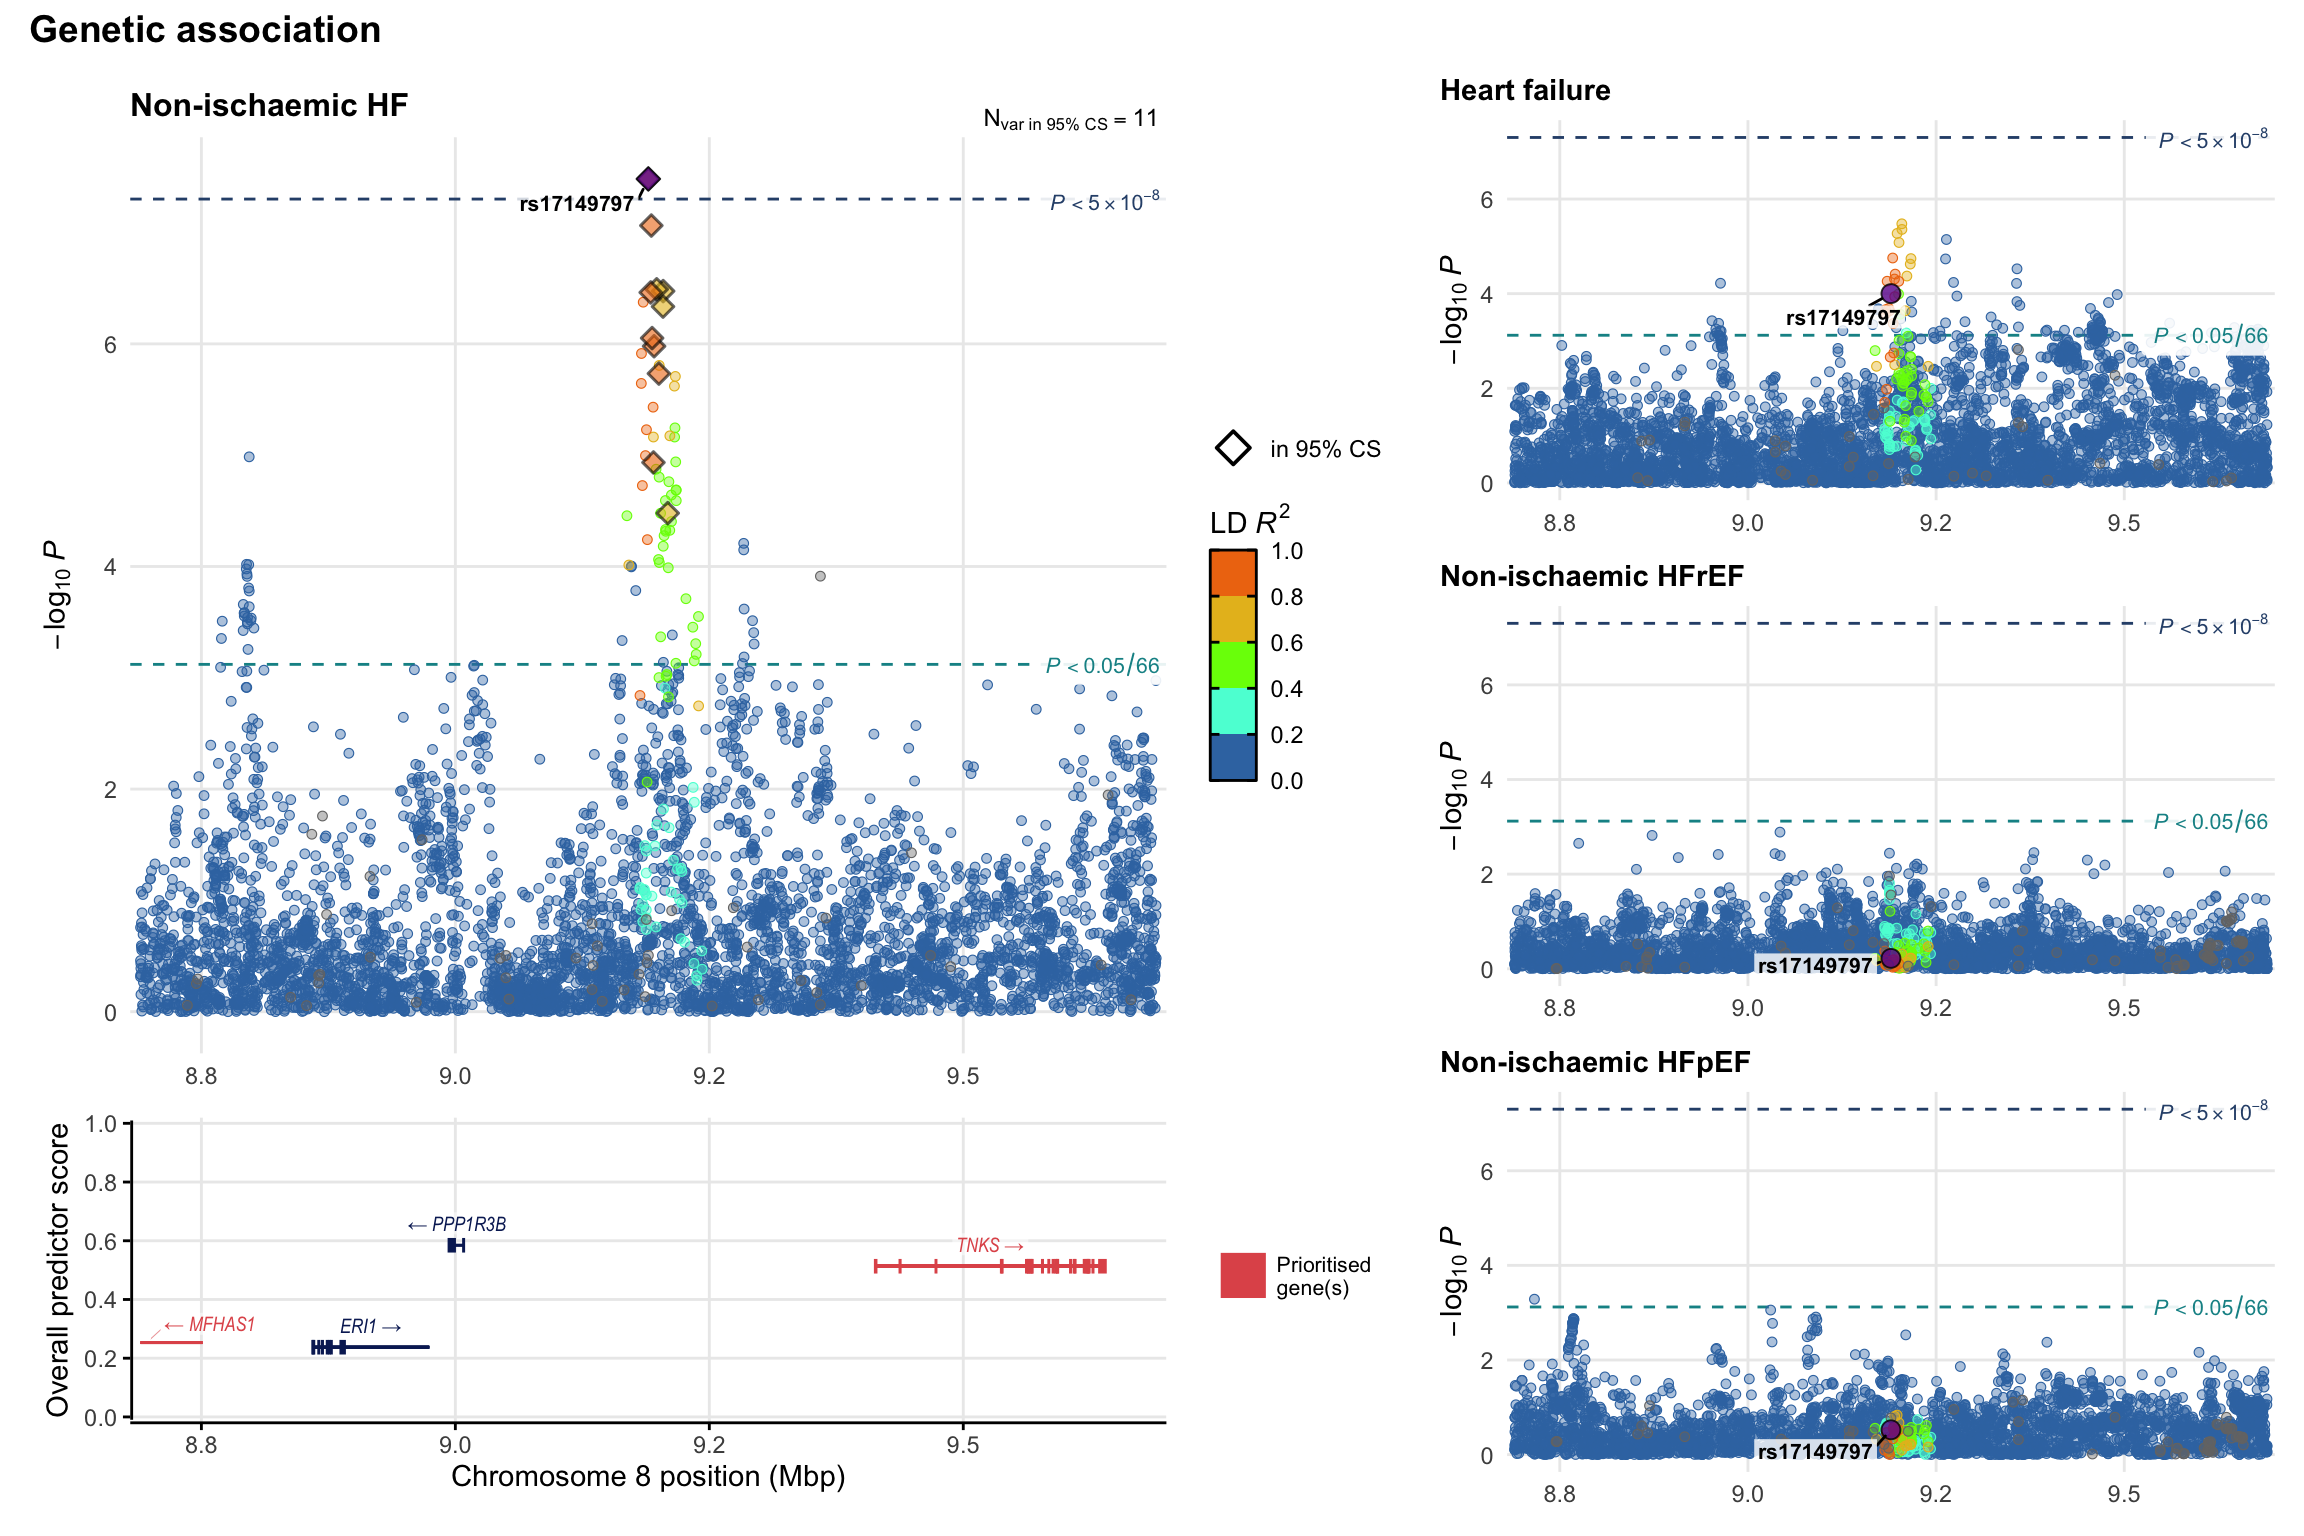
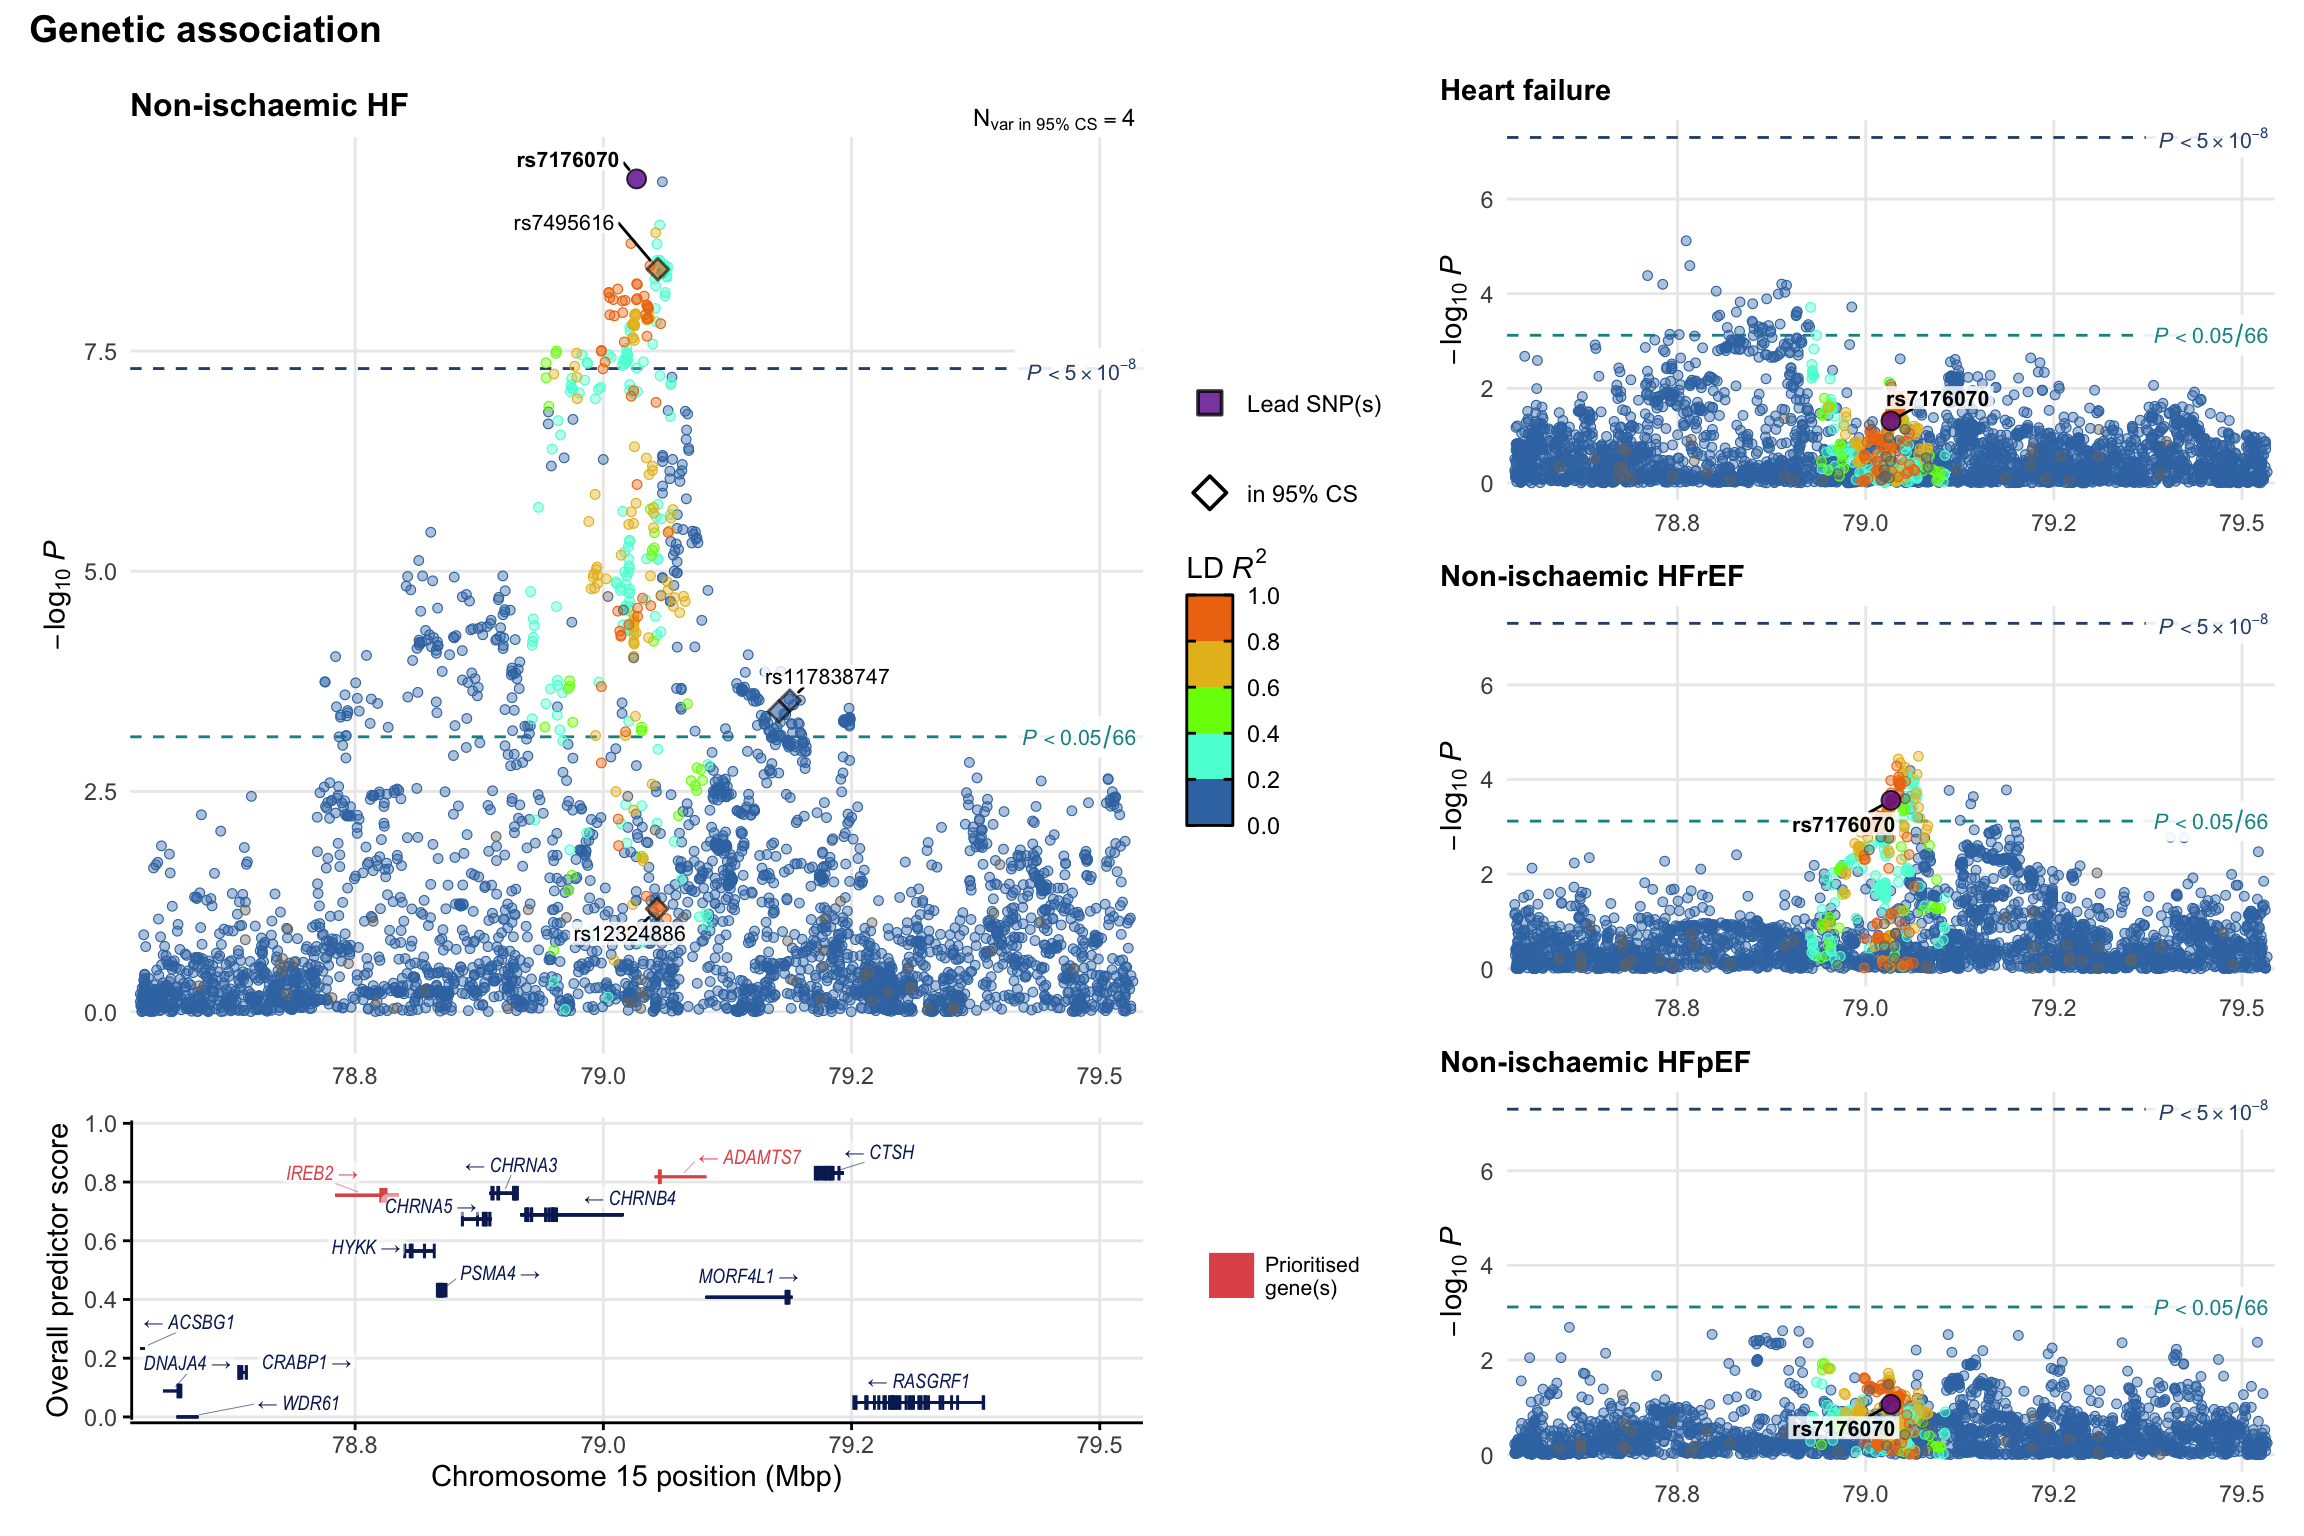
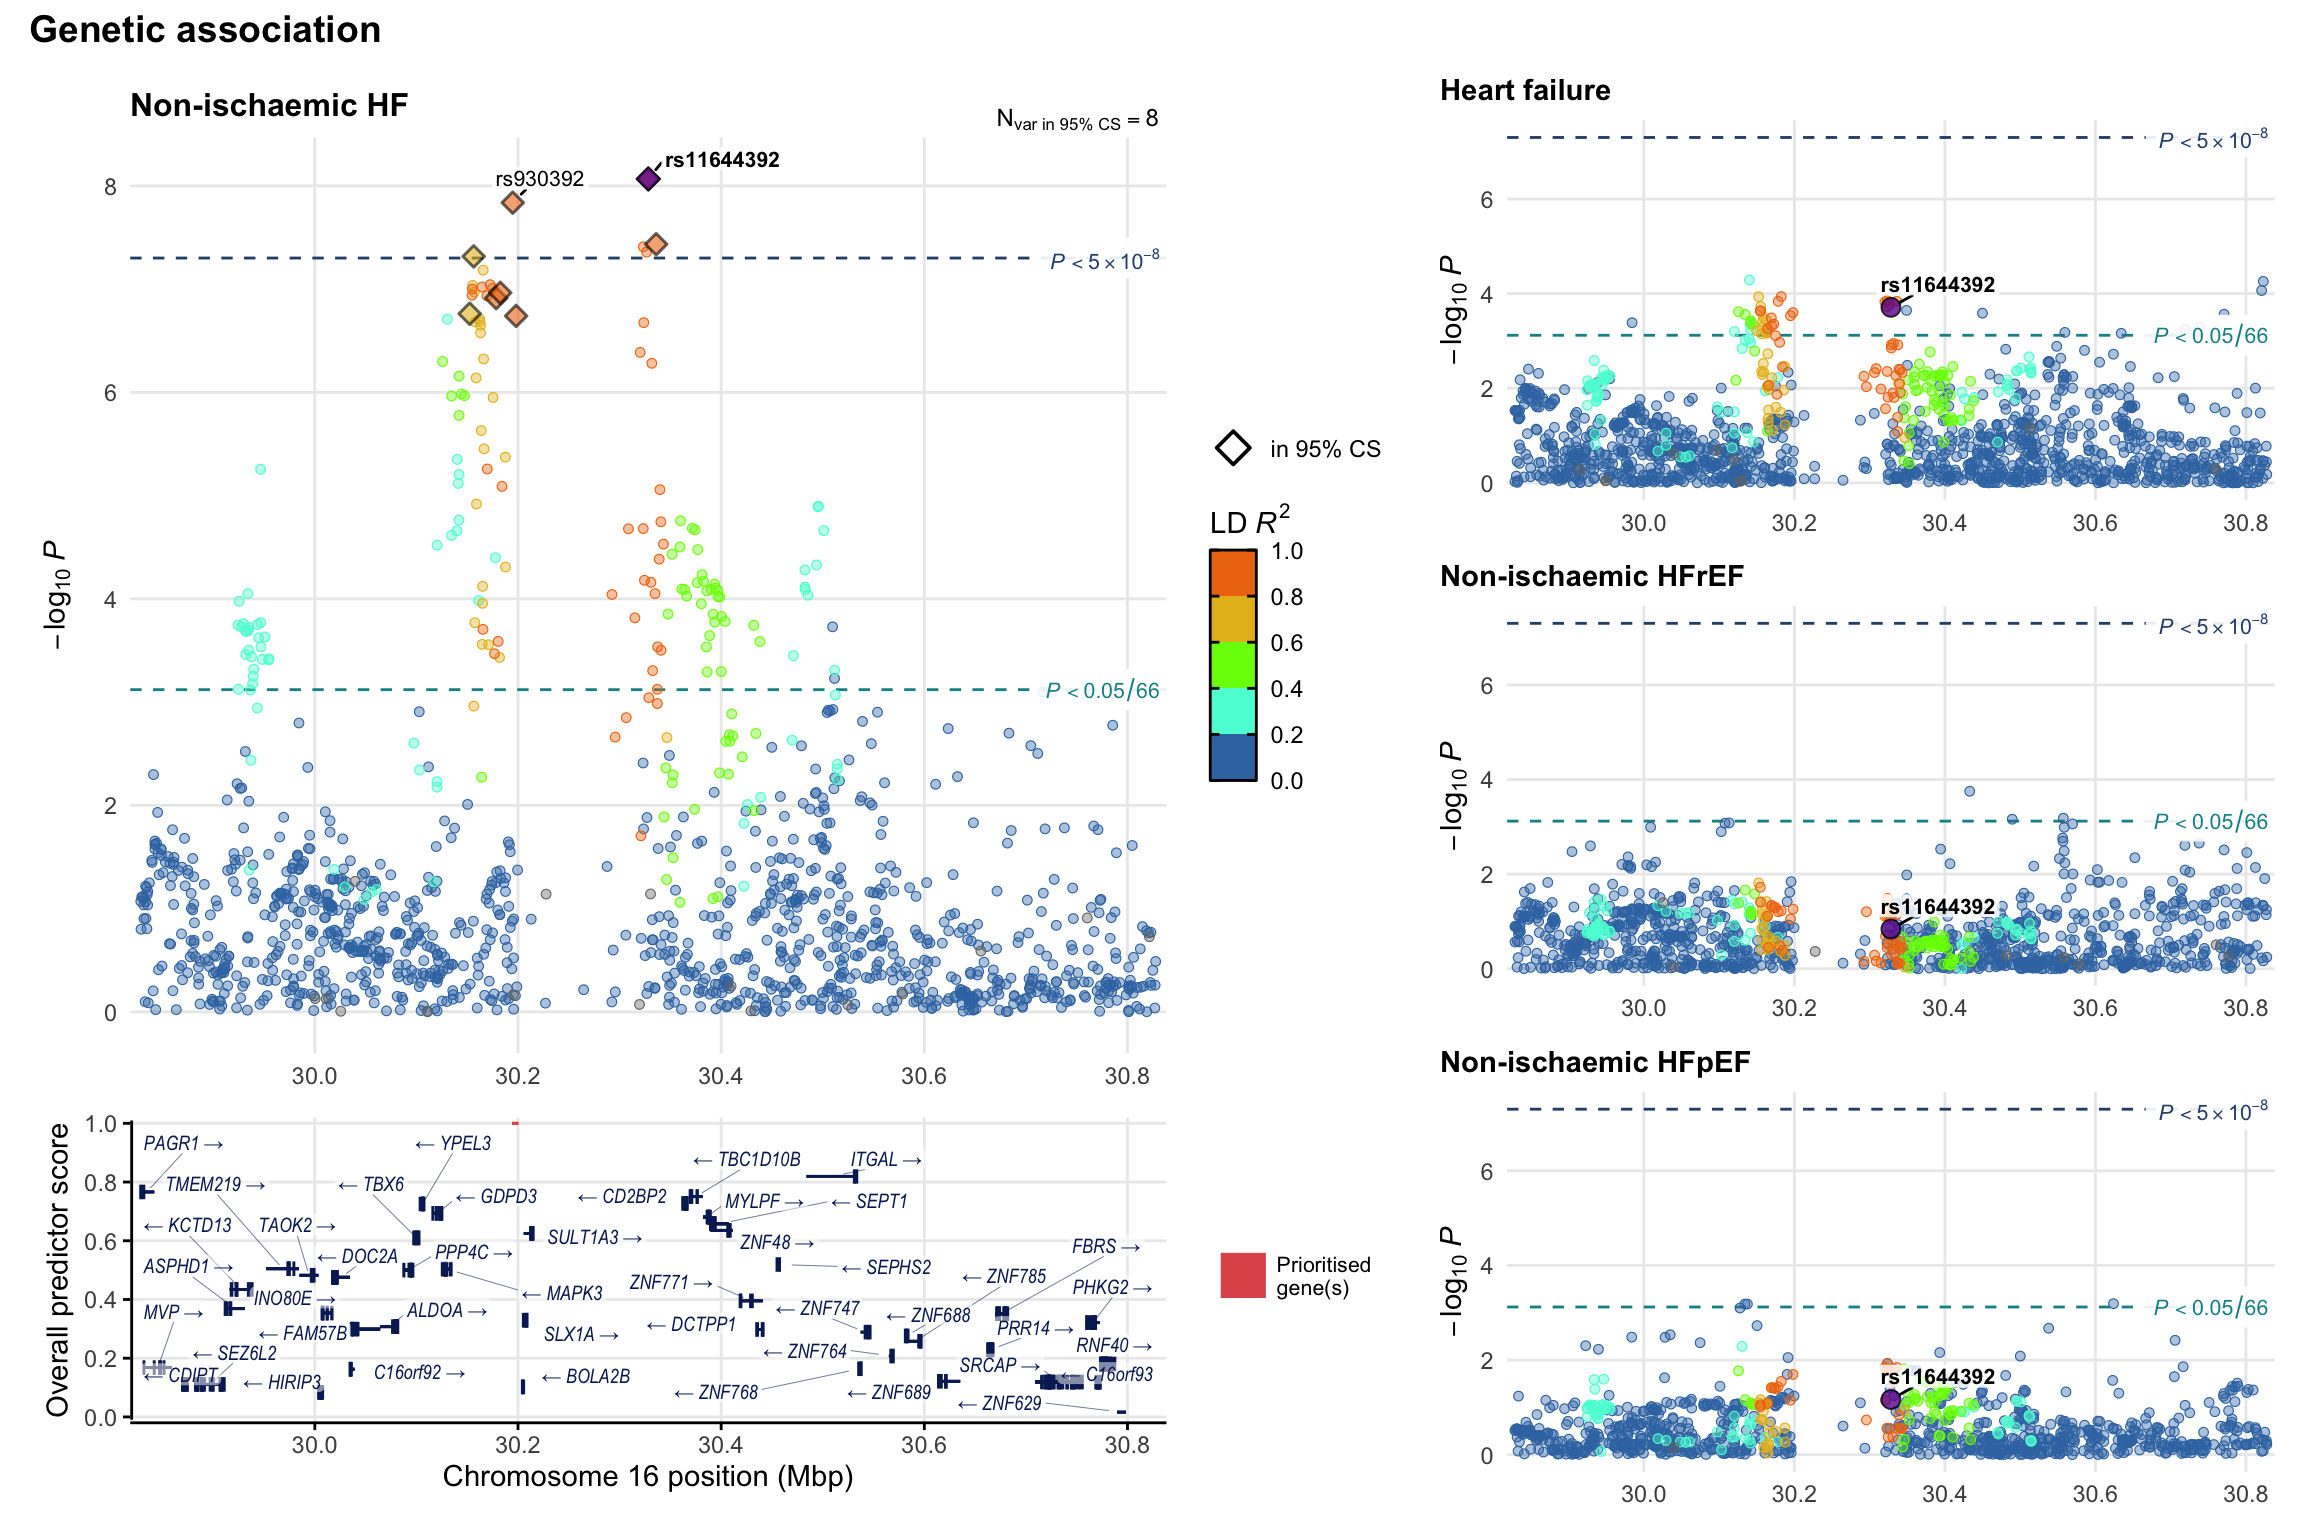
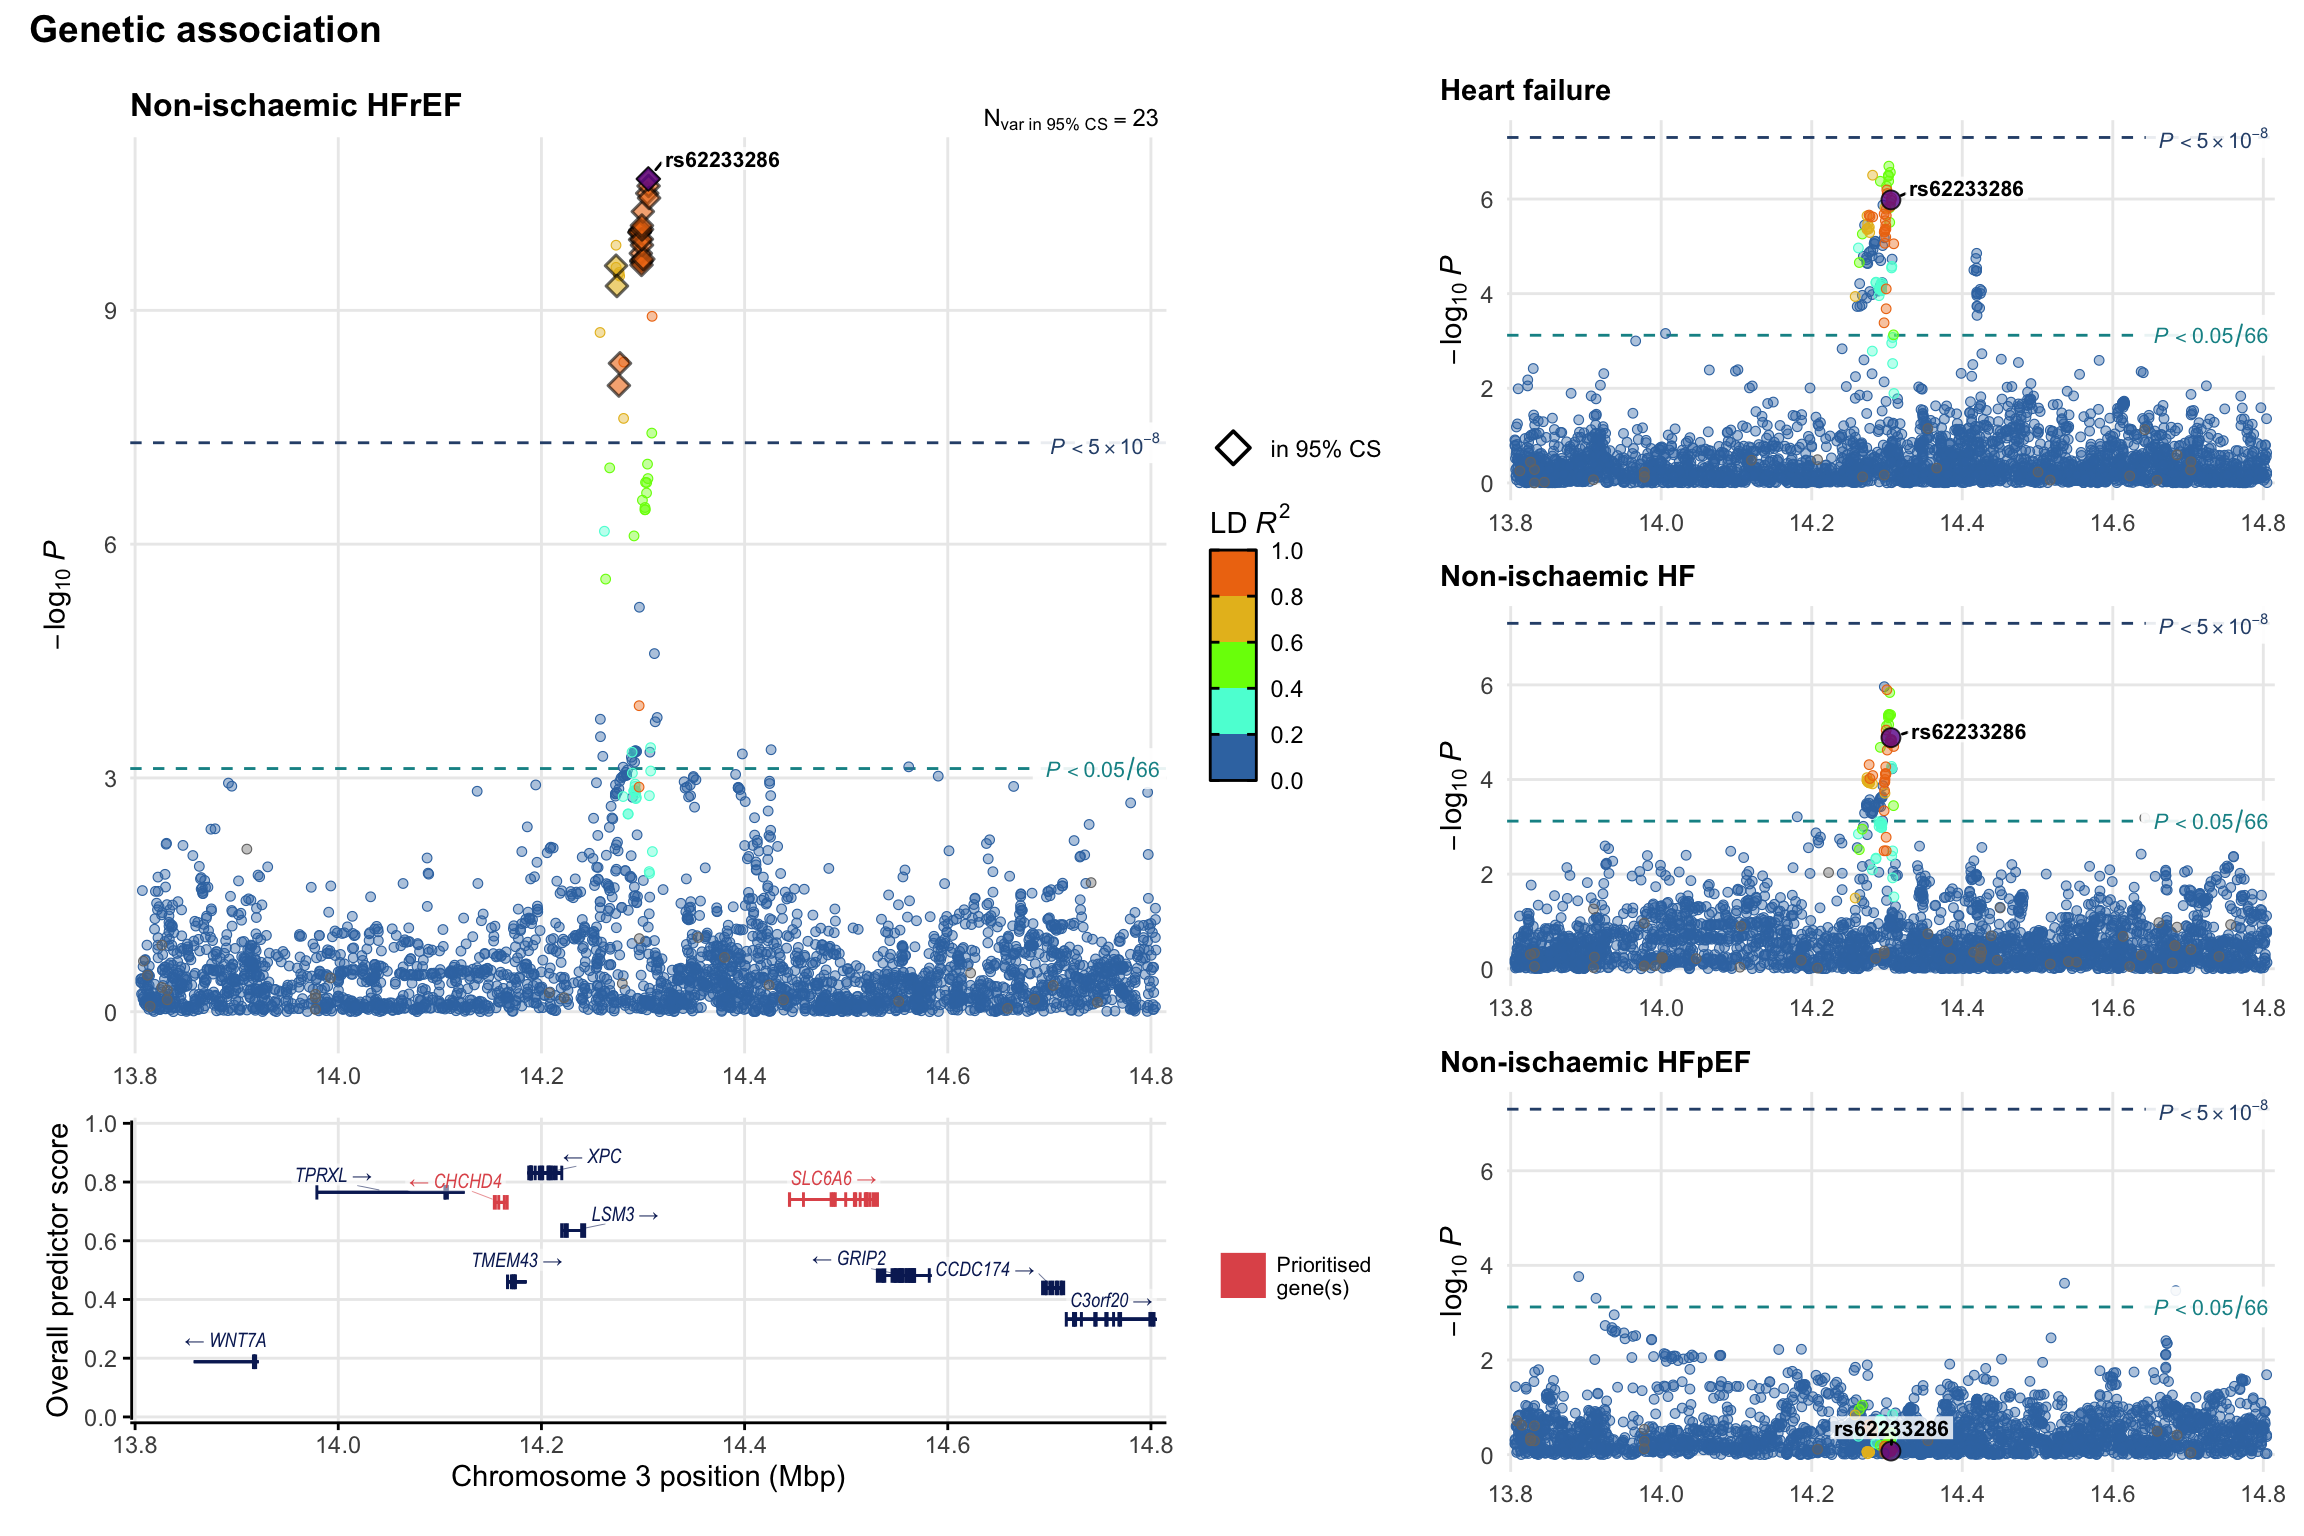
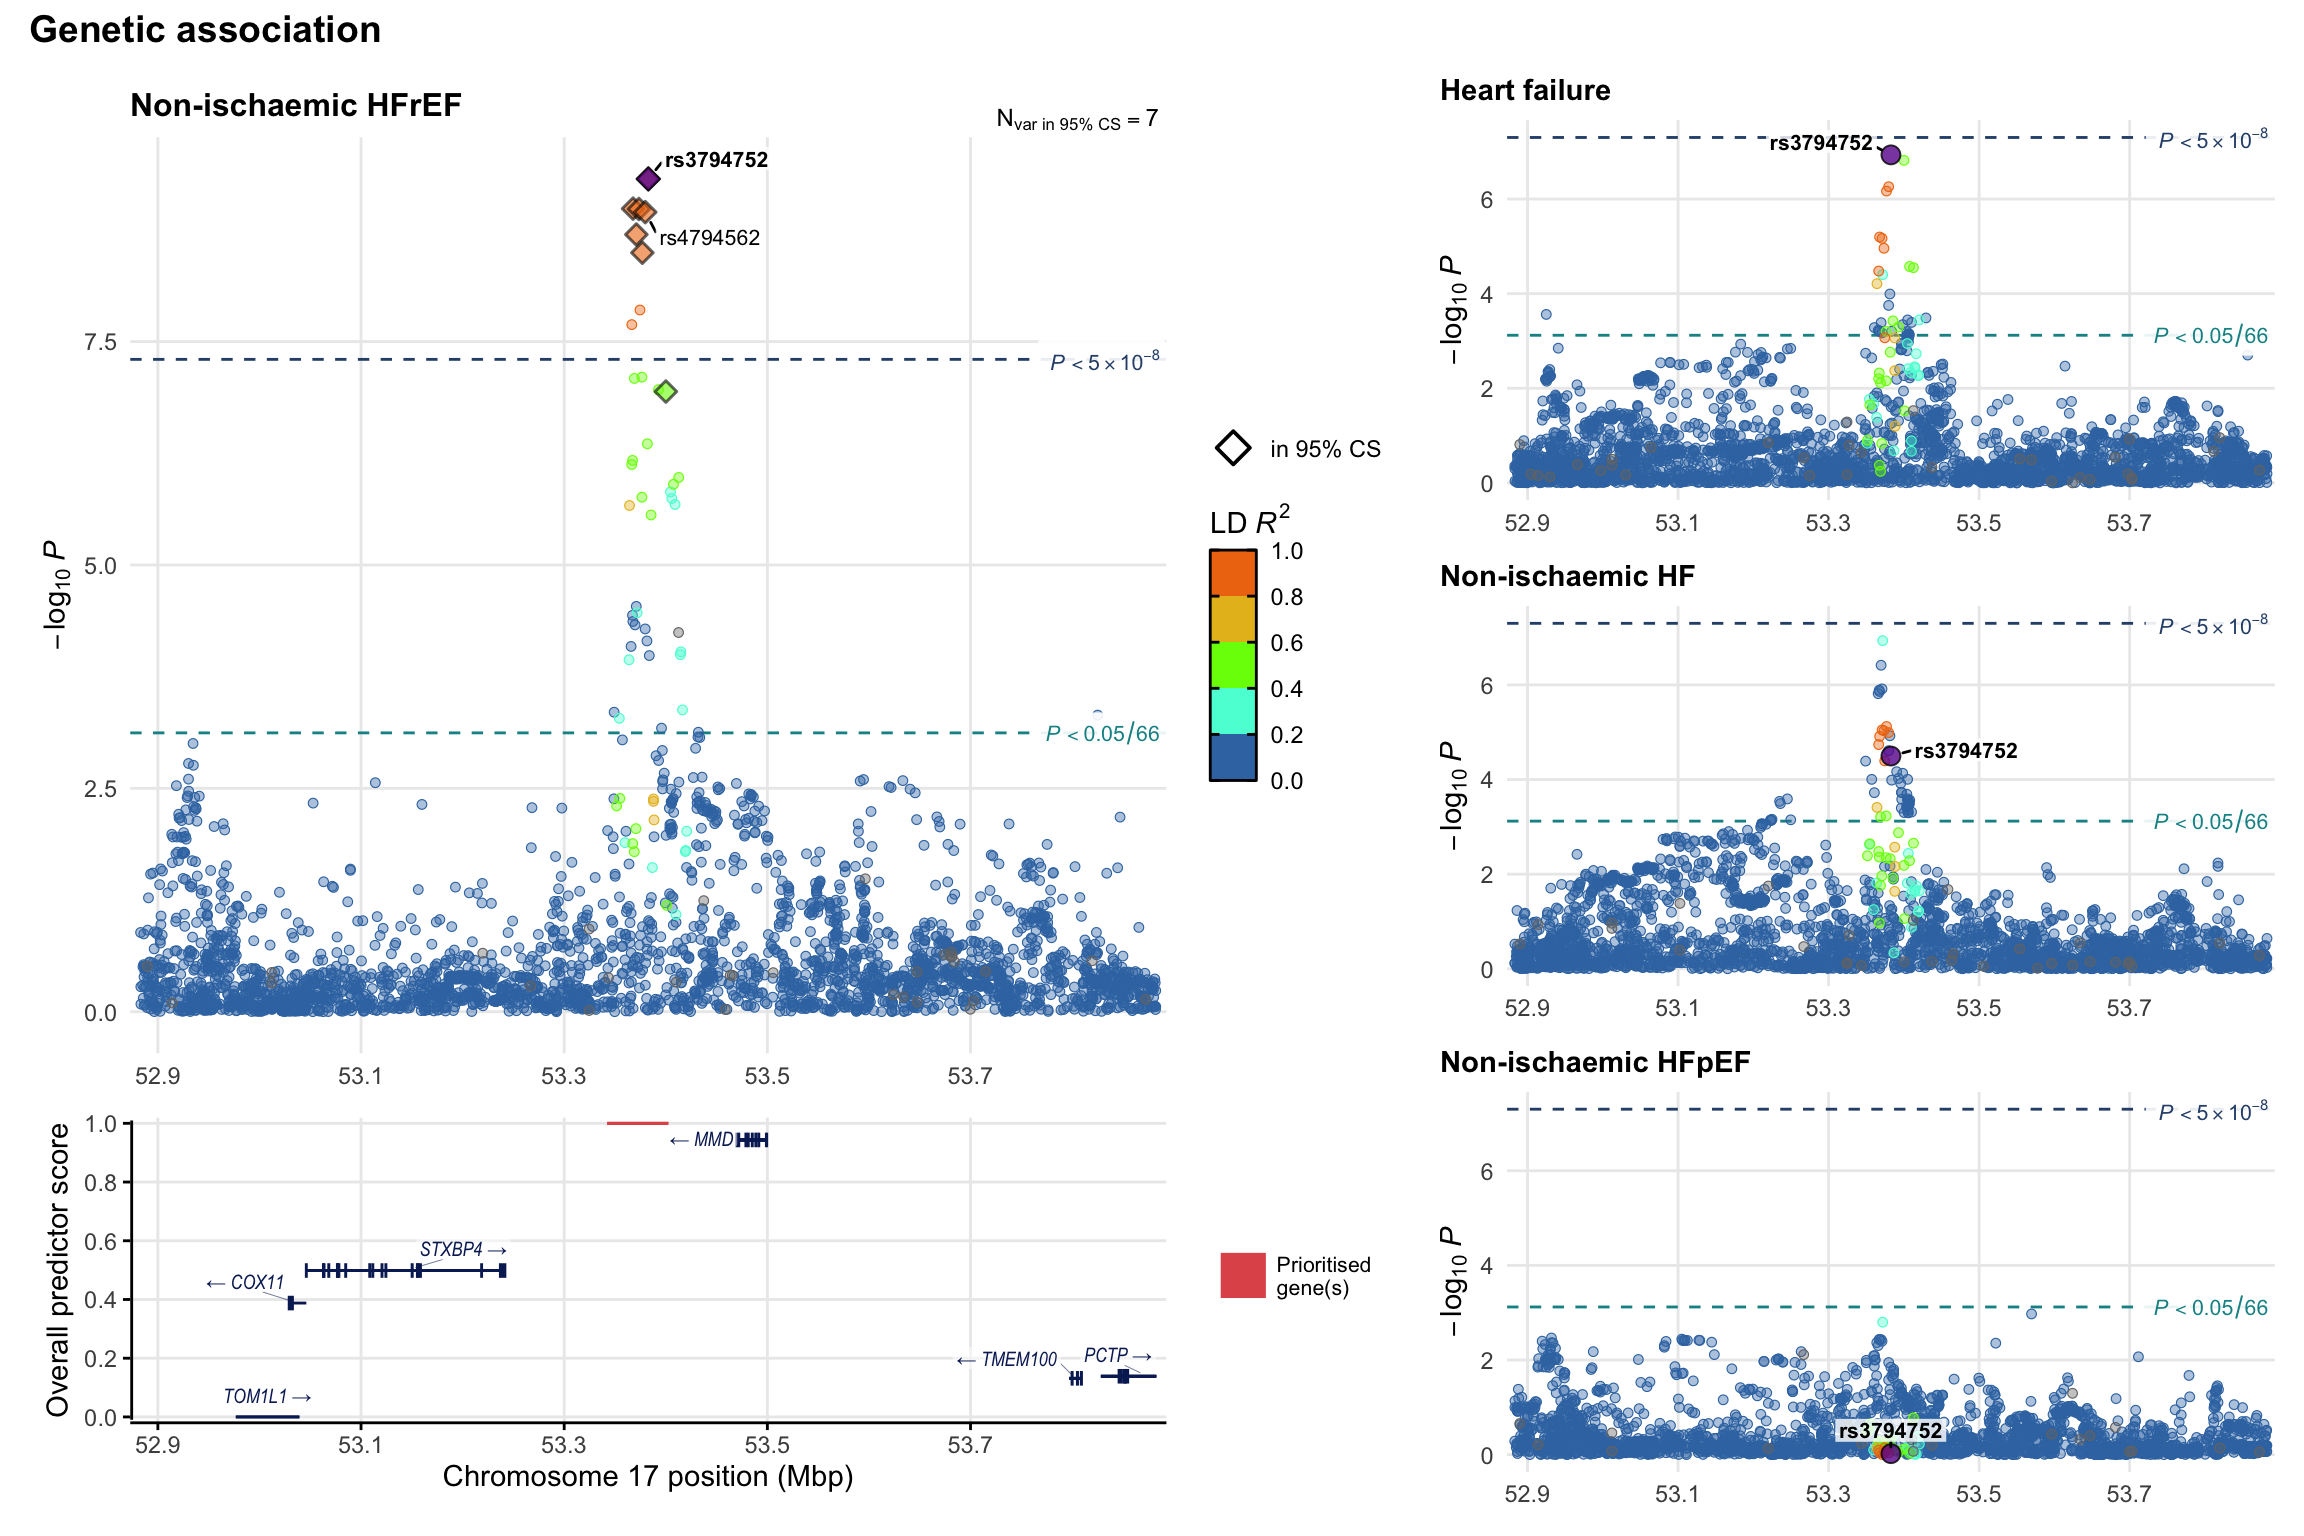
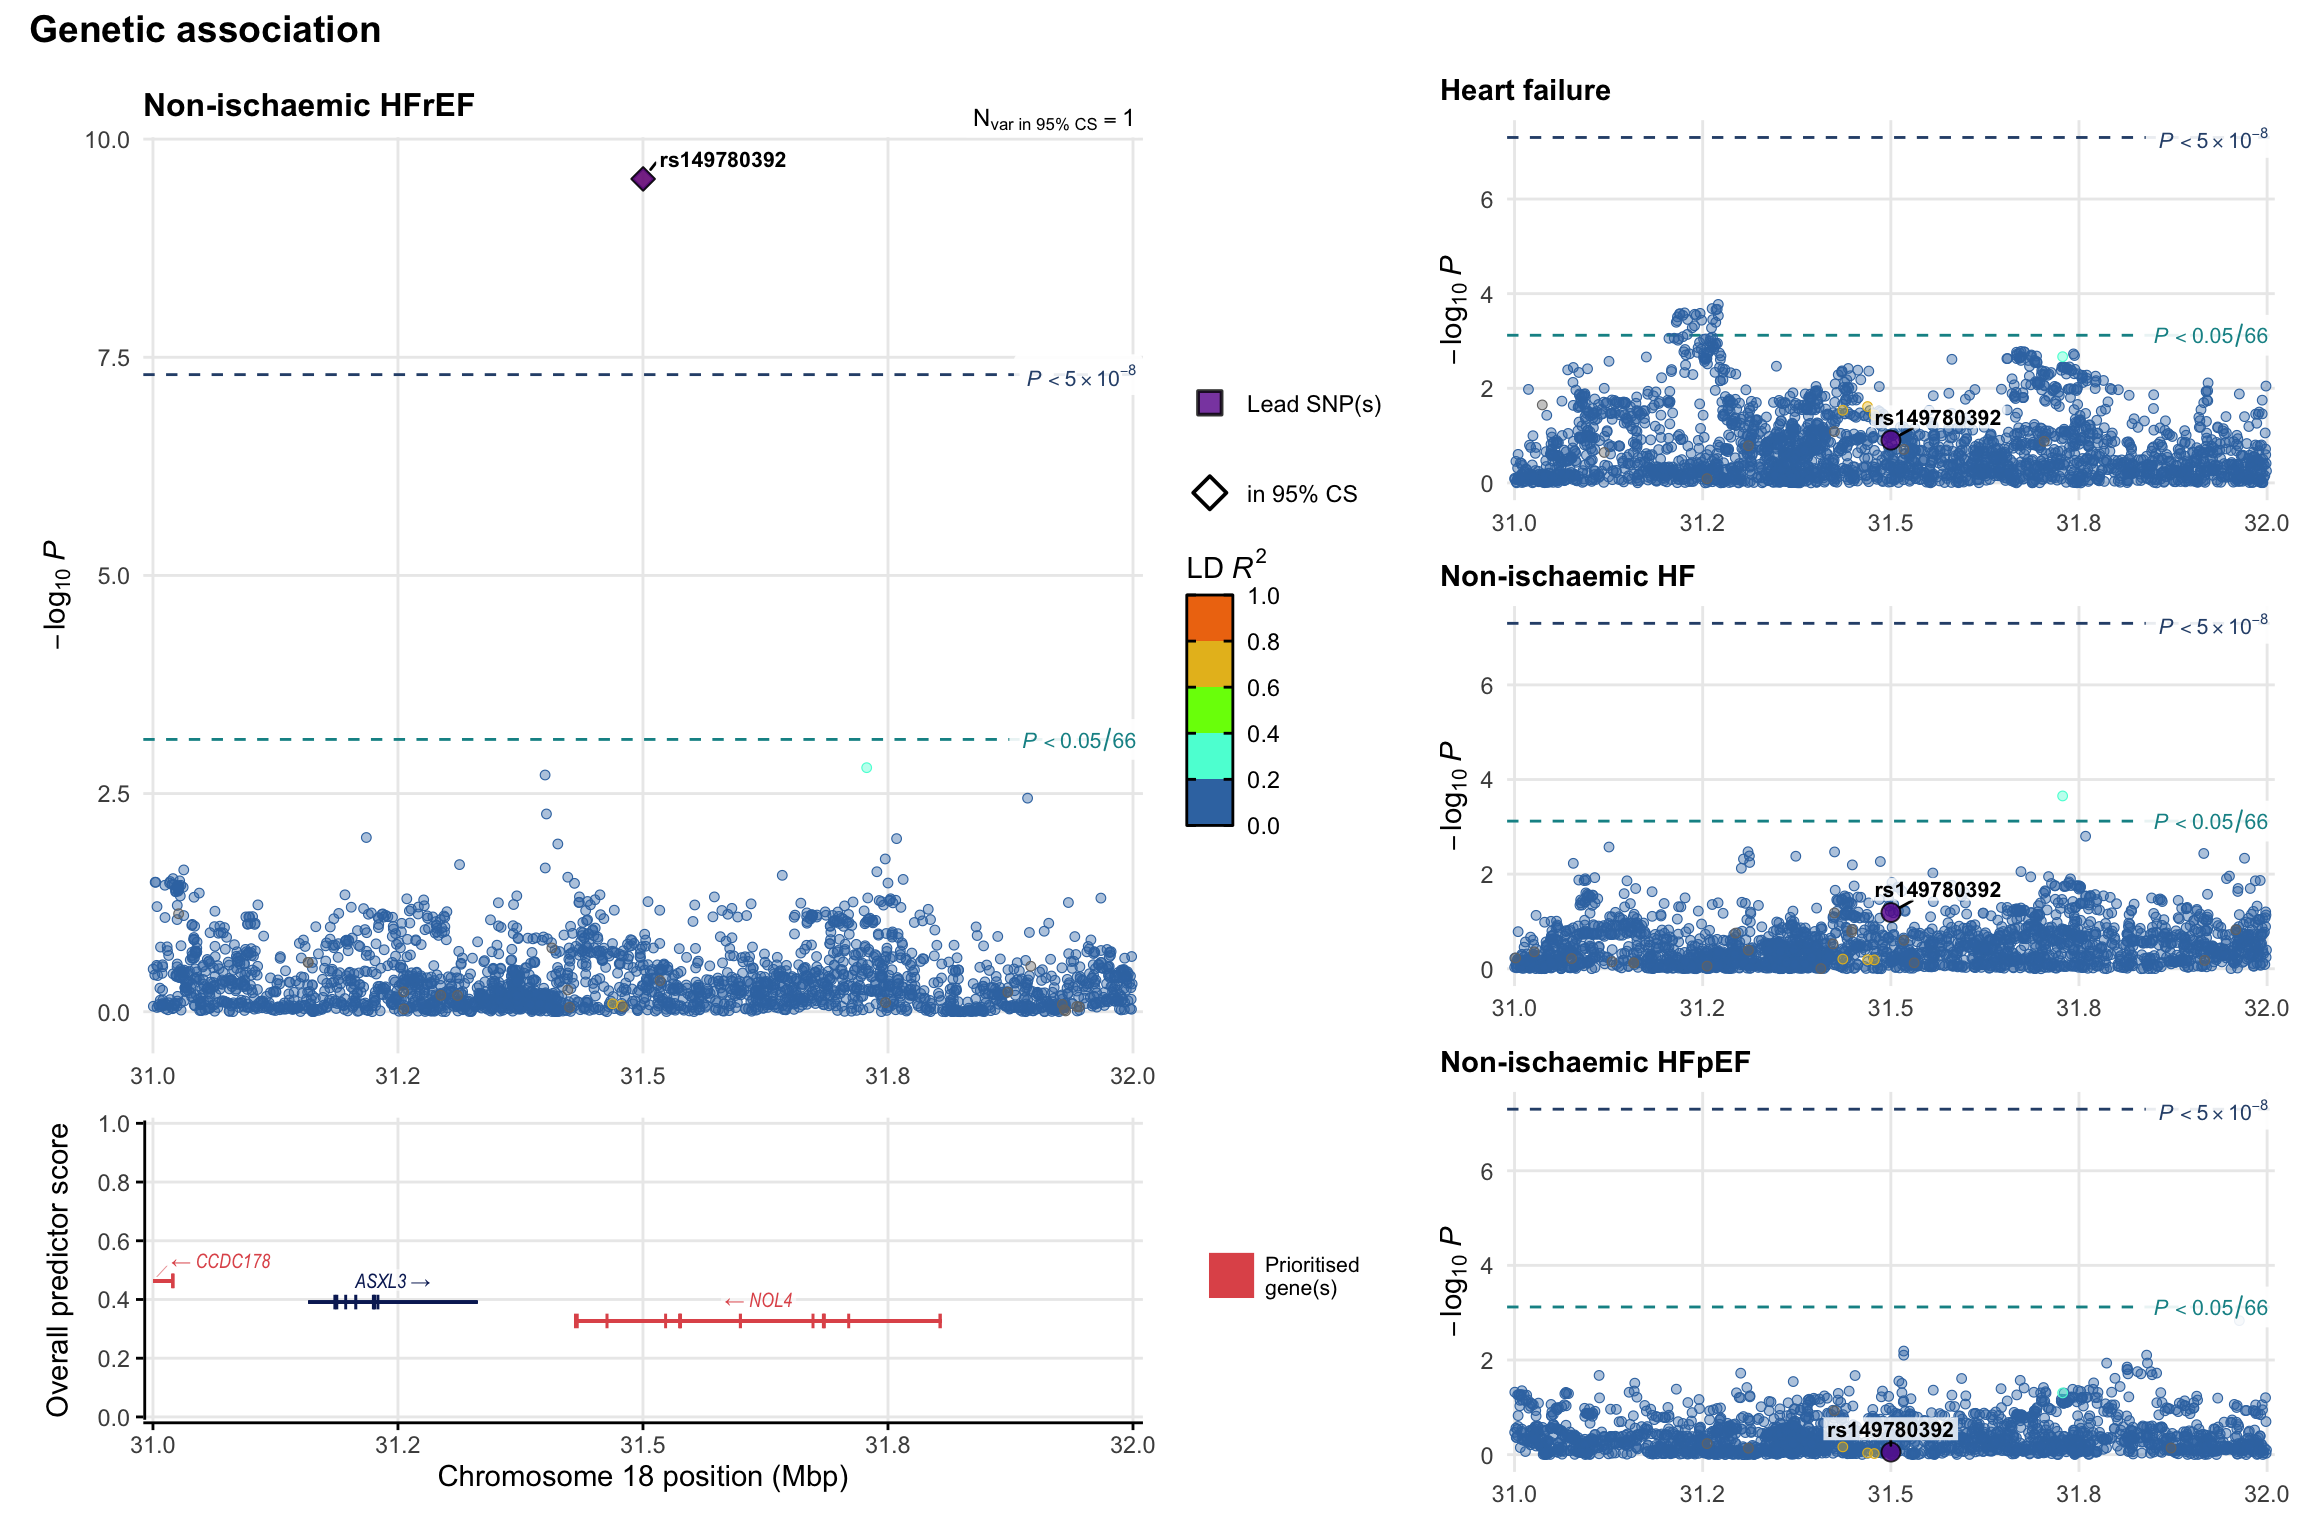
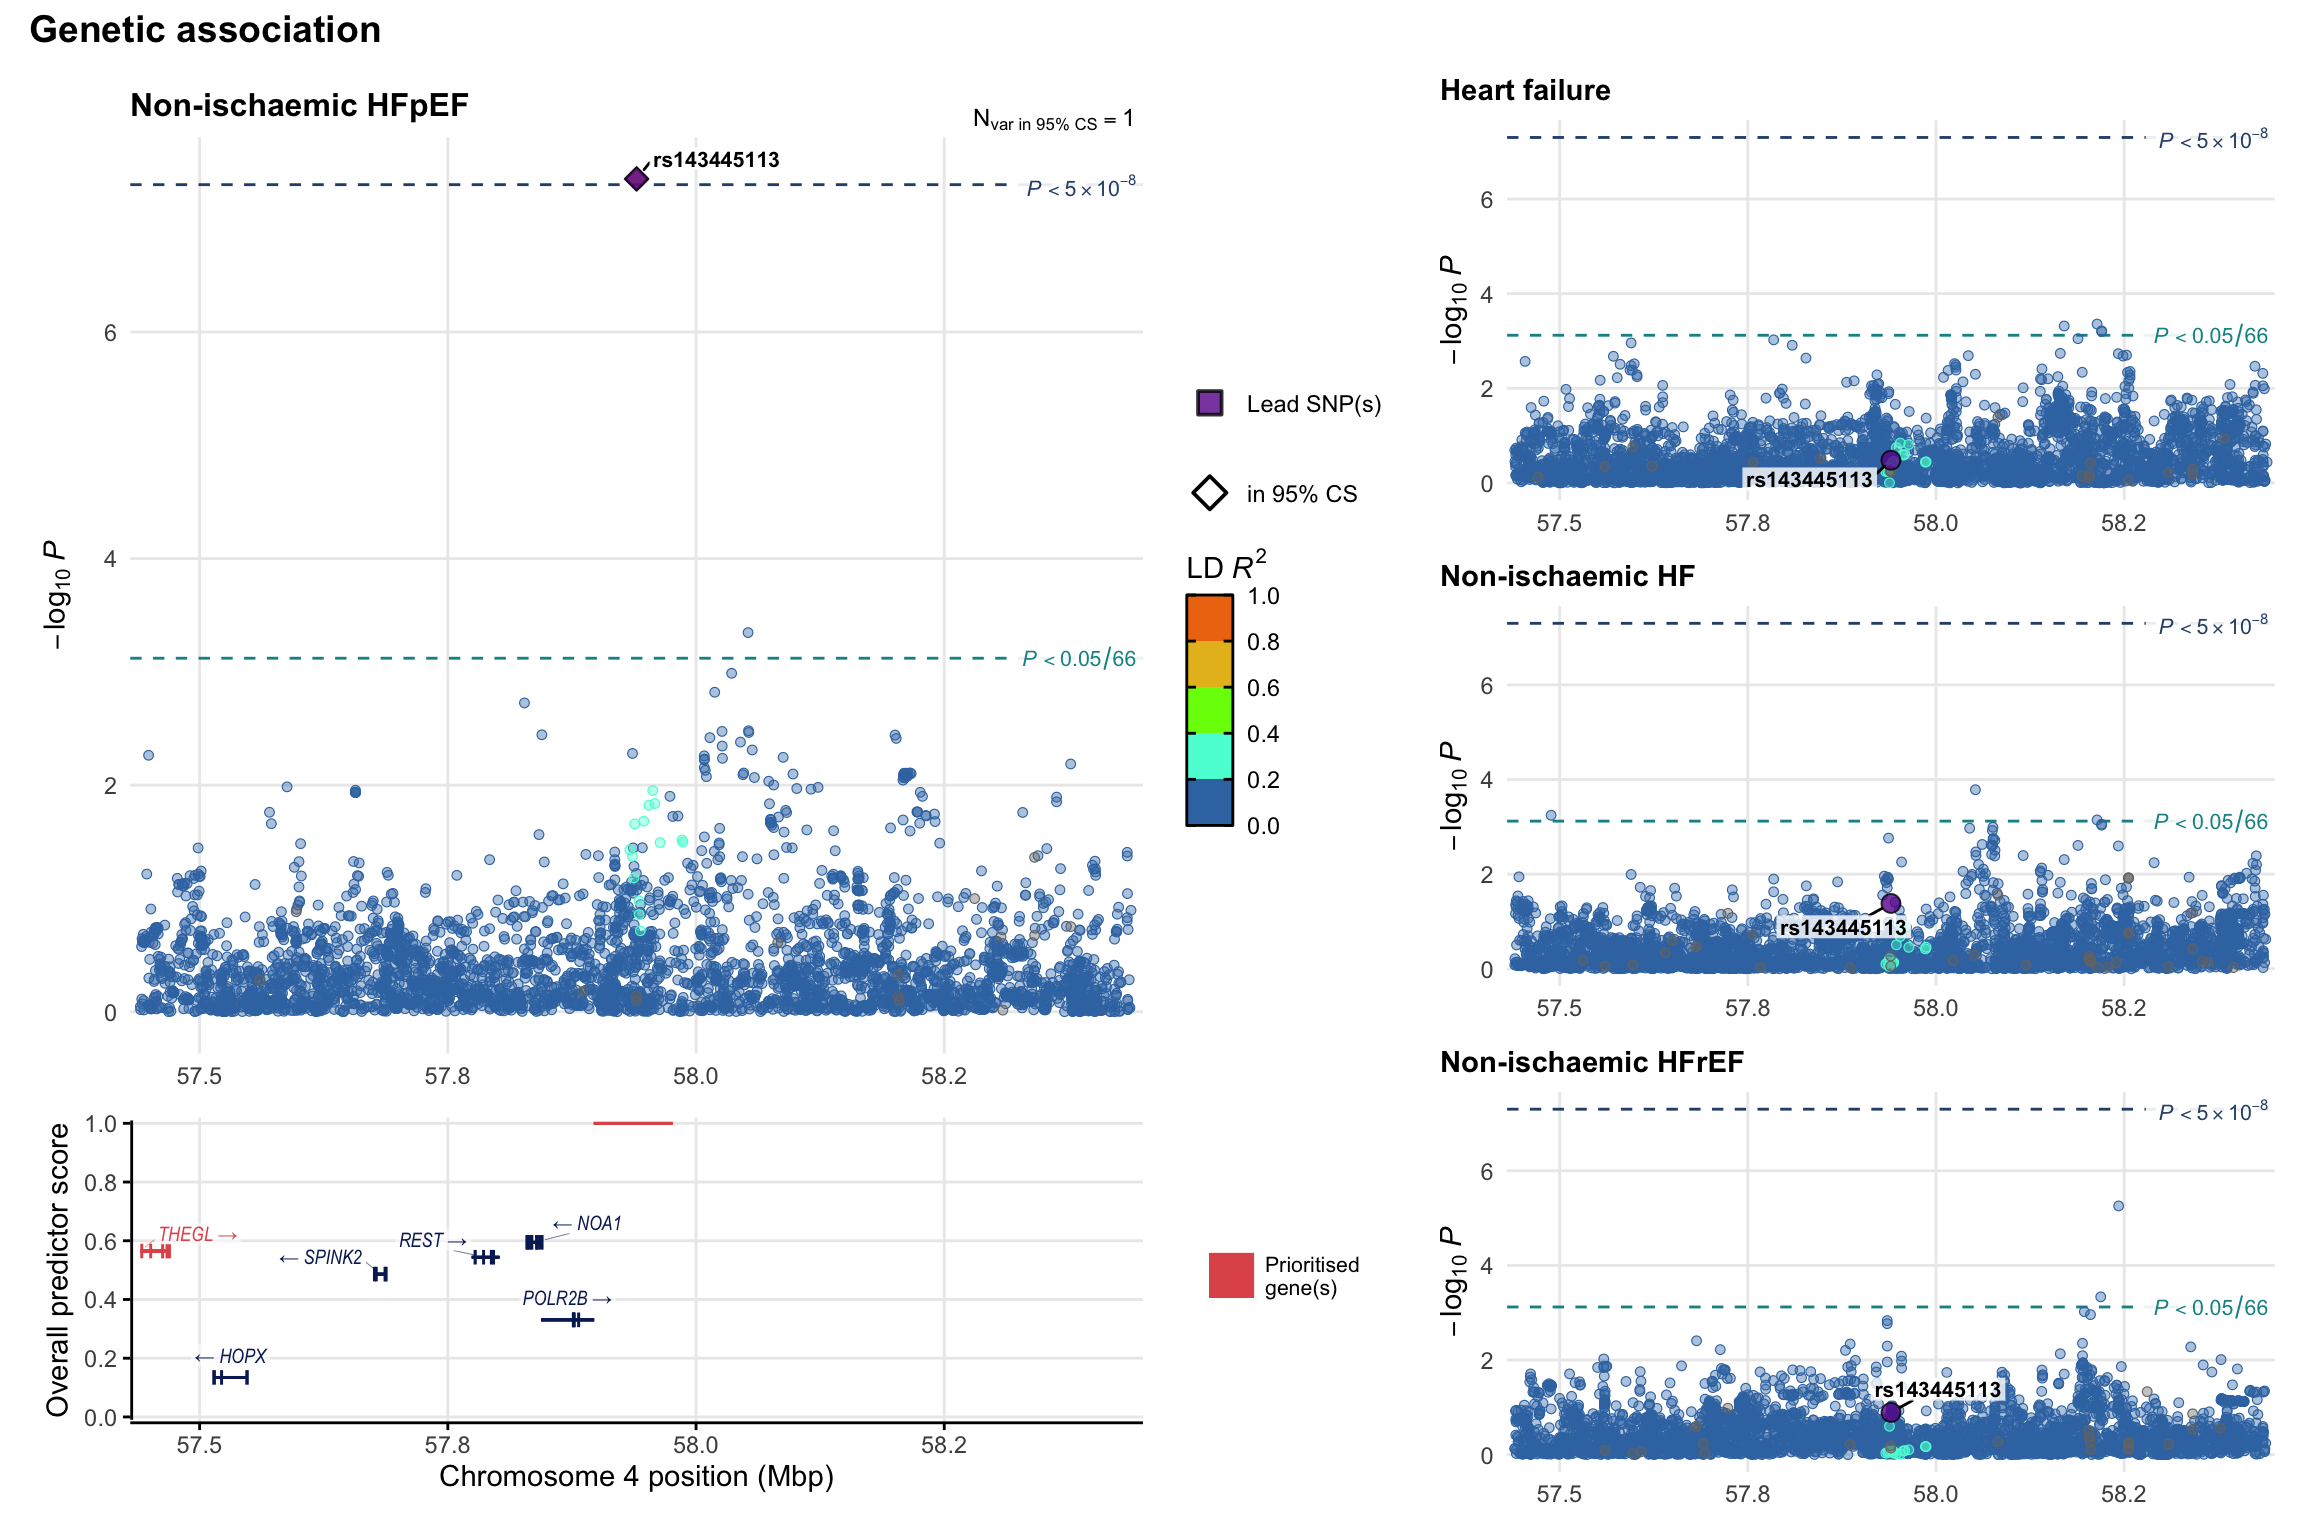
Genetic association
Variant-level regional genetic association (a la LocusZoom) with each HF phenotype. The top-left side of the panel represents genetic association with all-cause HF, or with one of the primary HF phenotypes showing lowest P value for variants specifically associated with primary HF phenotype. Associations with other HF phenotypes are presented on the right-side of the panel. The bottom-left side of the panel represents location of protein-coding genes and processed transcripts situated within the loci, with blocks represent exons of the canonical transcript. The genes ar positioned vertically based on the overall gene prioritization score.
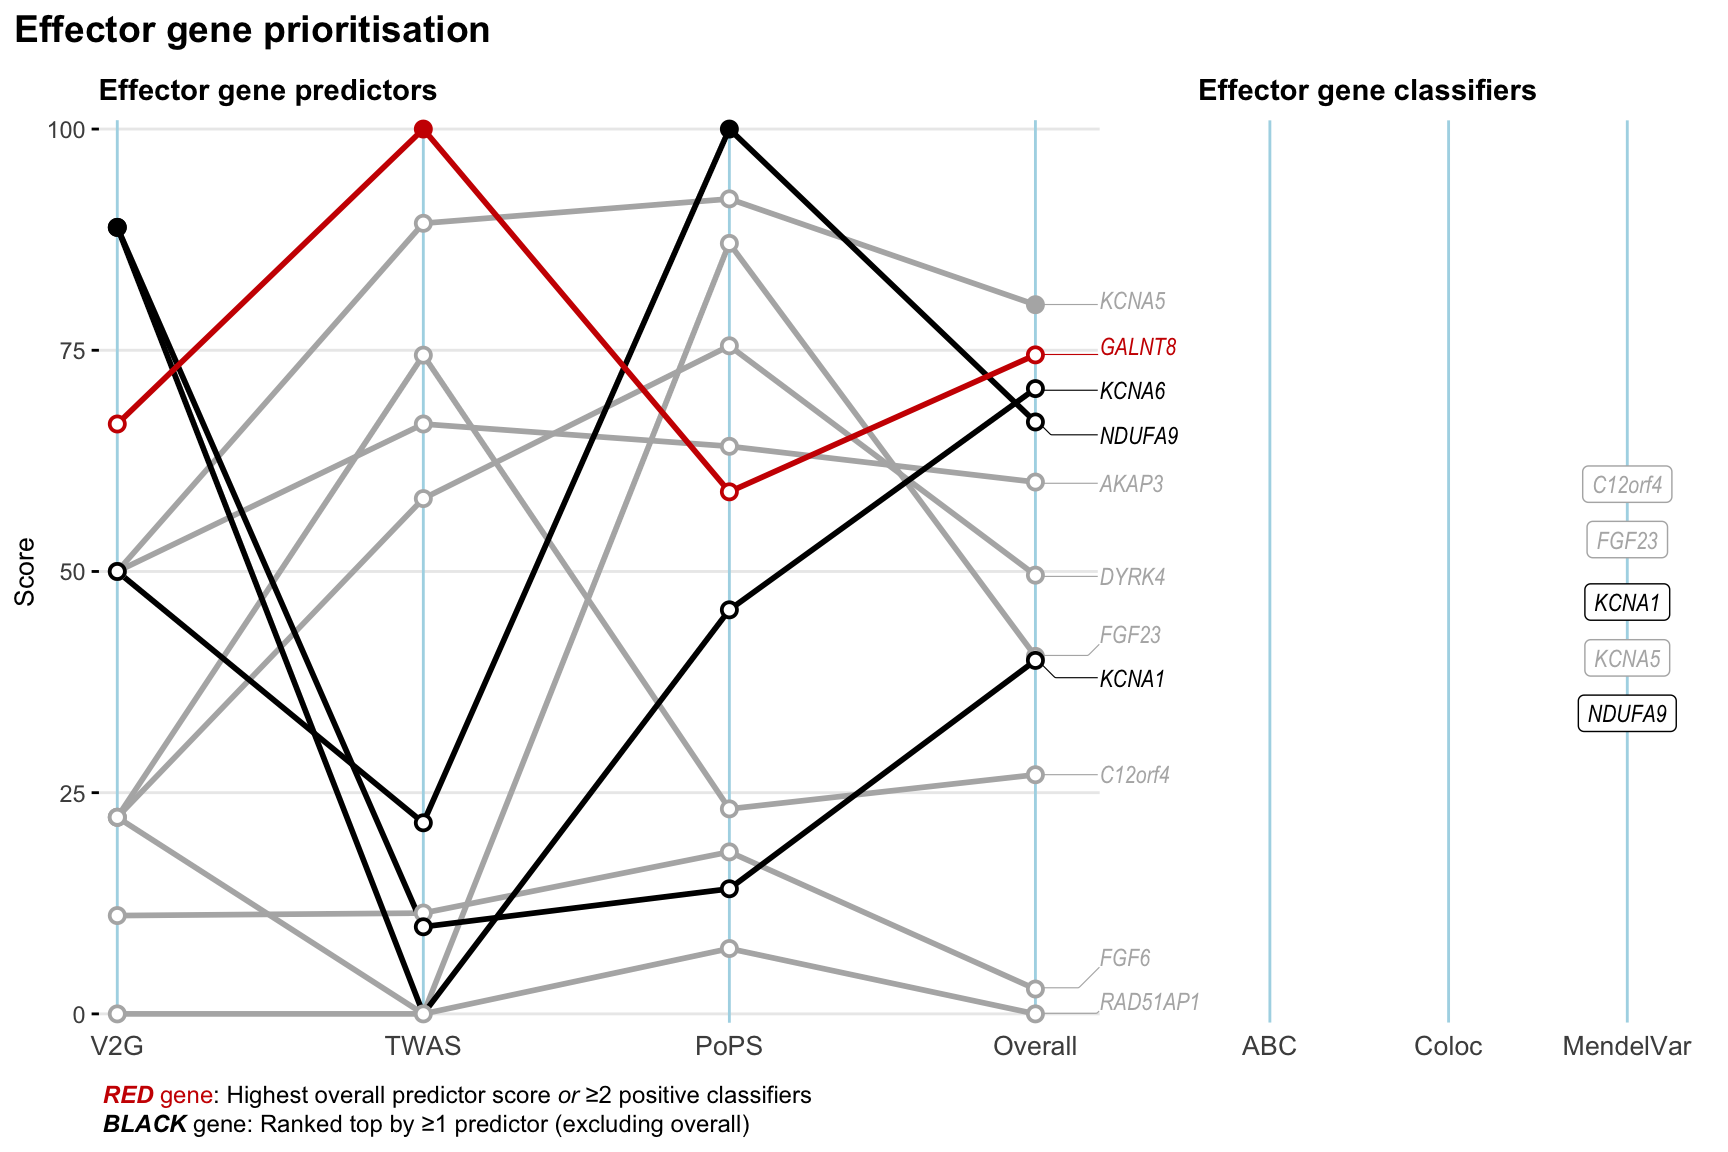
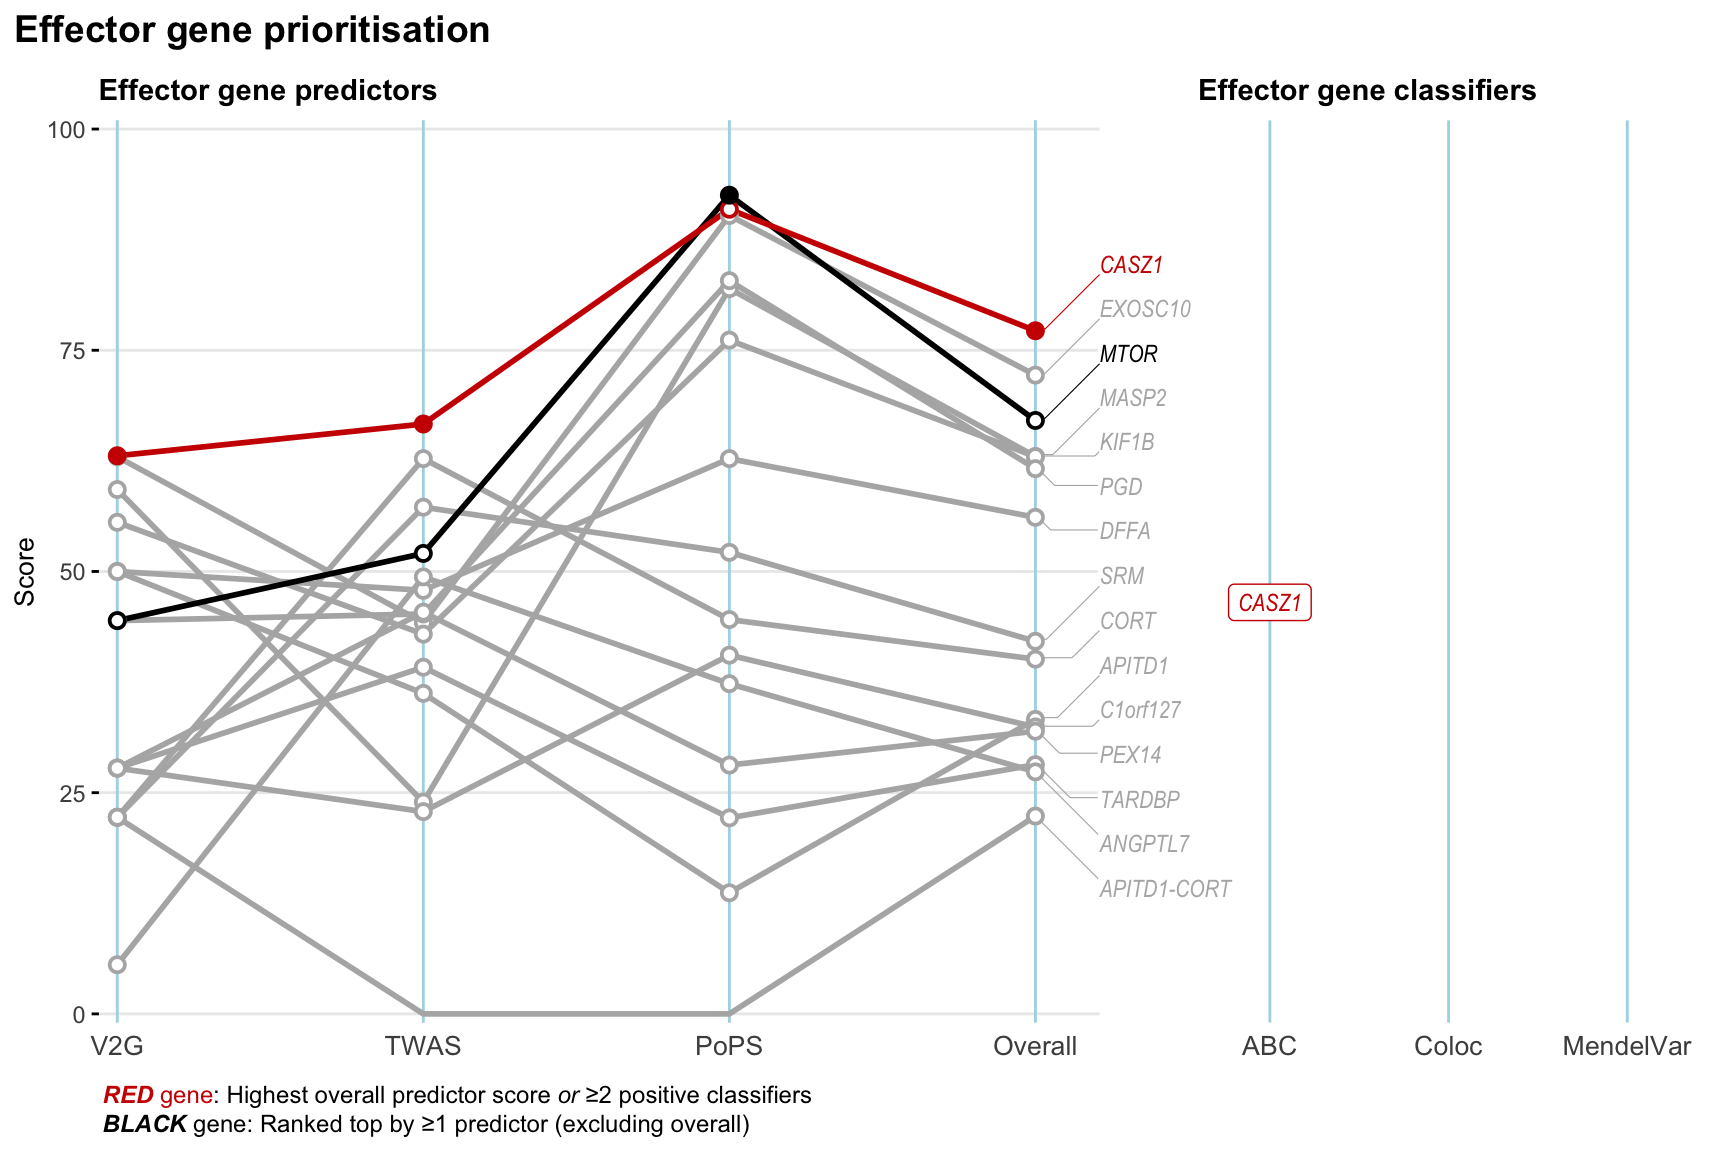
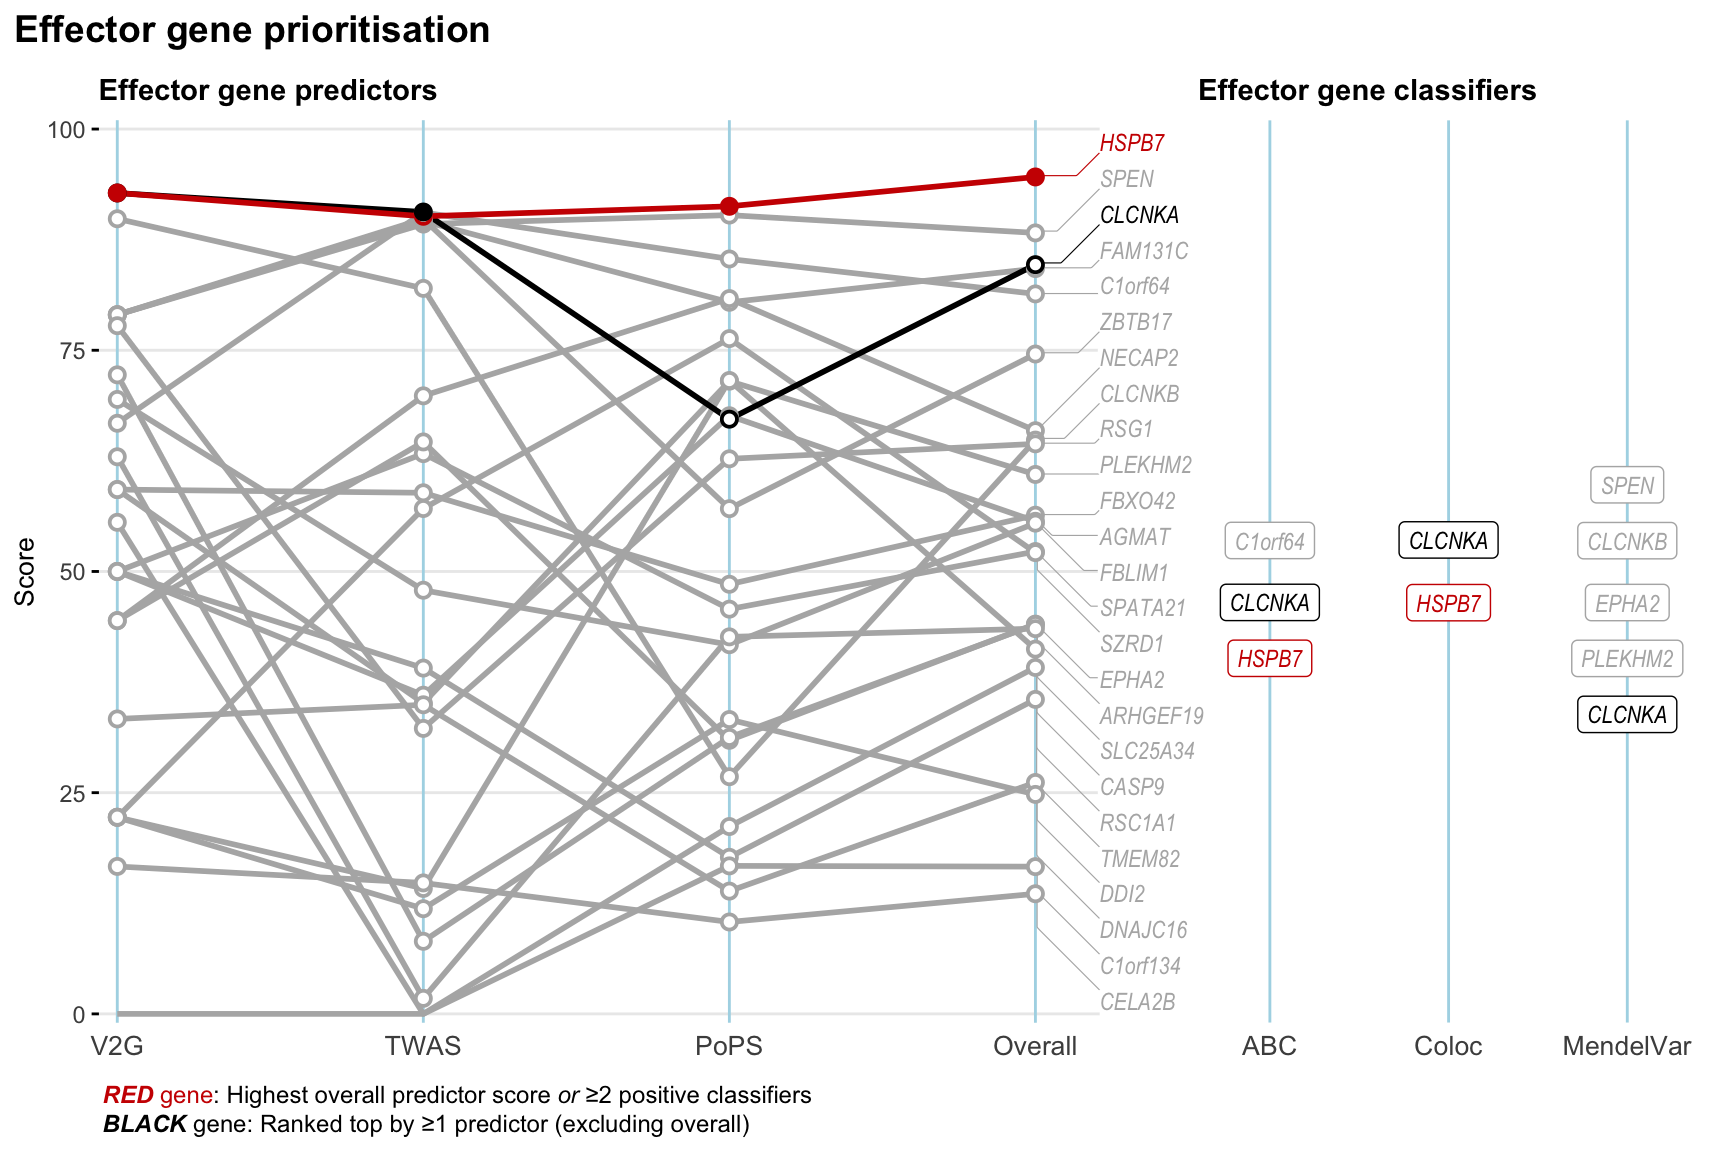
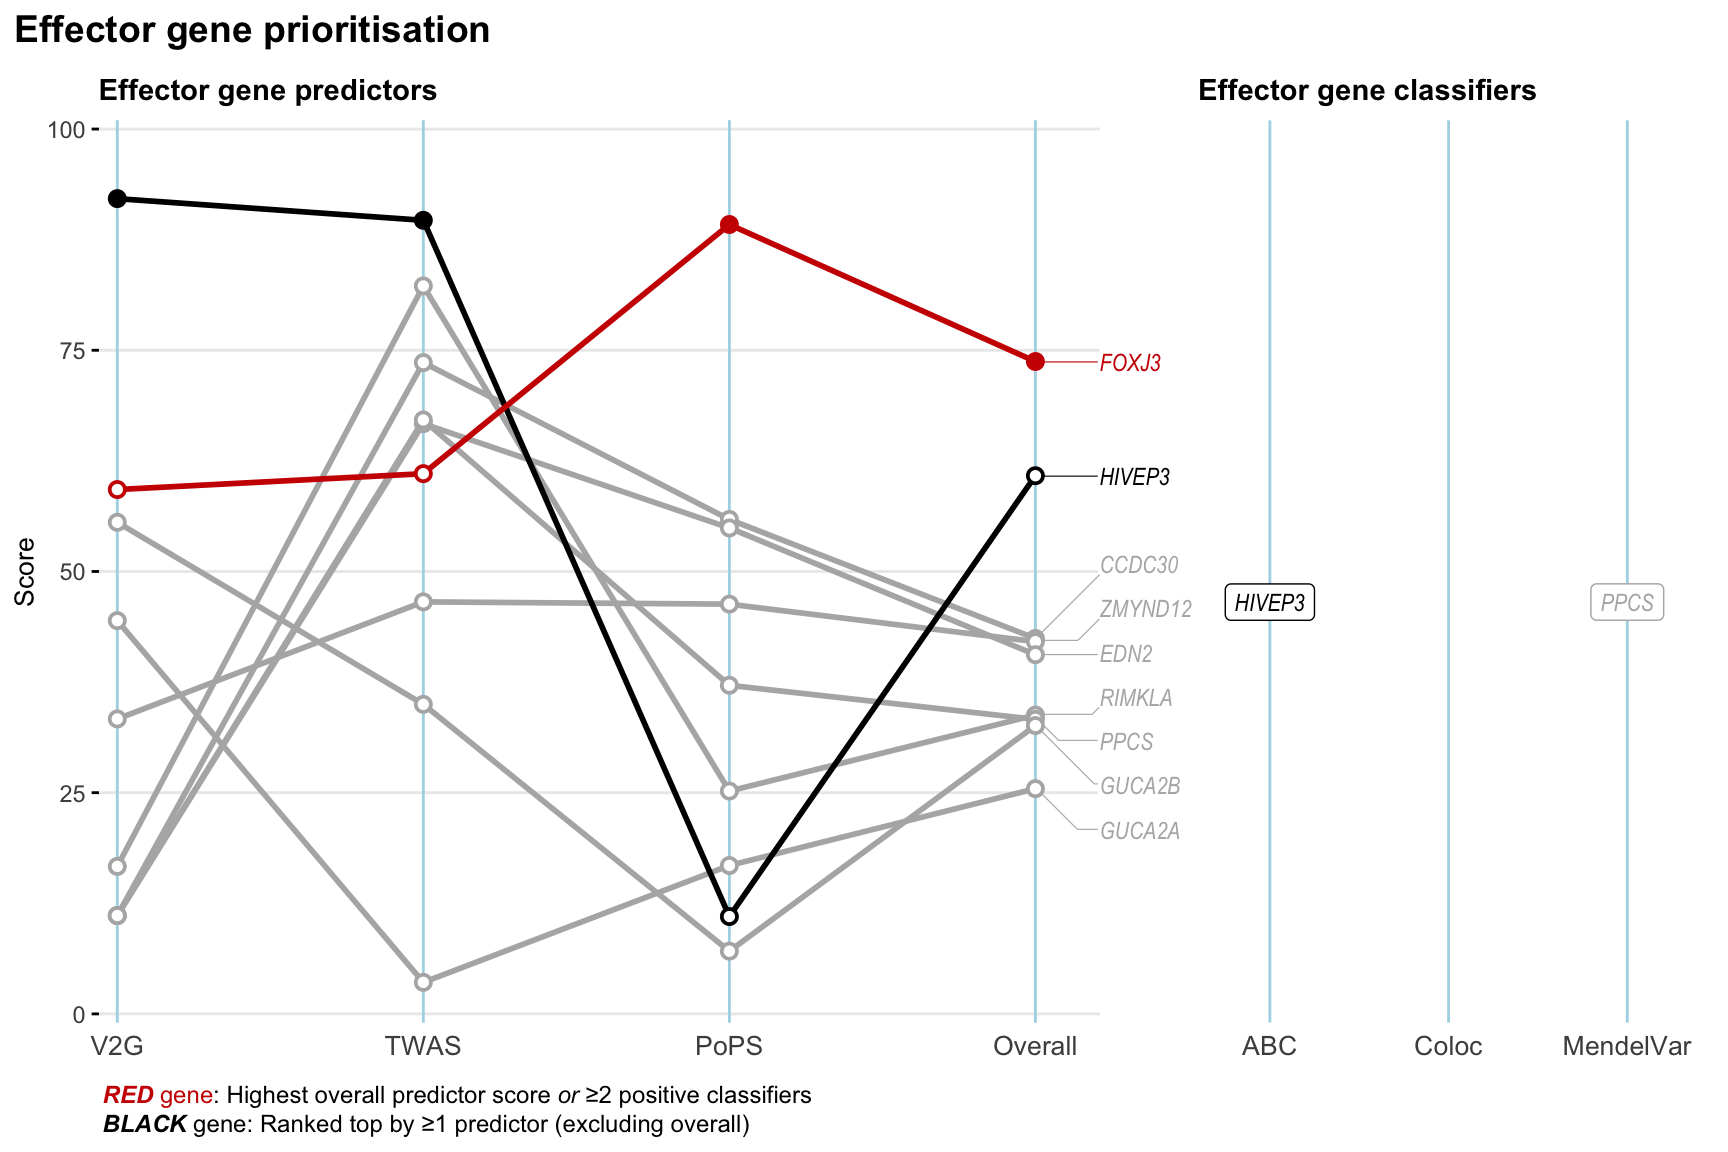
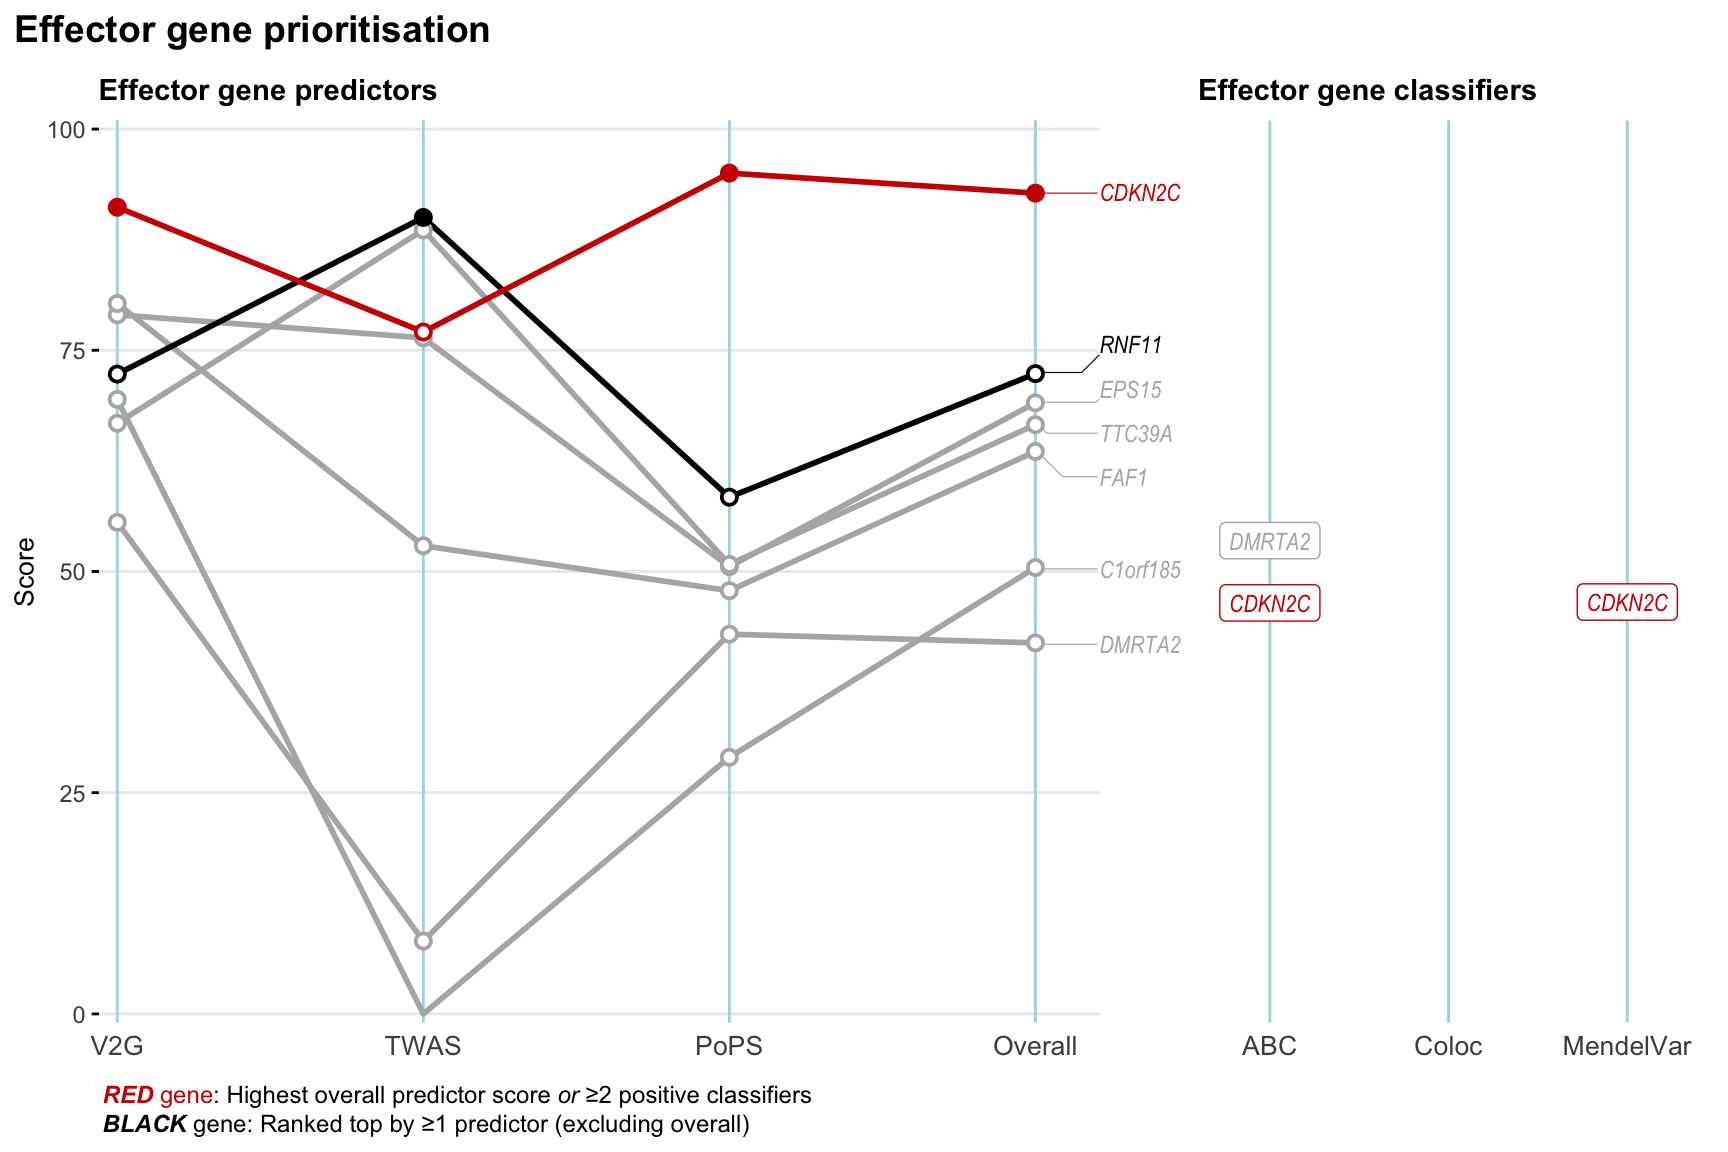
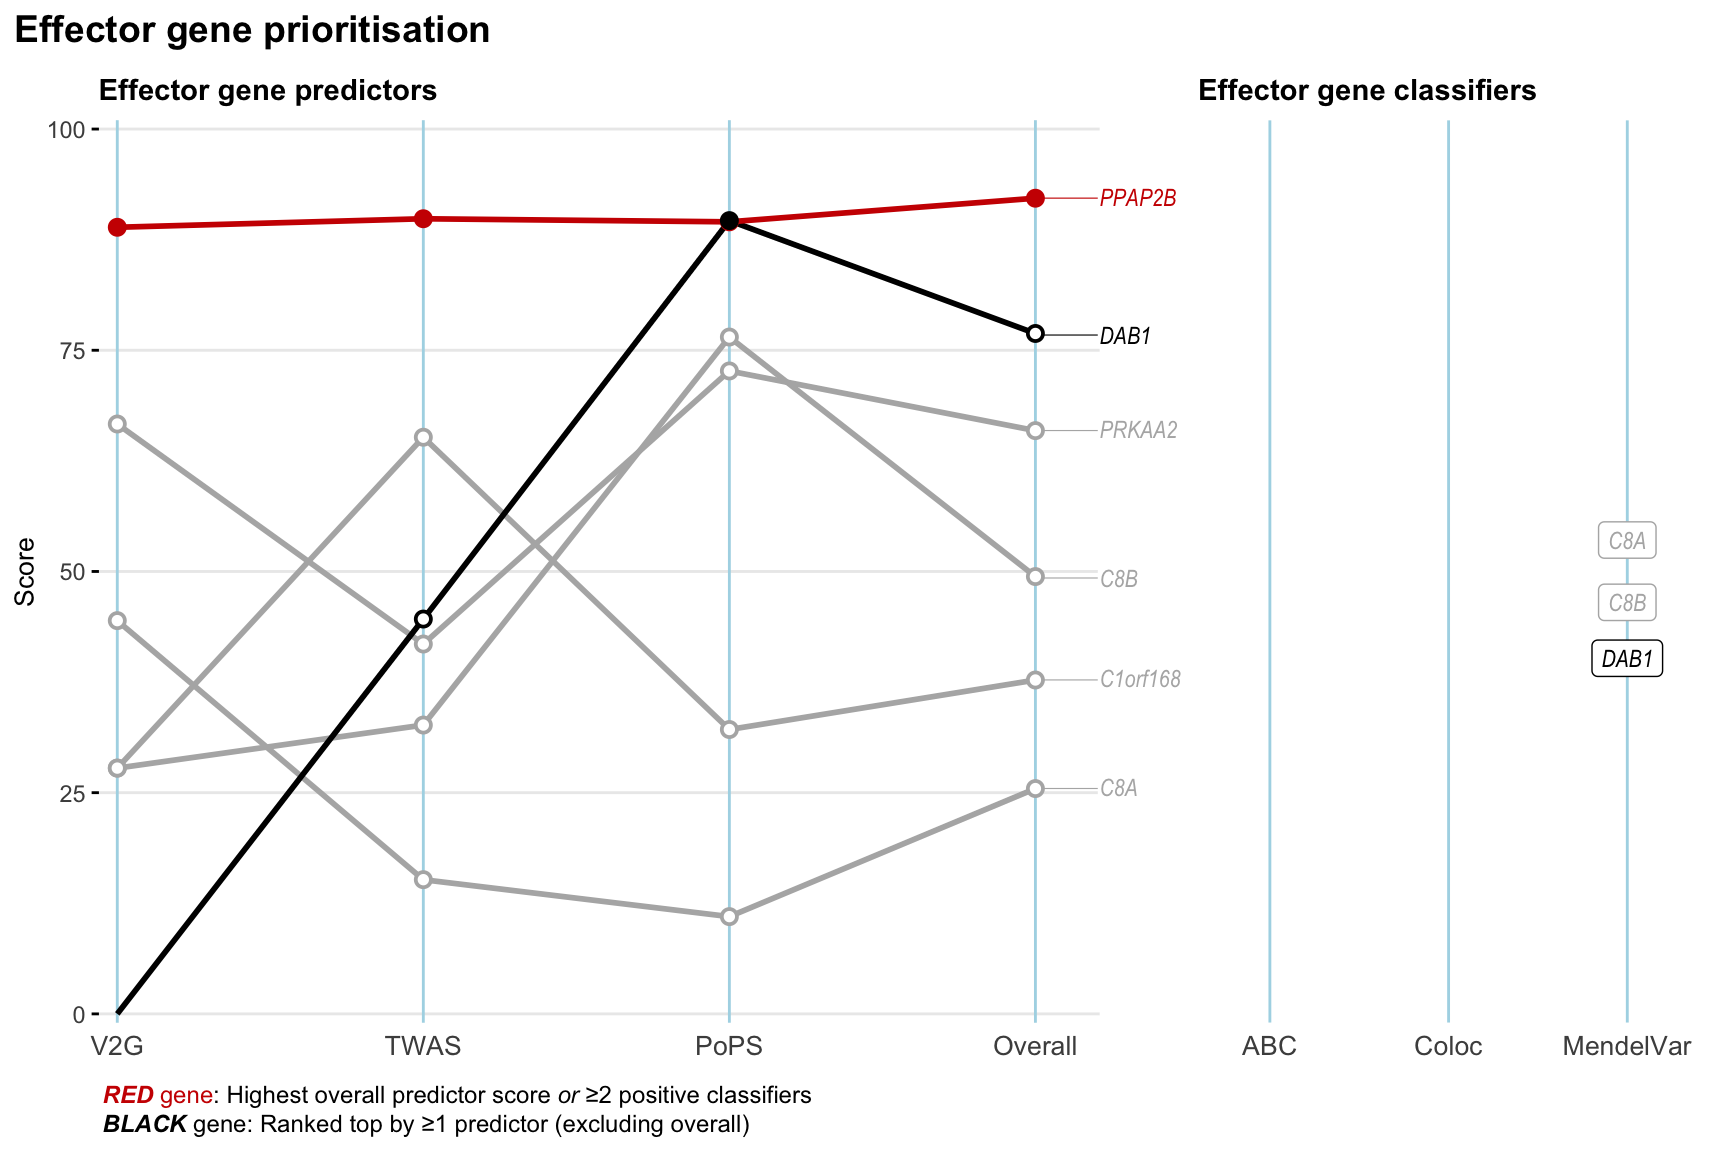
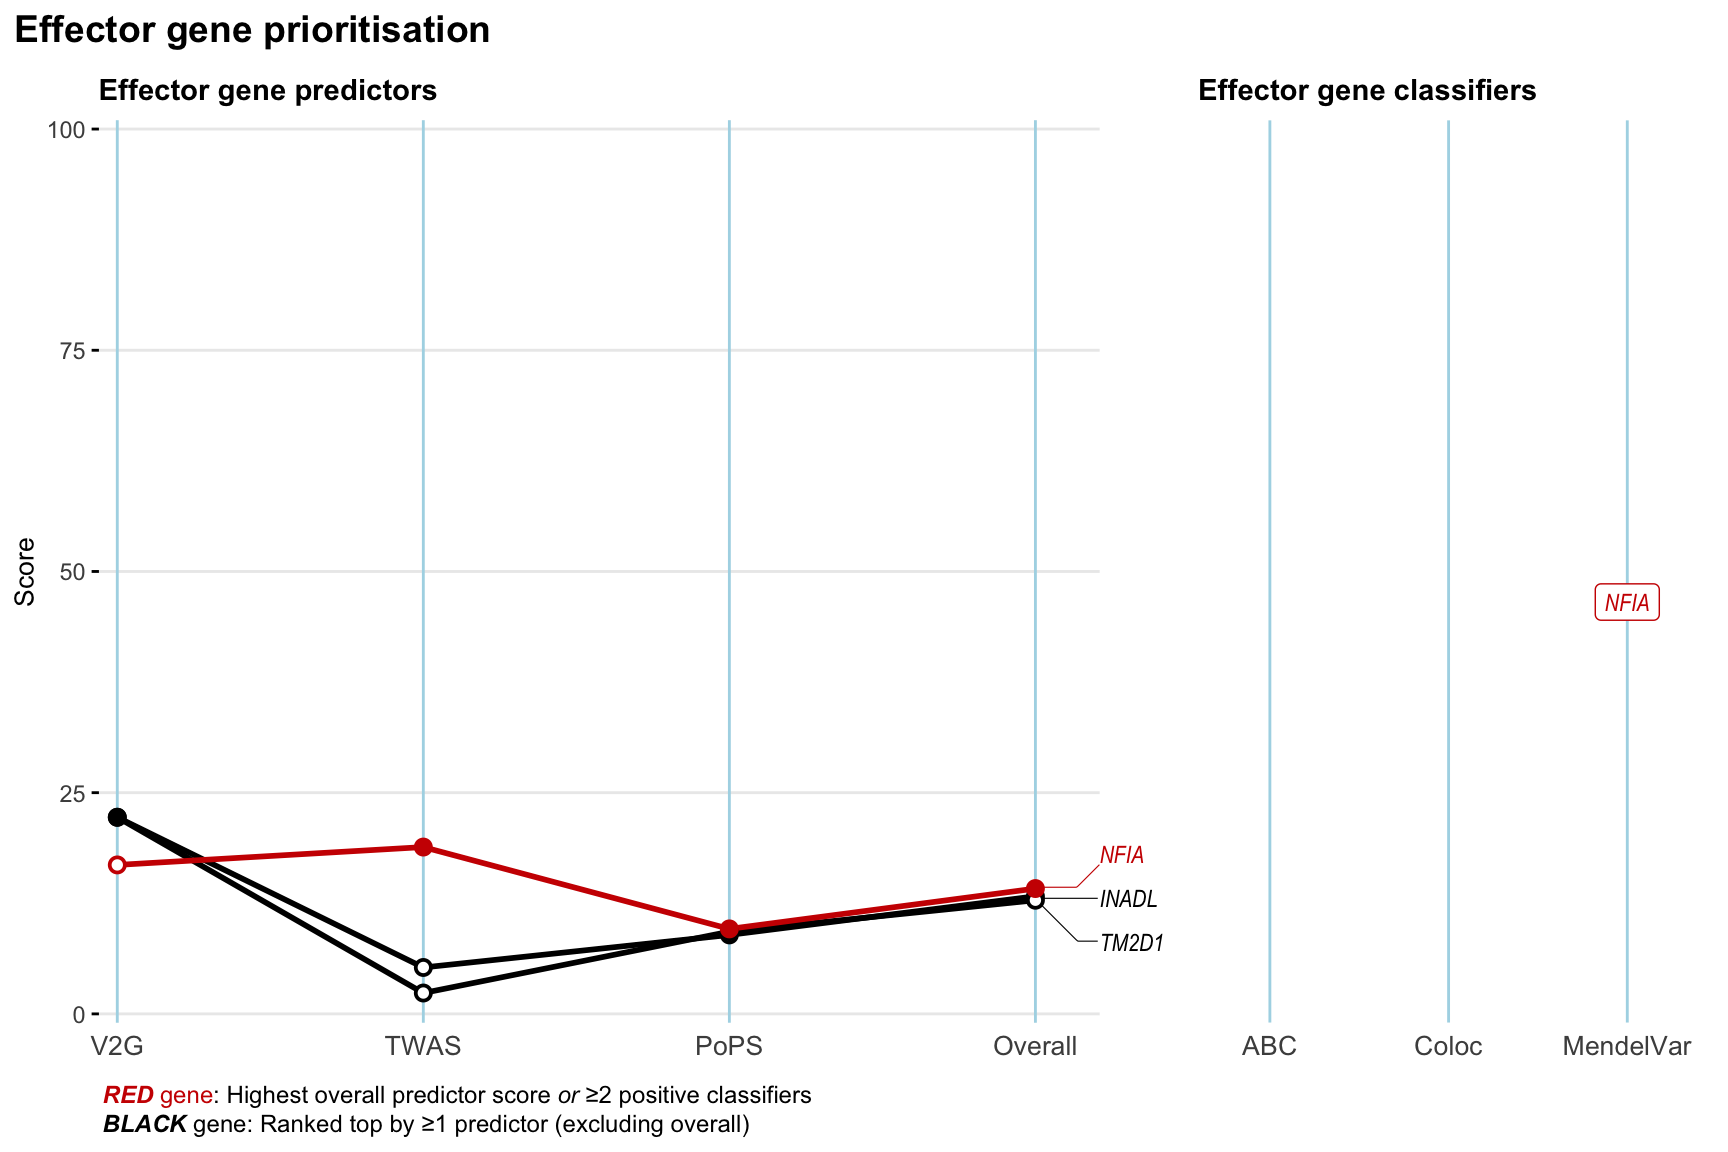
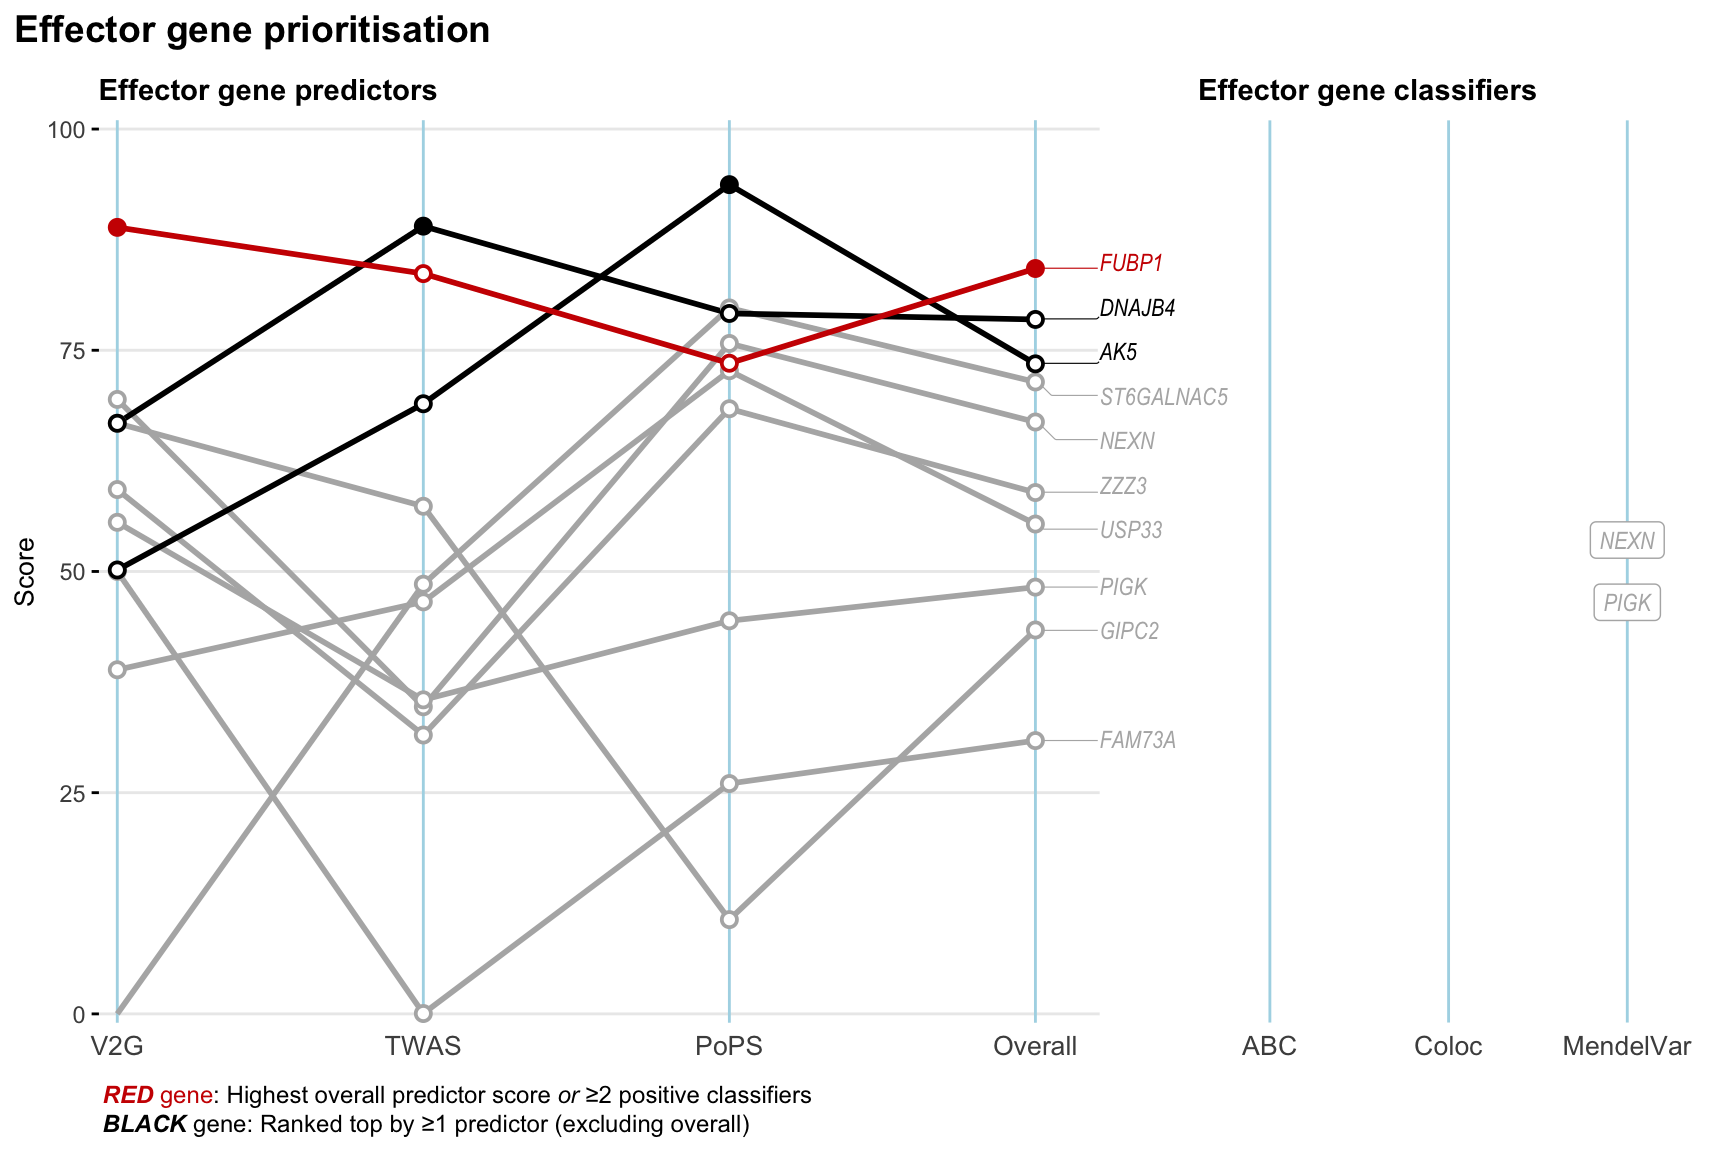
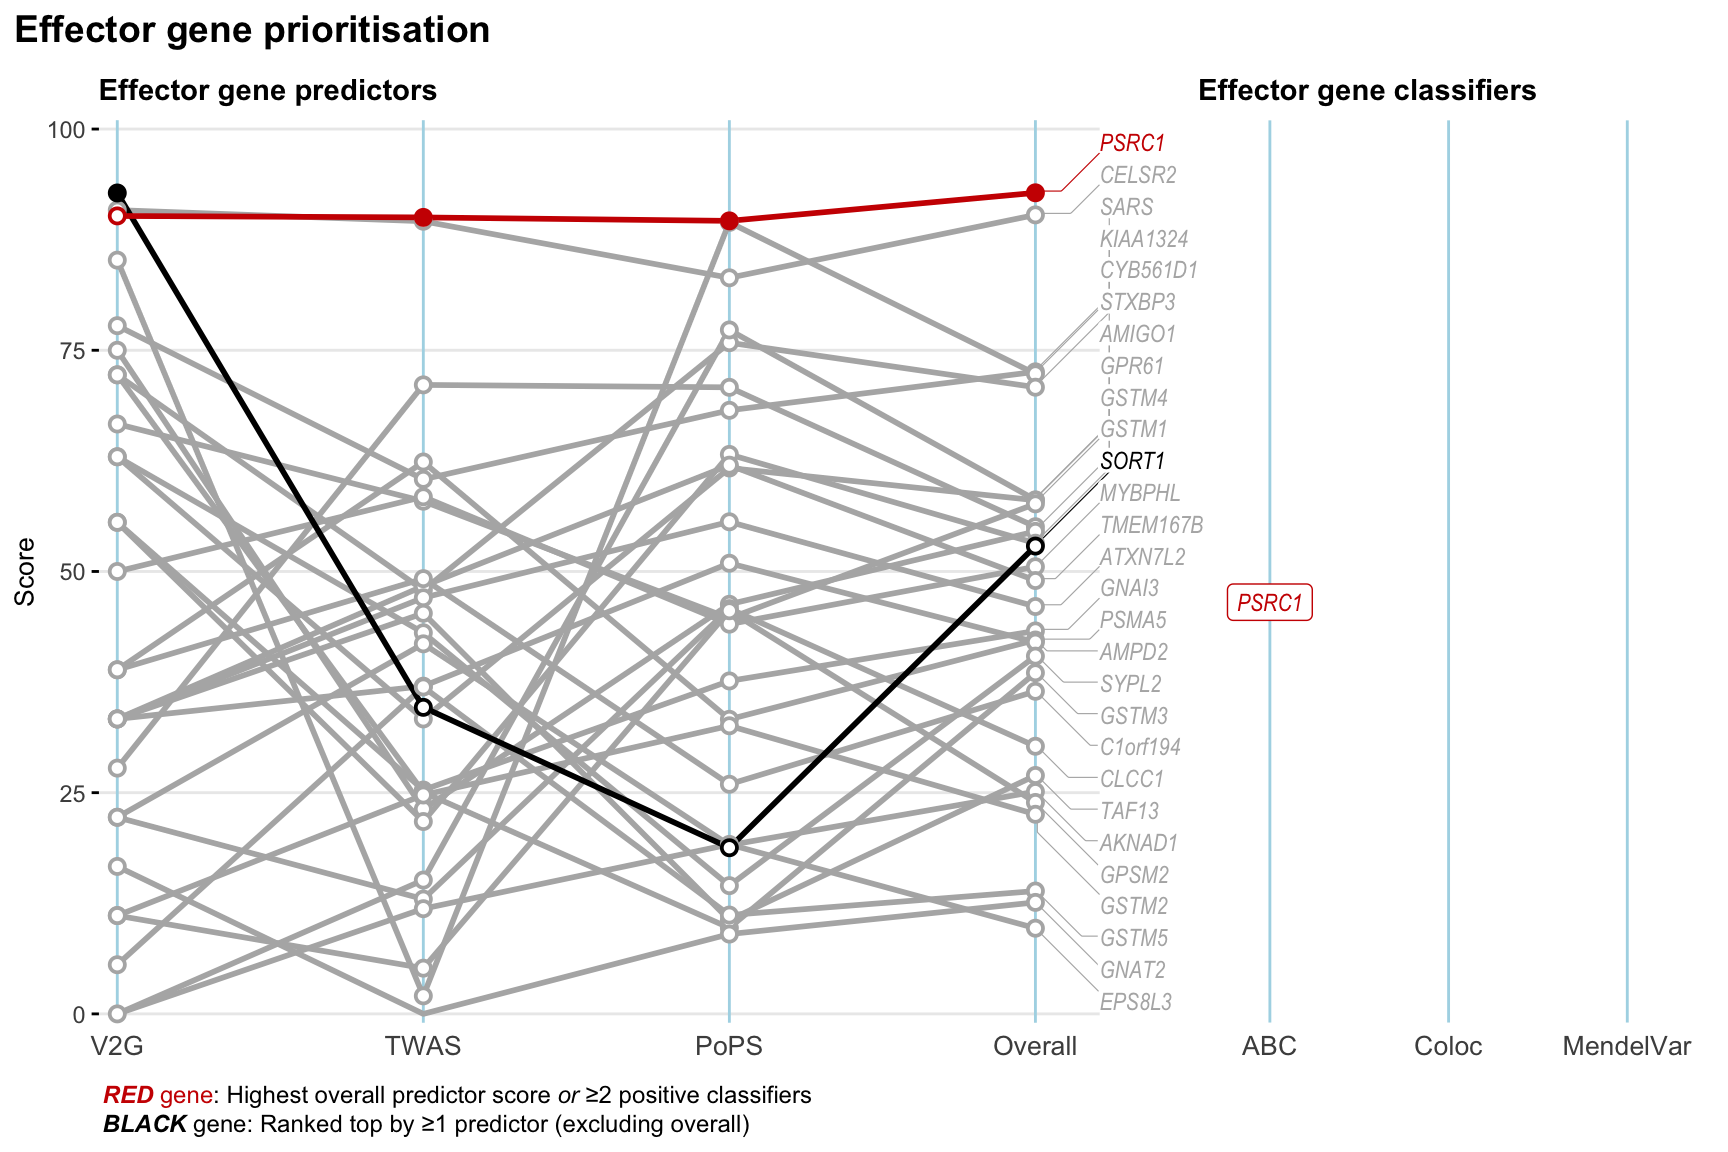
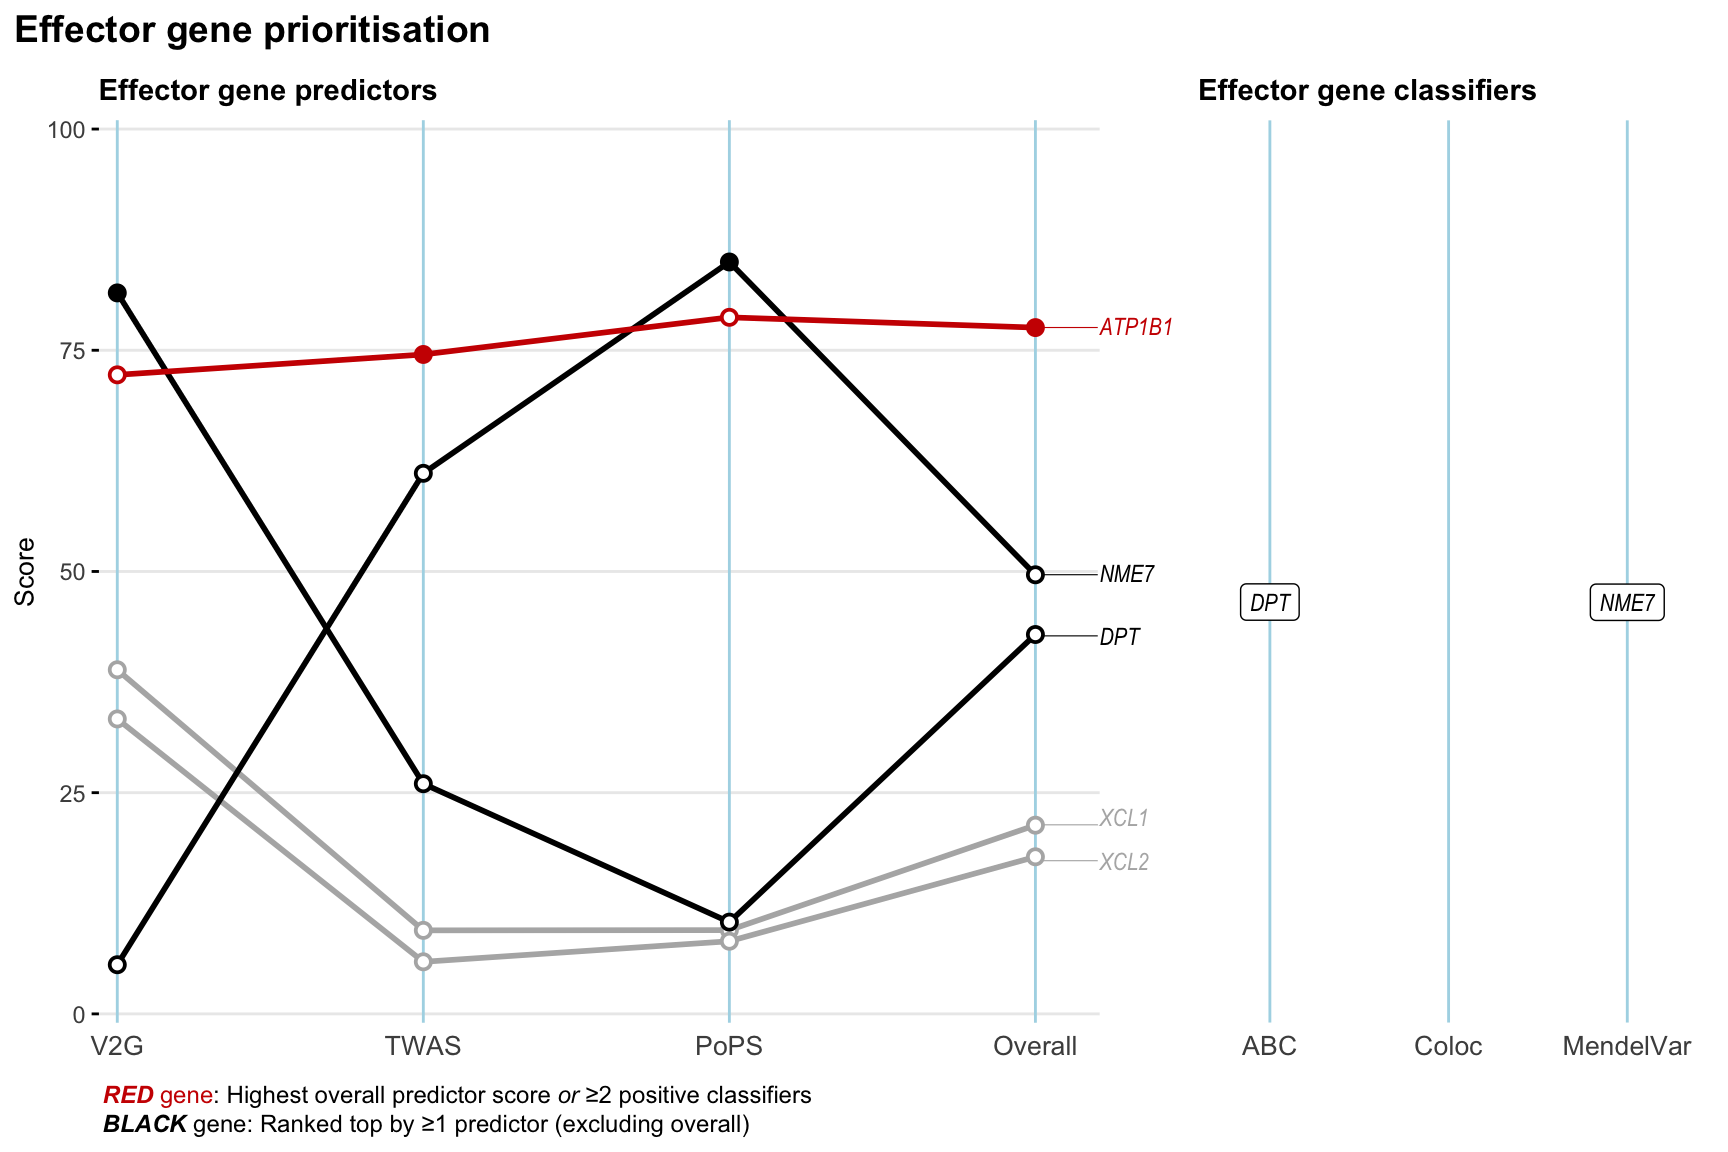
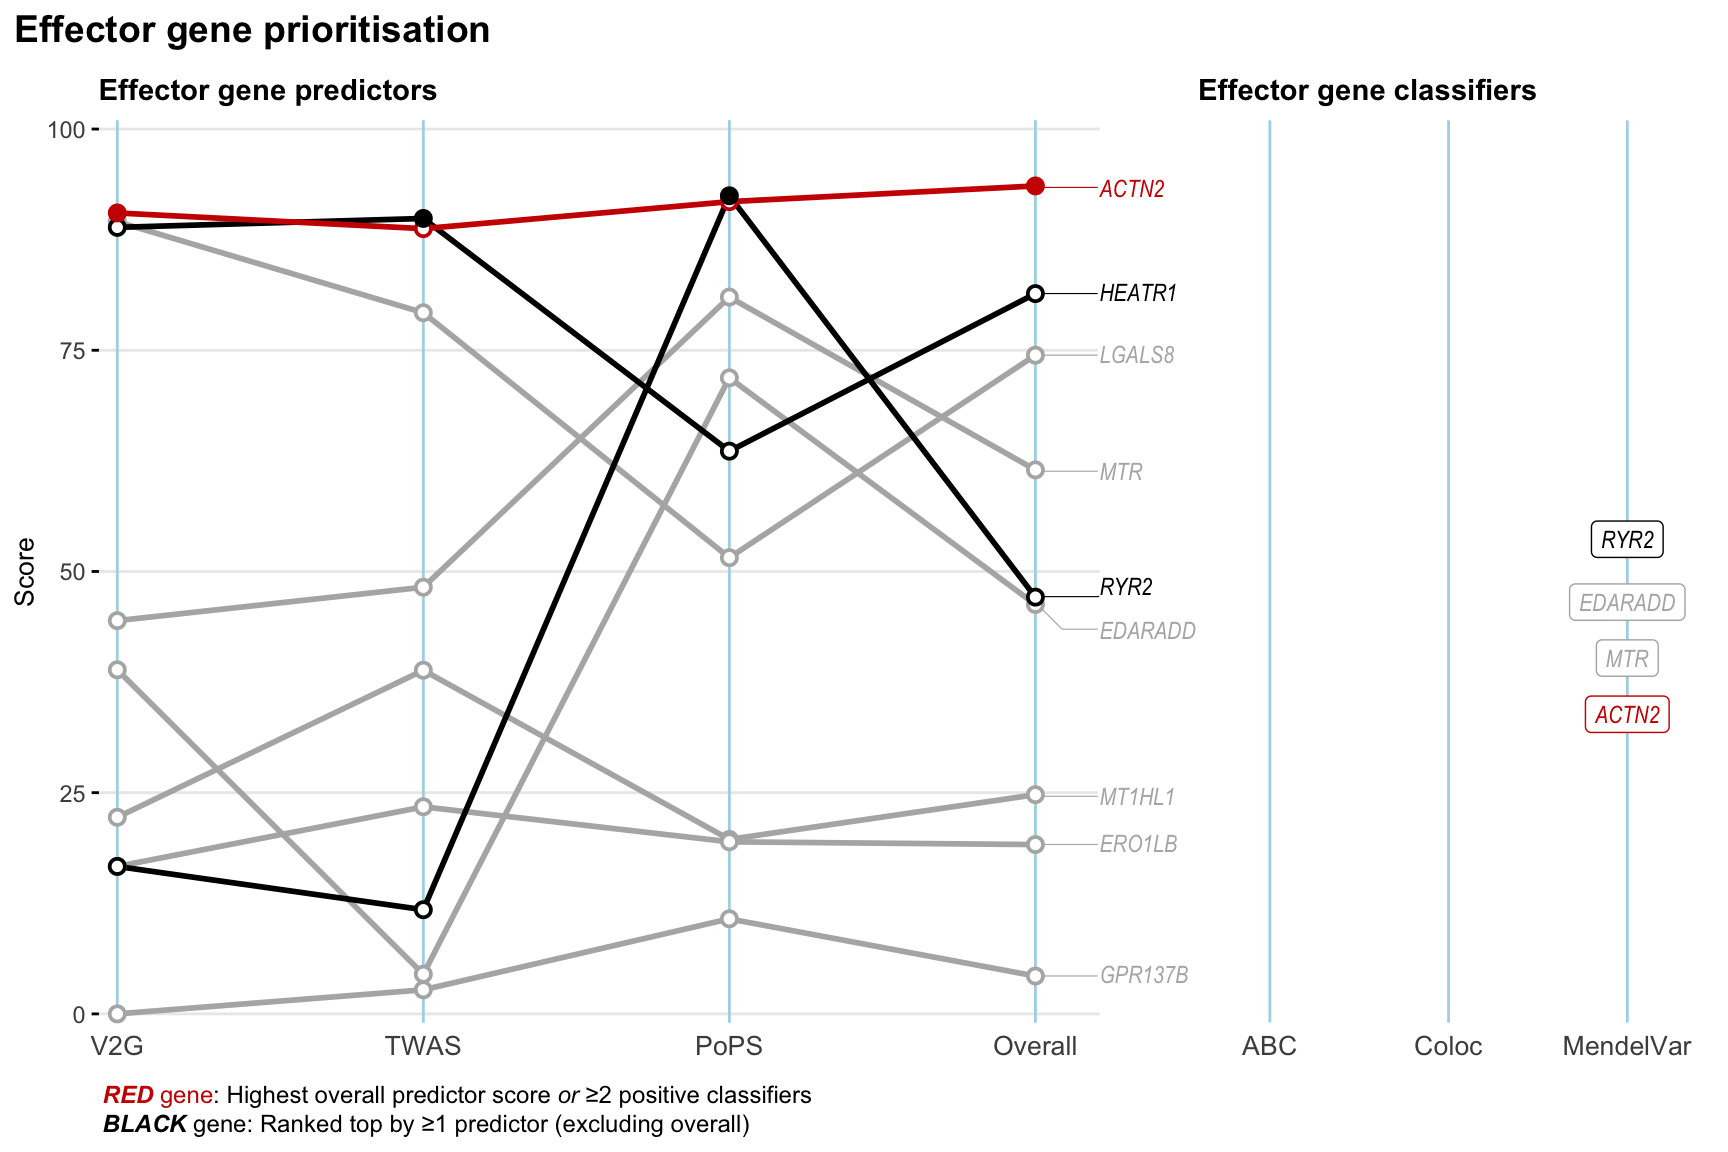
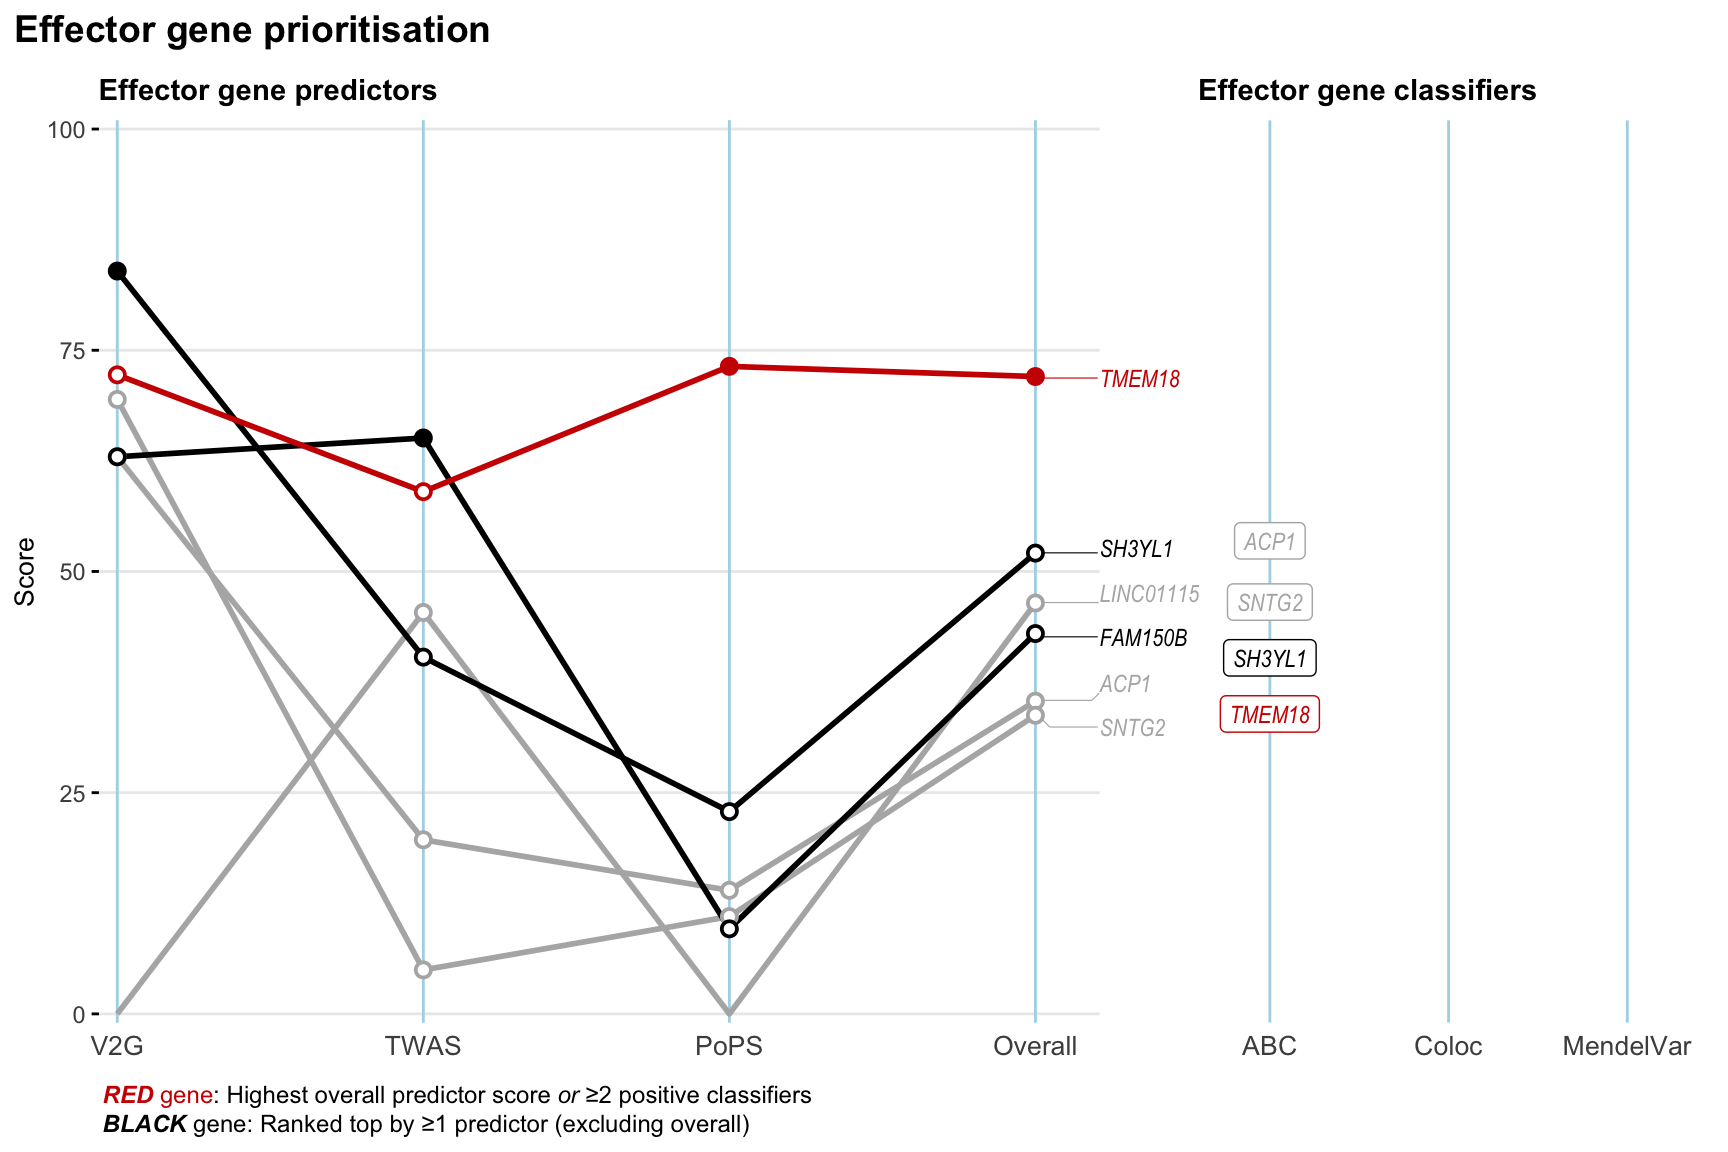
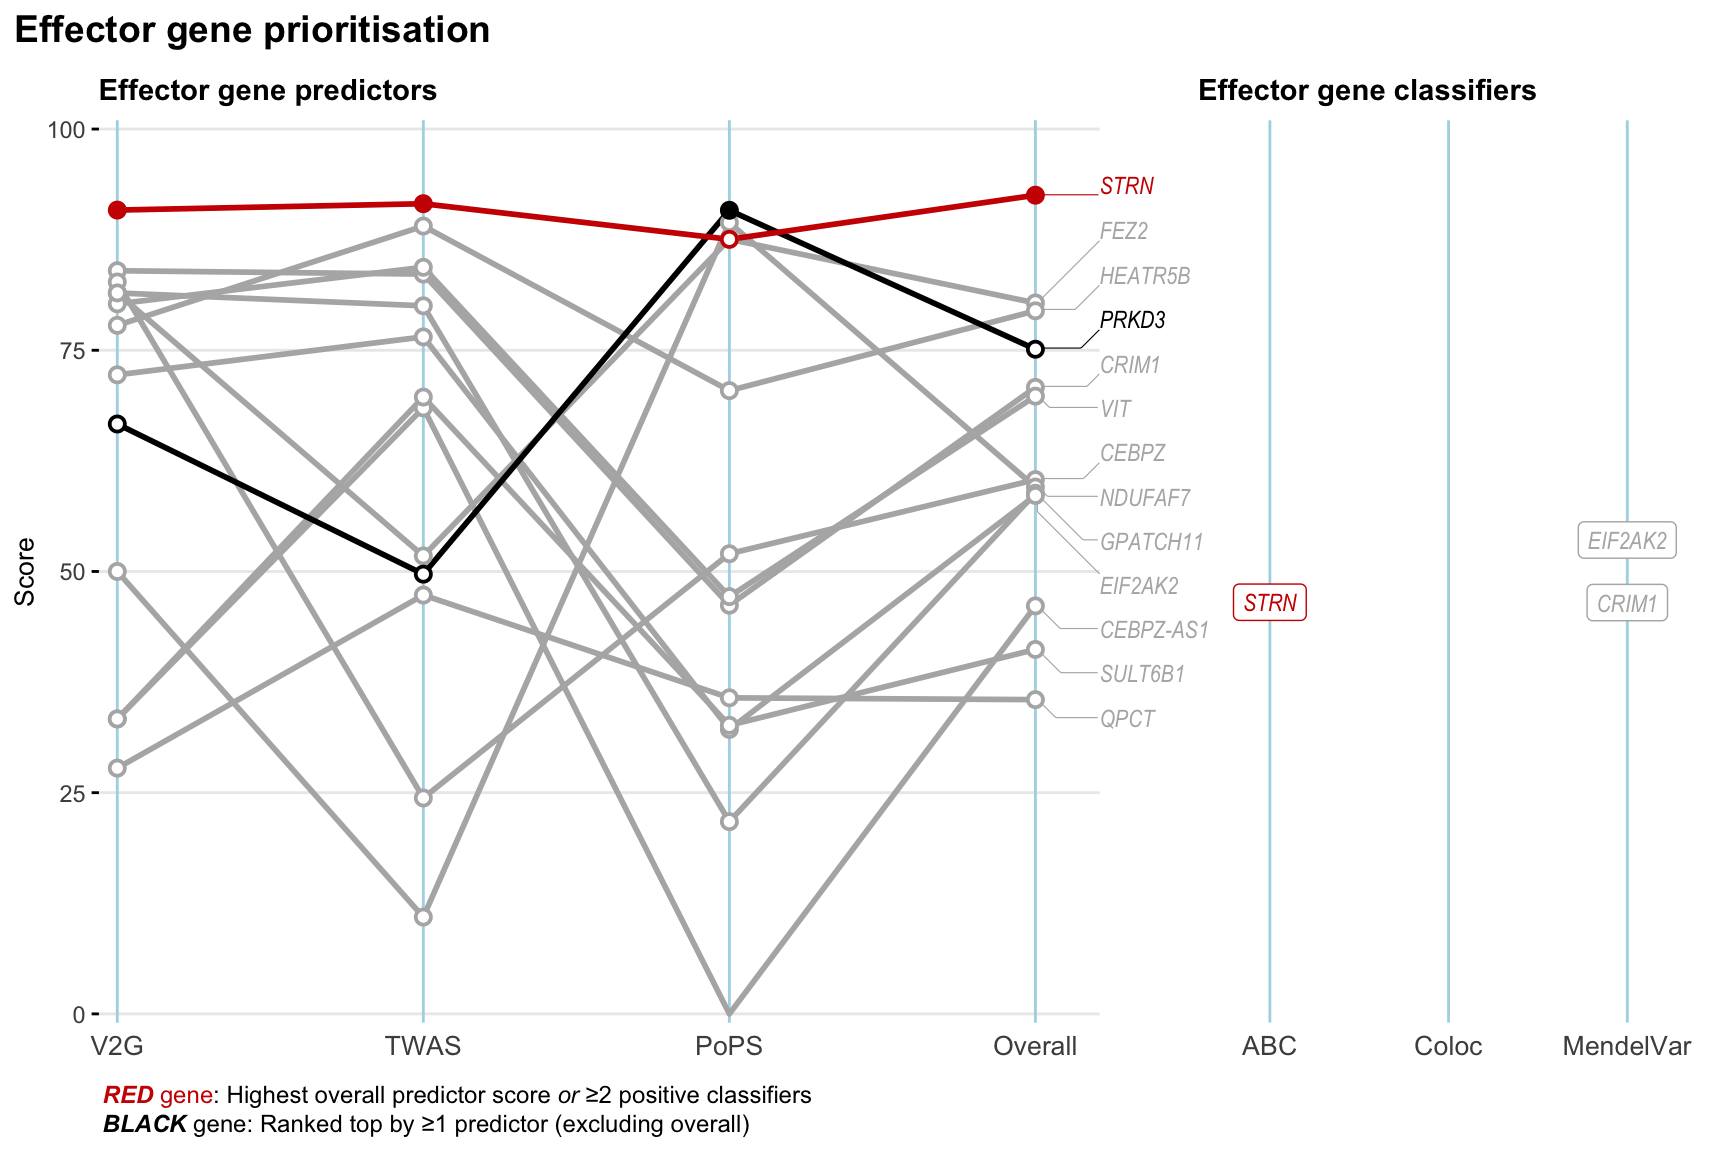
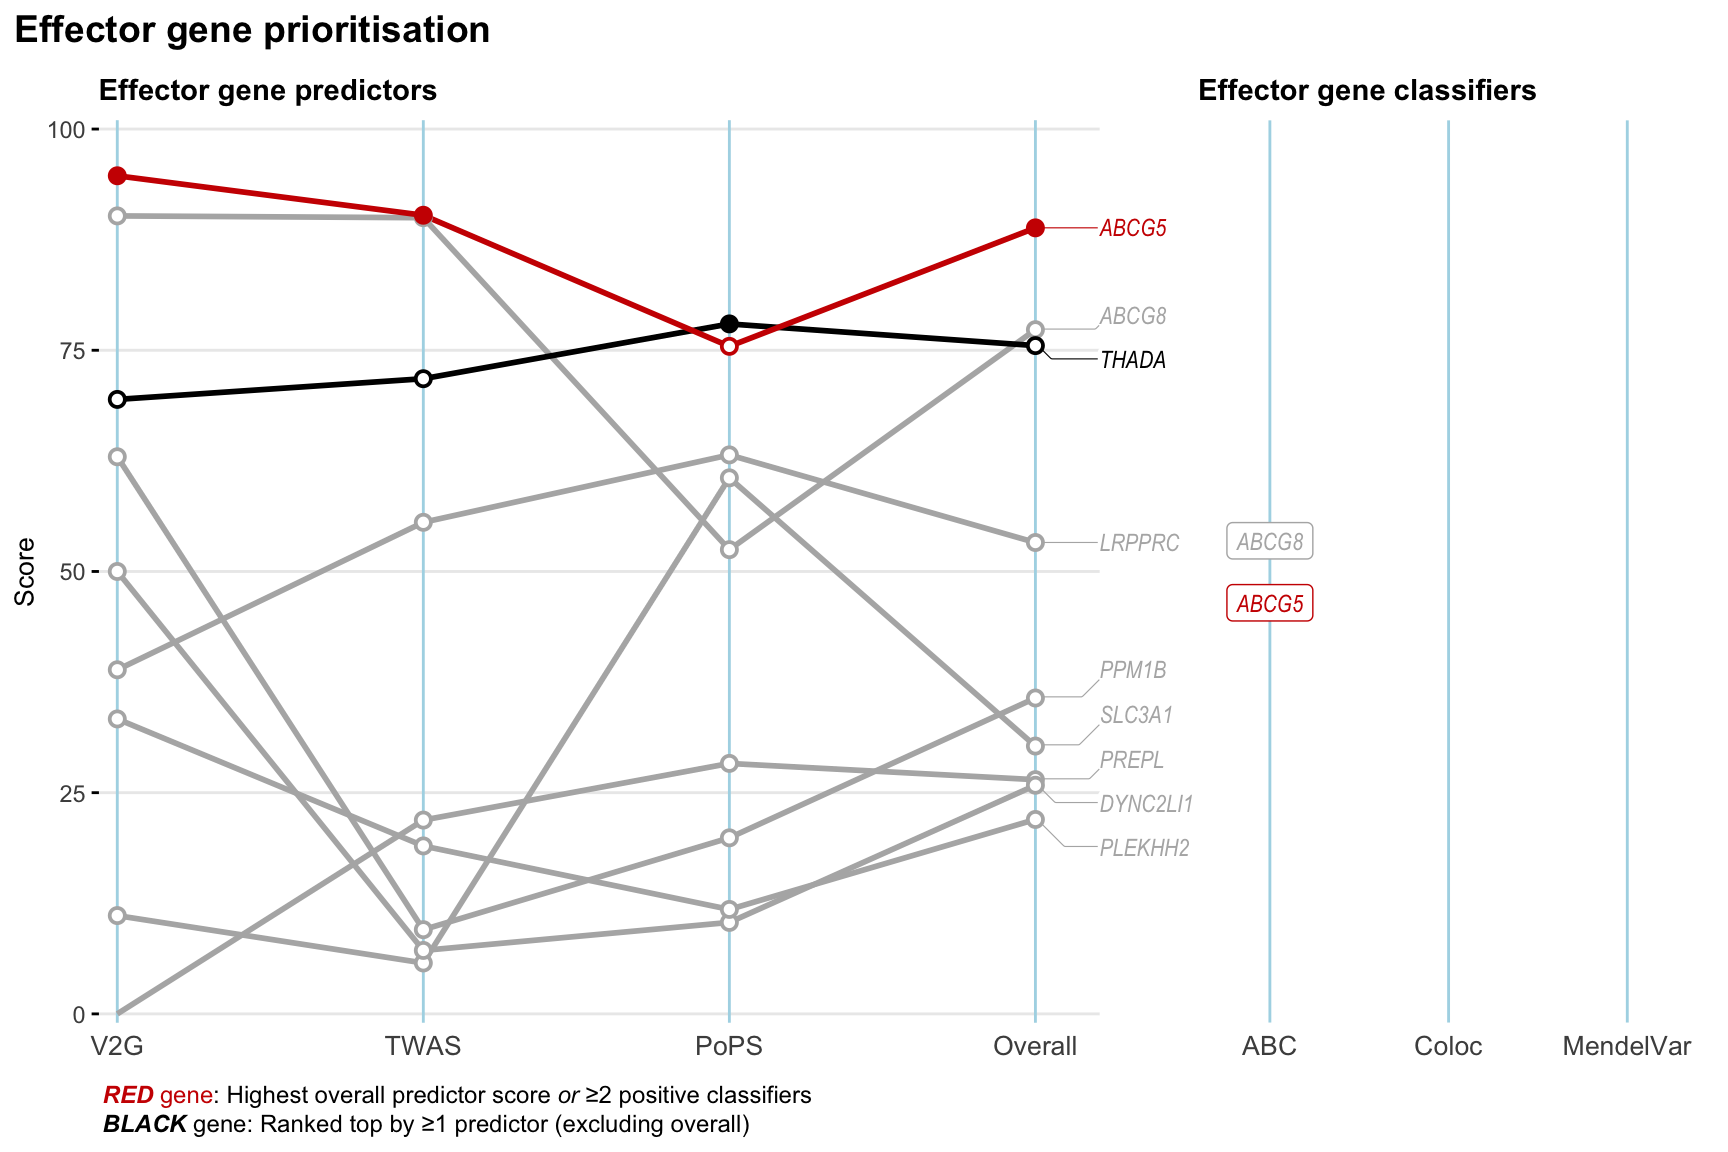
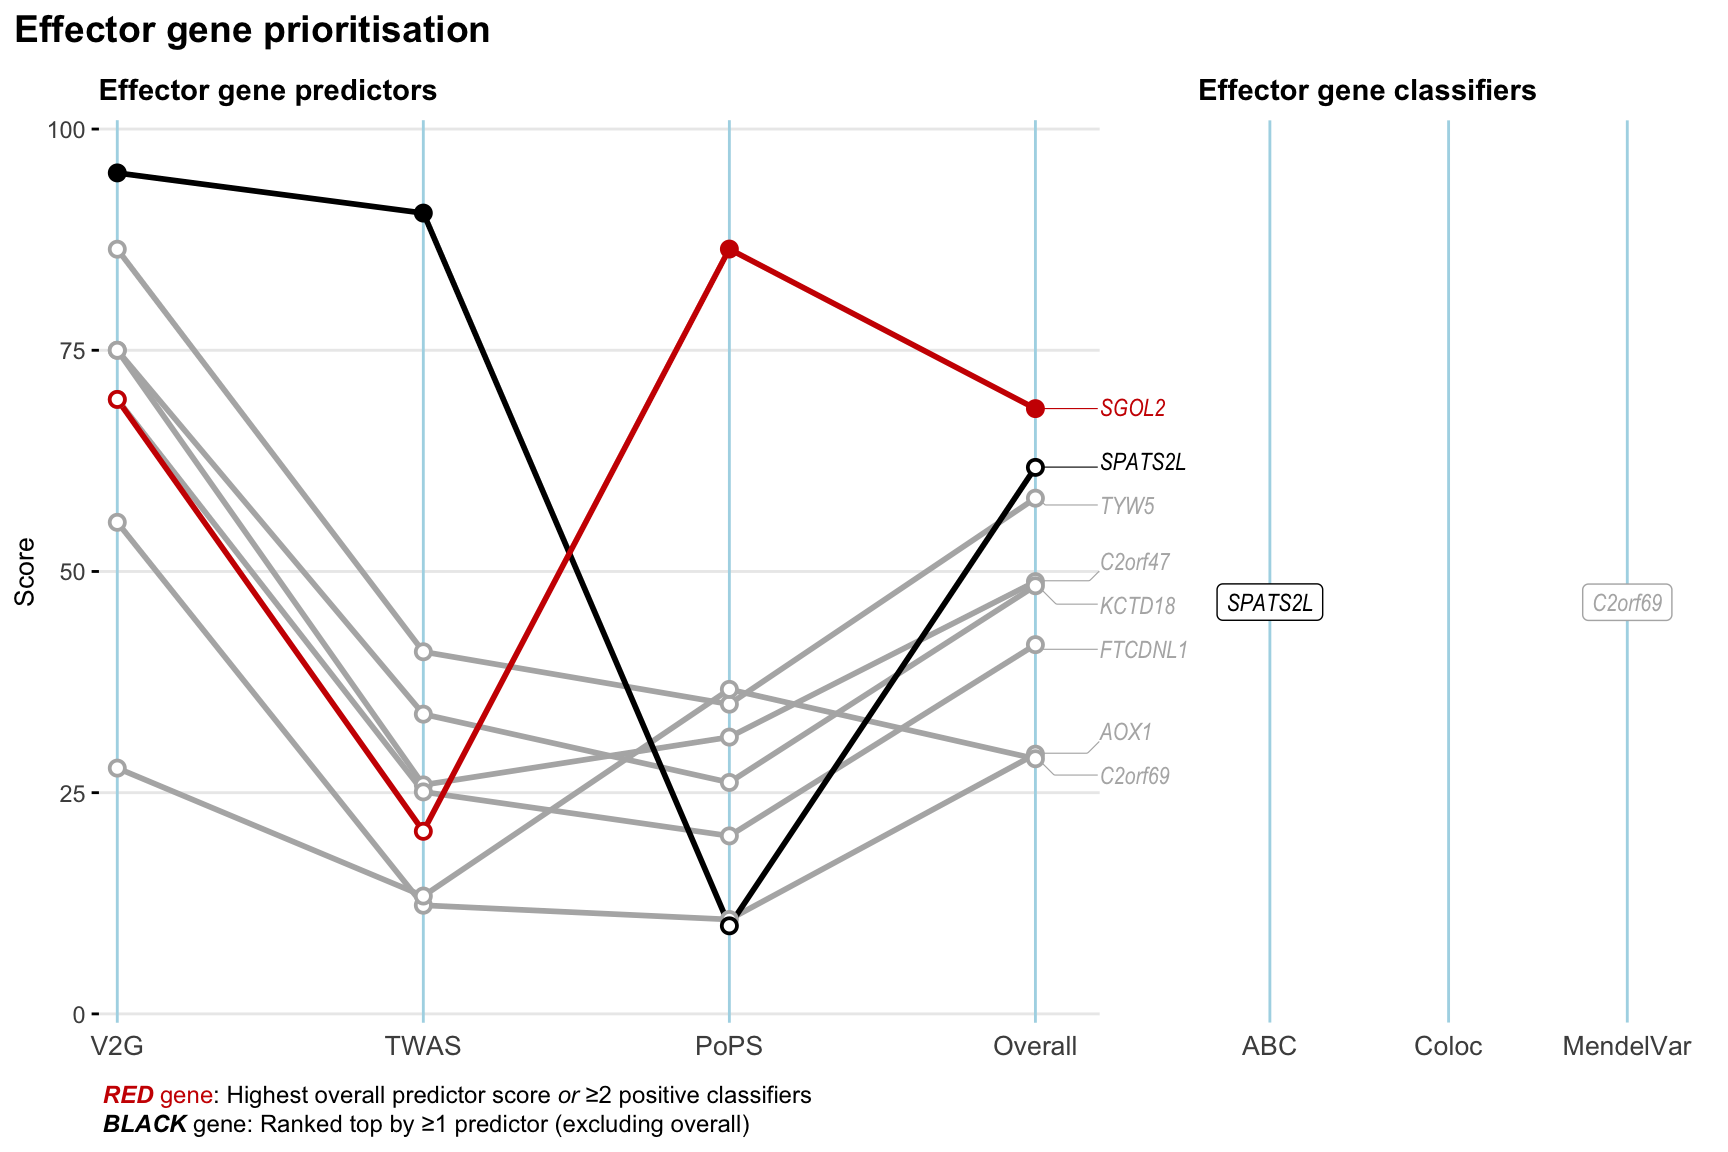
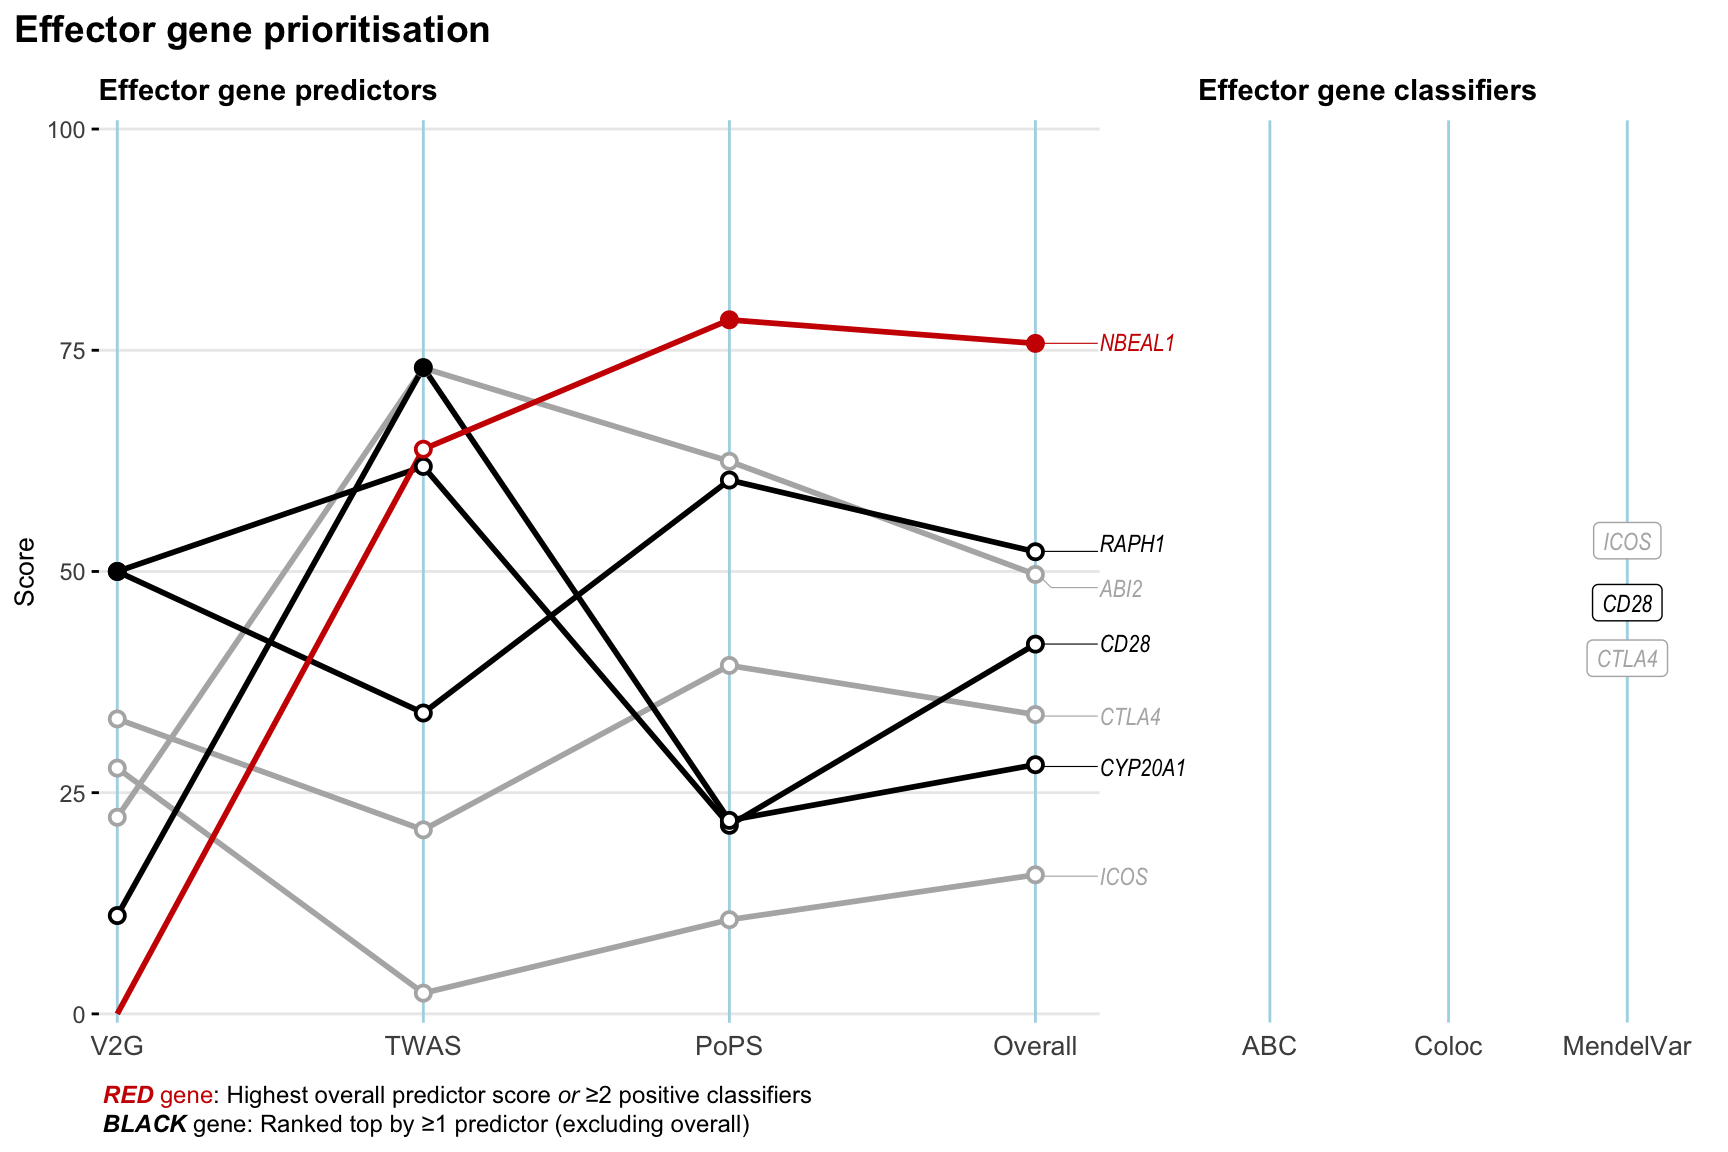
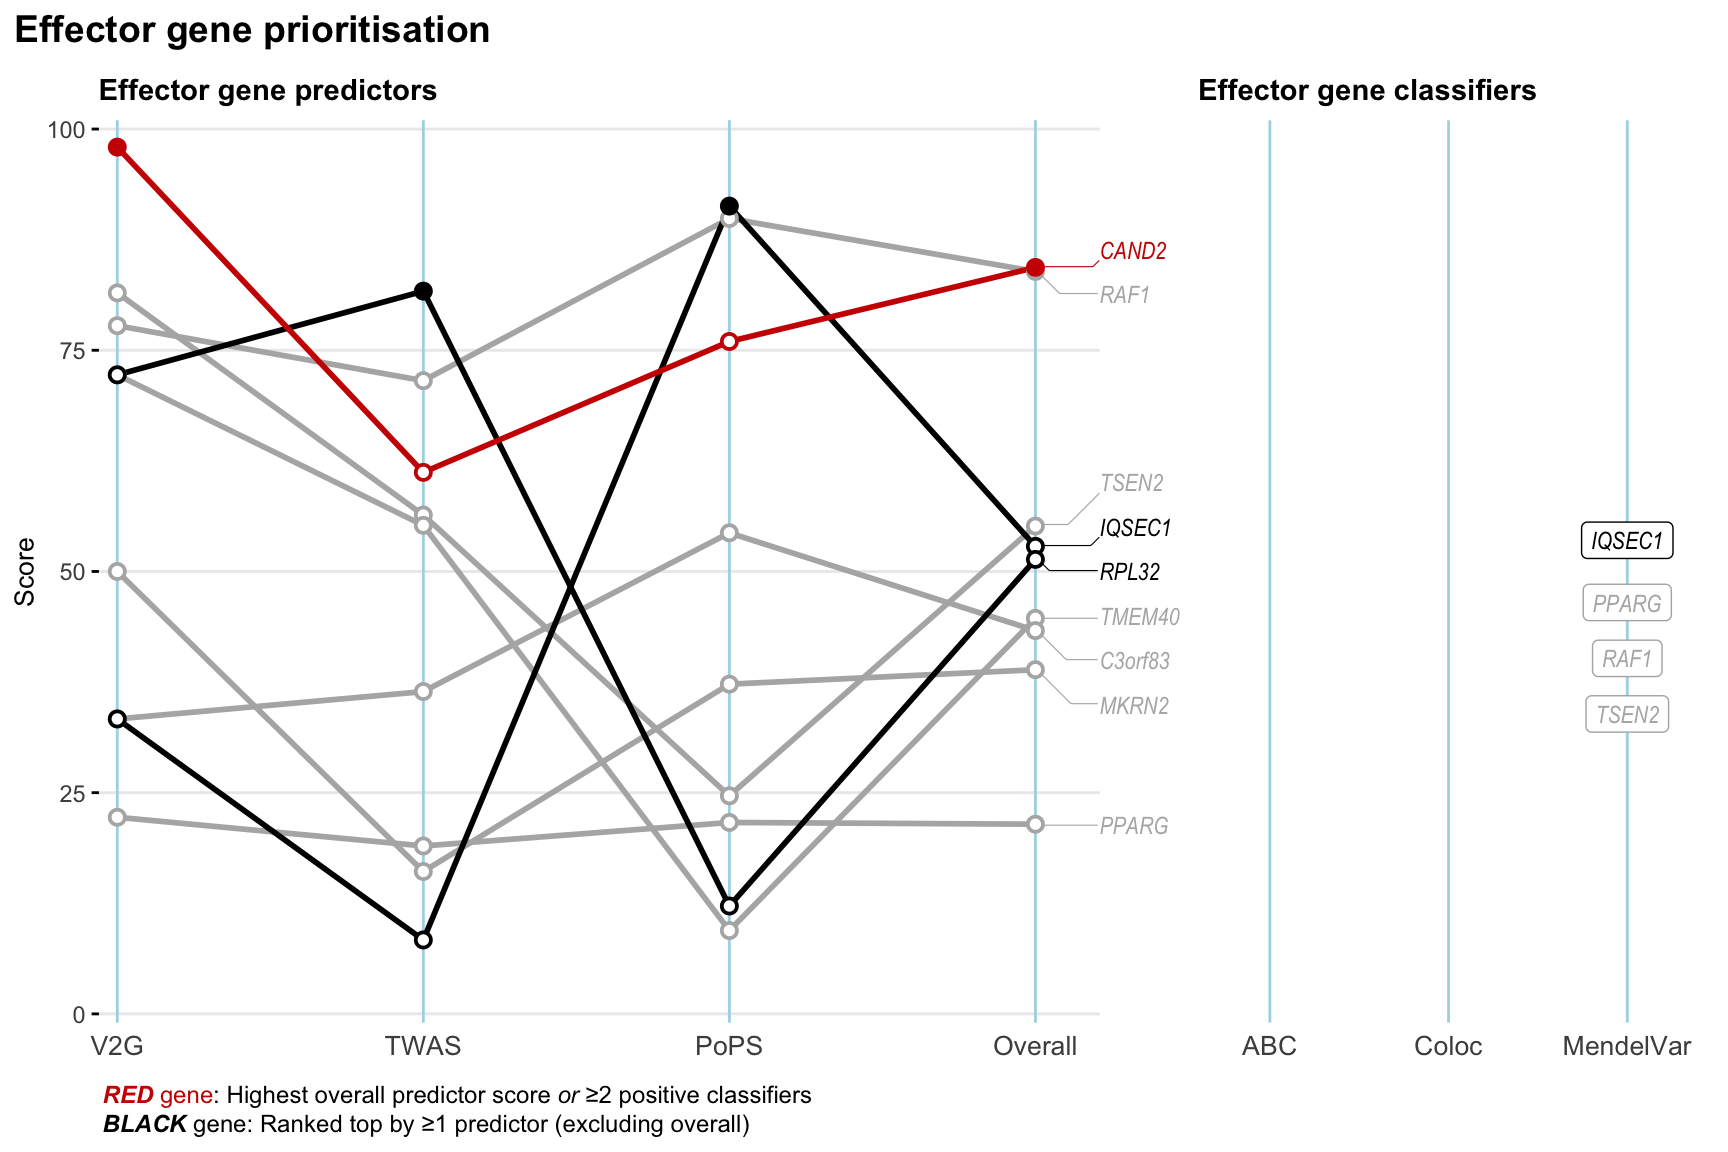
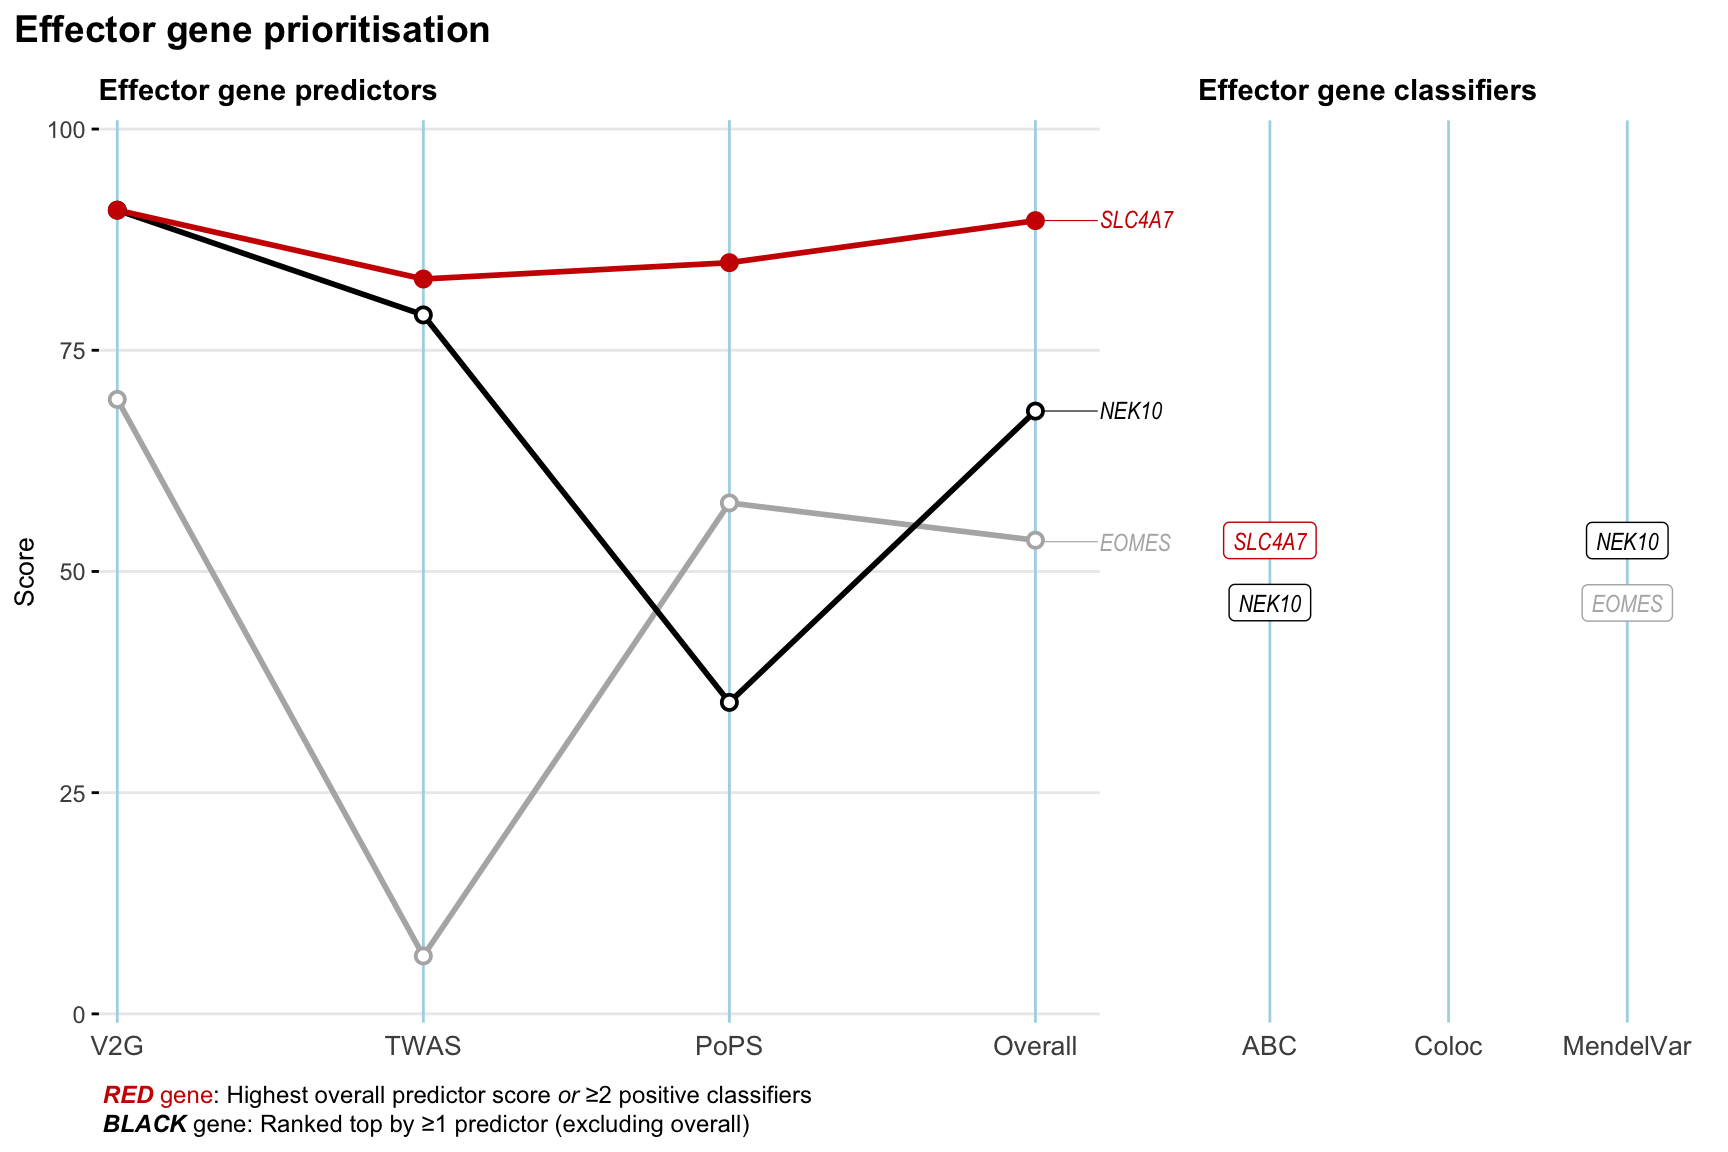
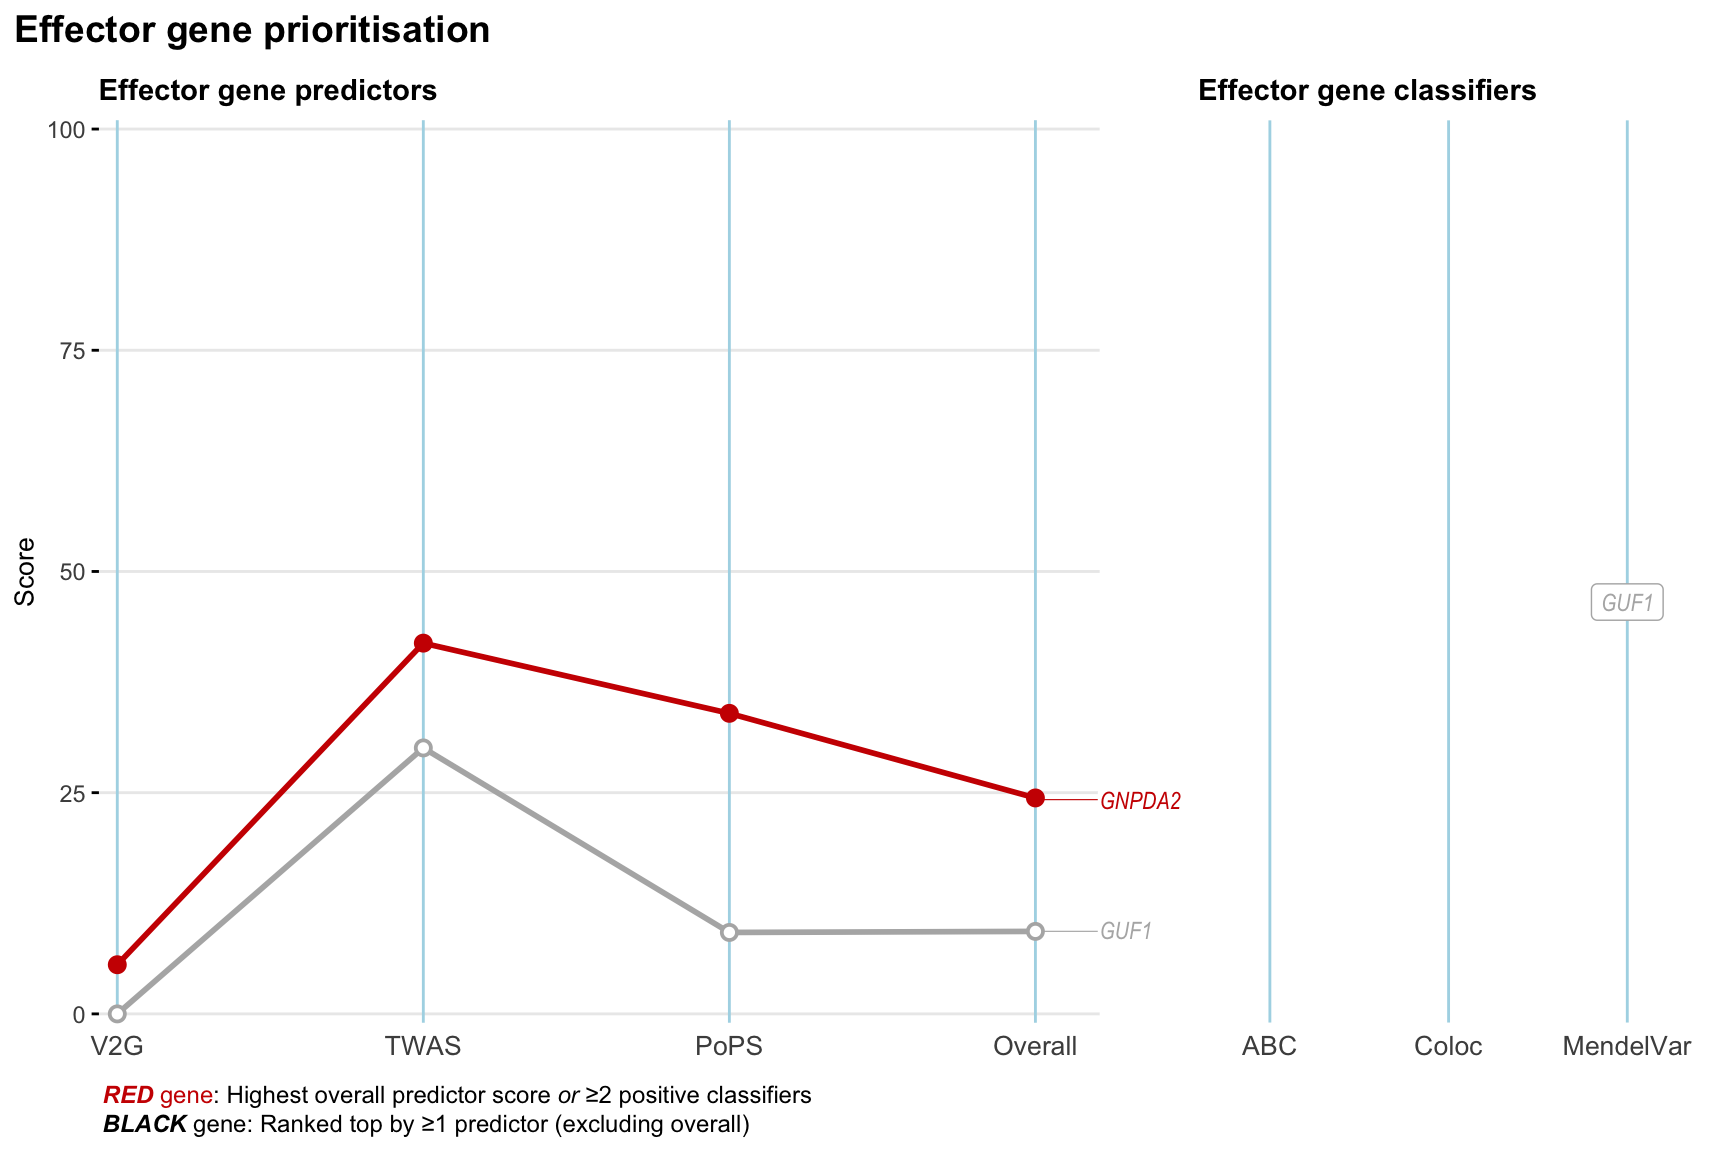
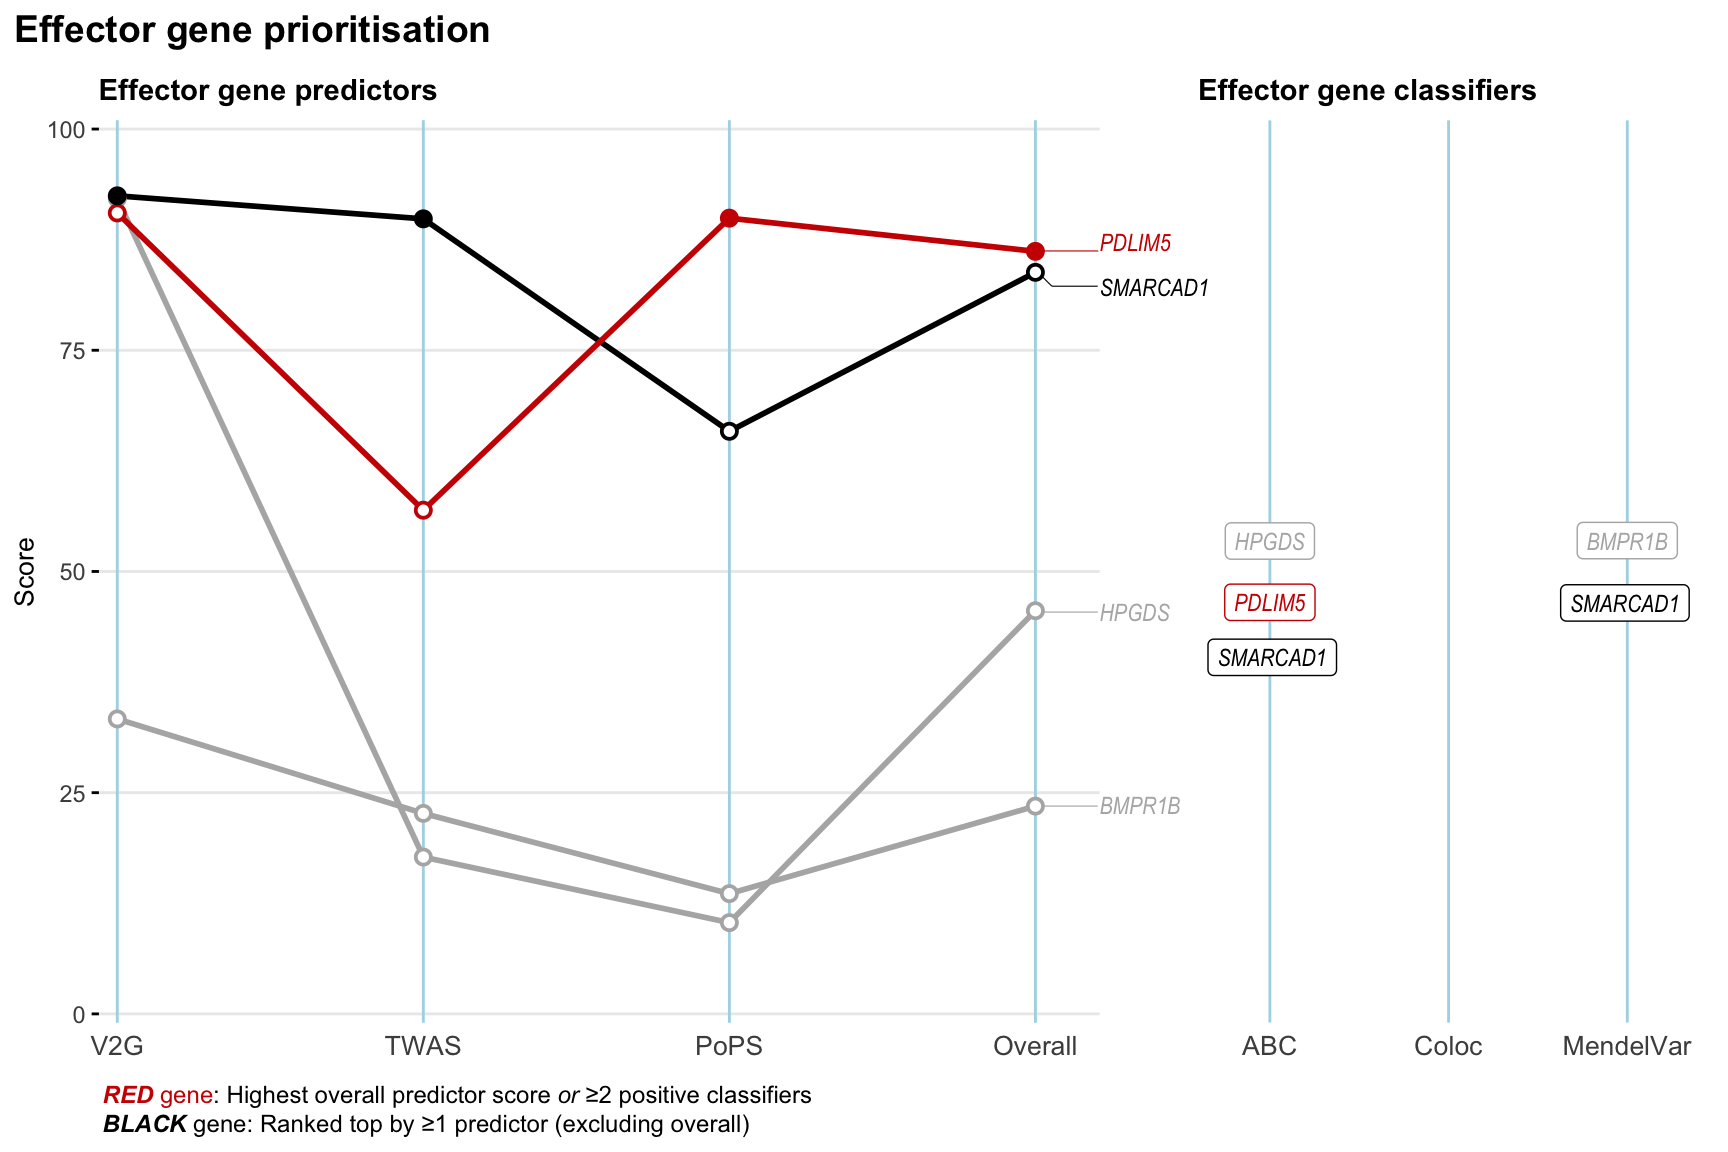
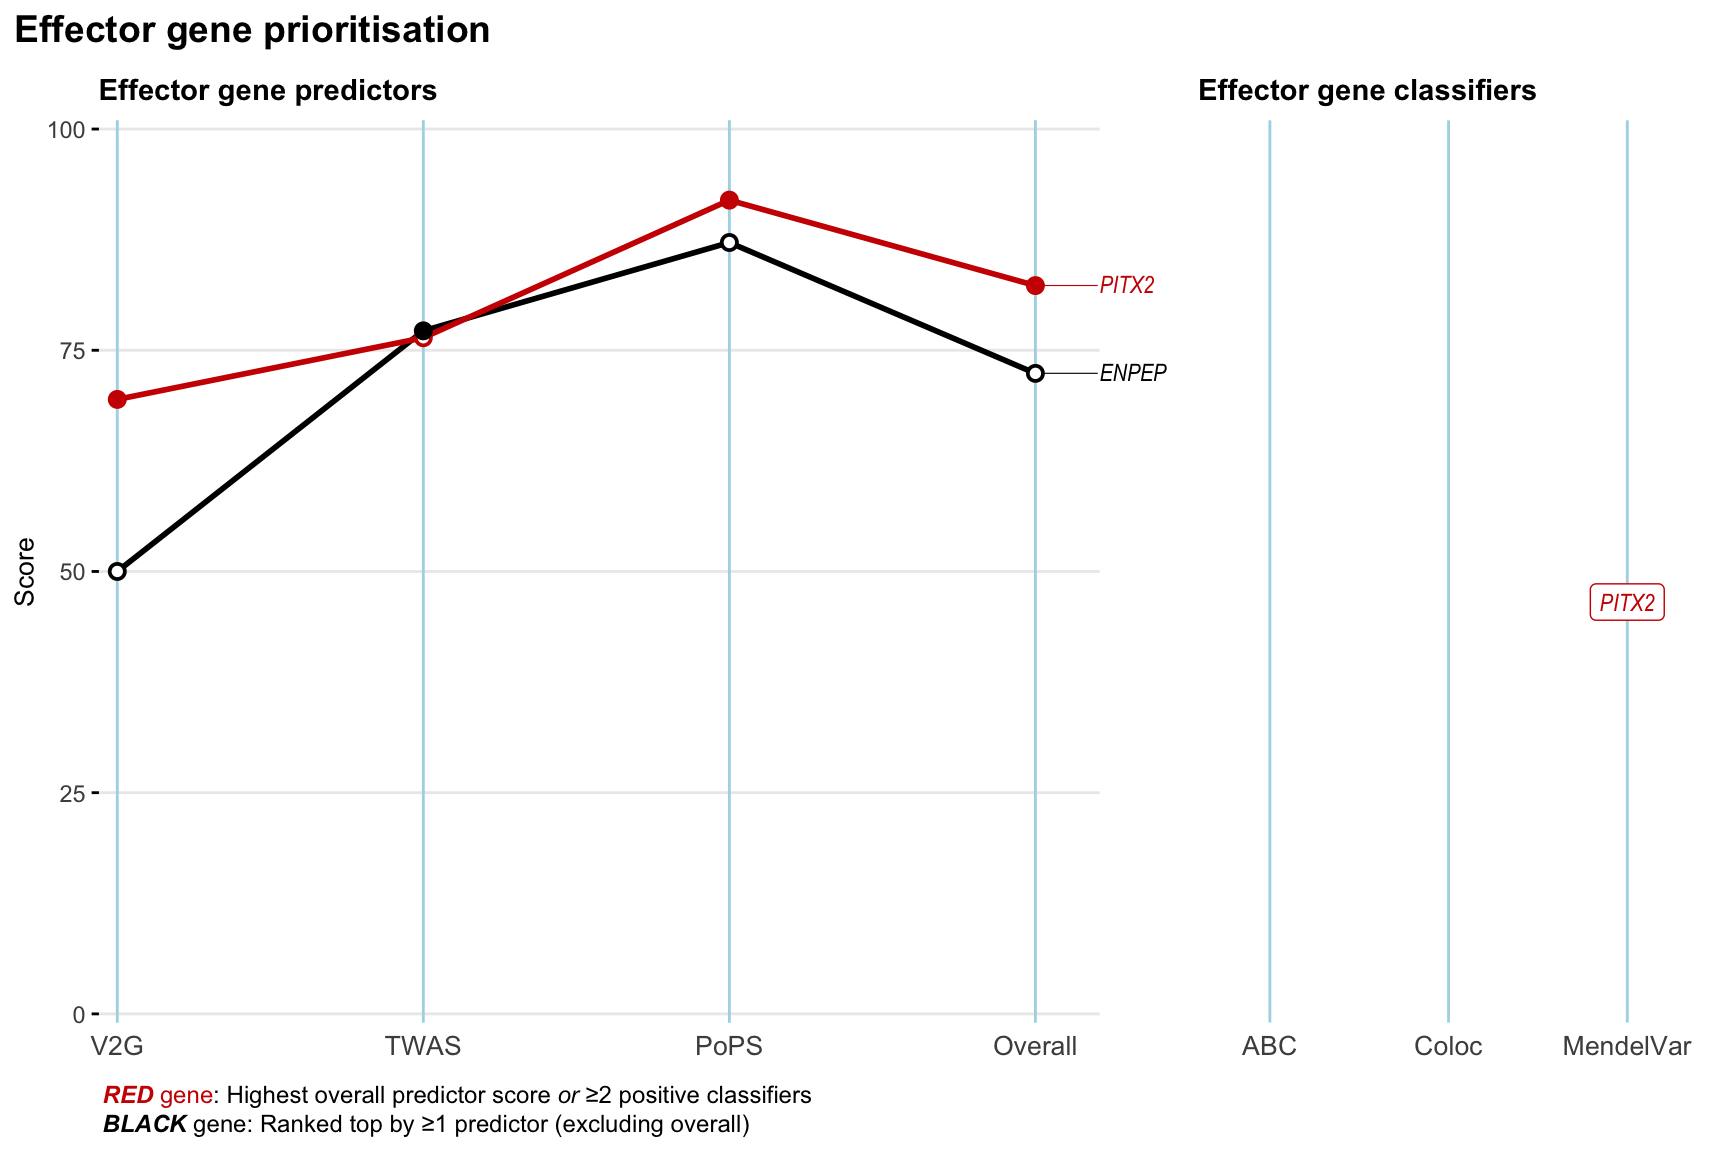
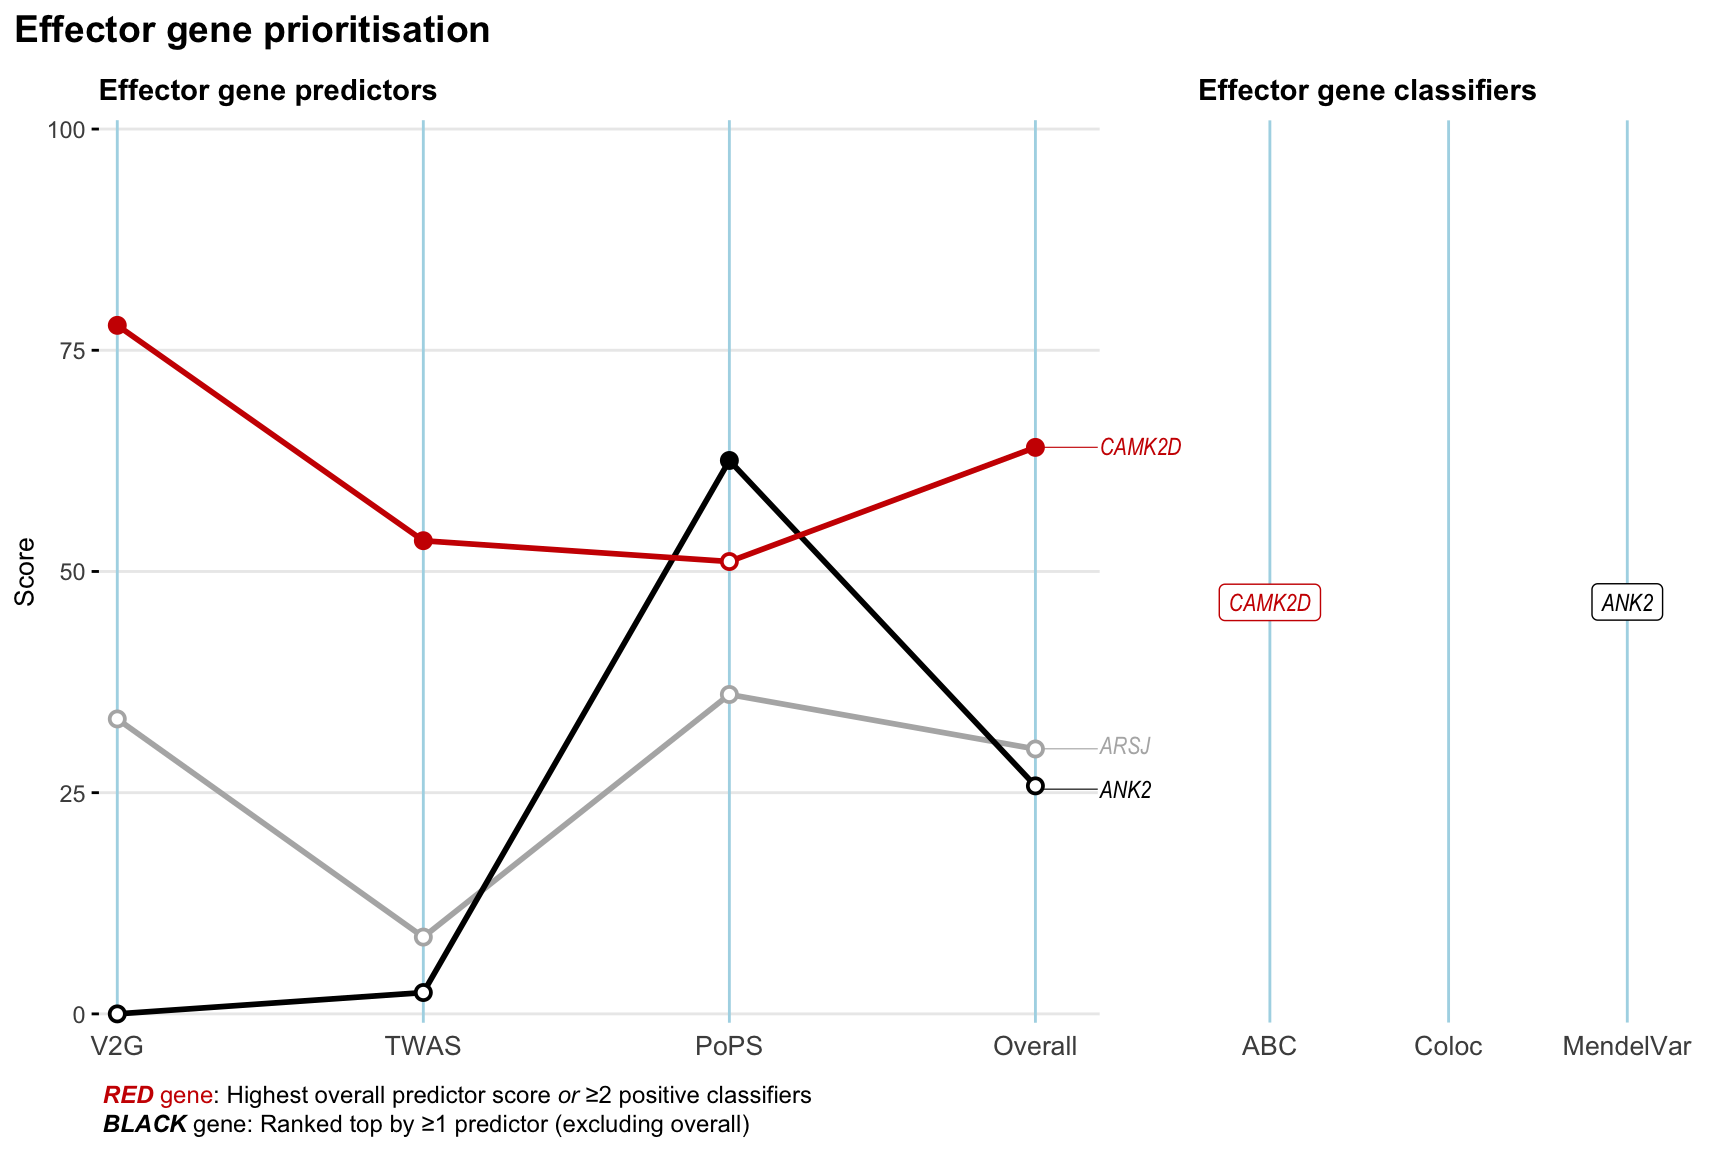
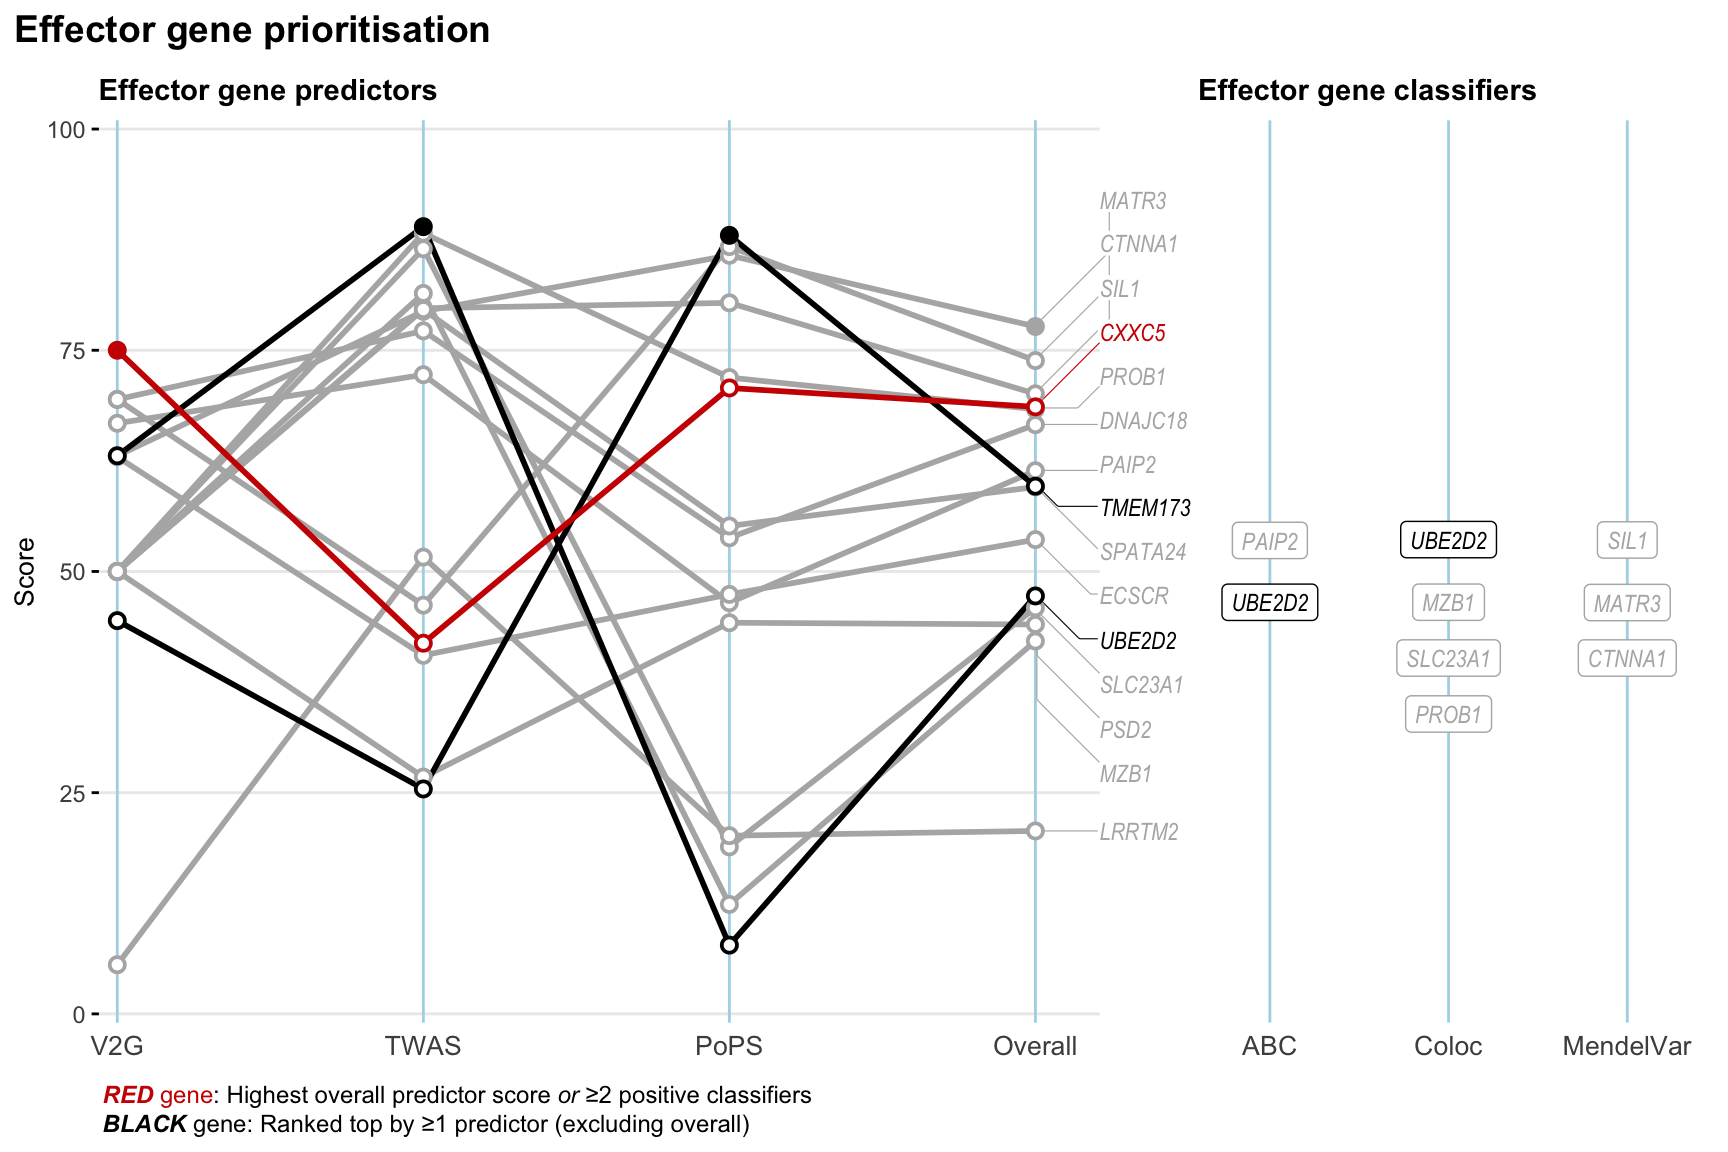
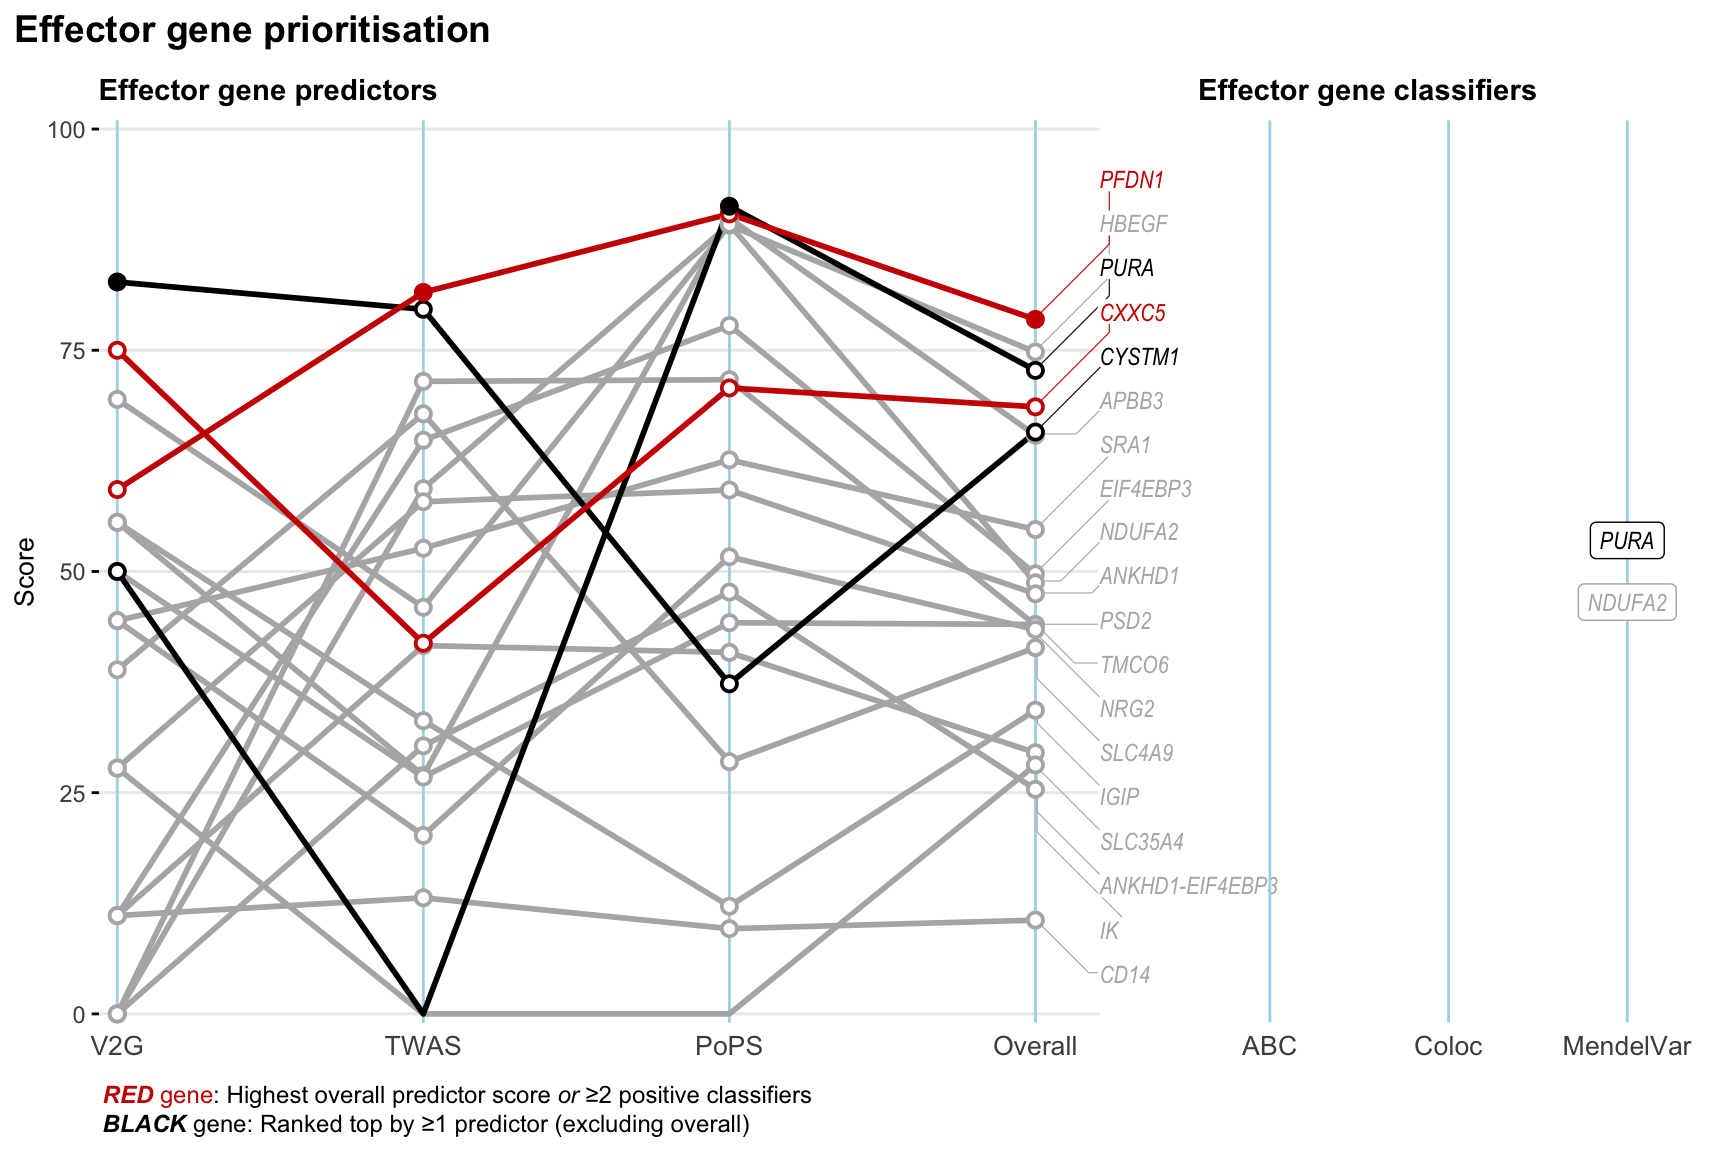
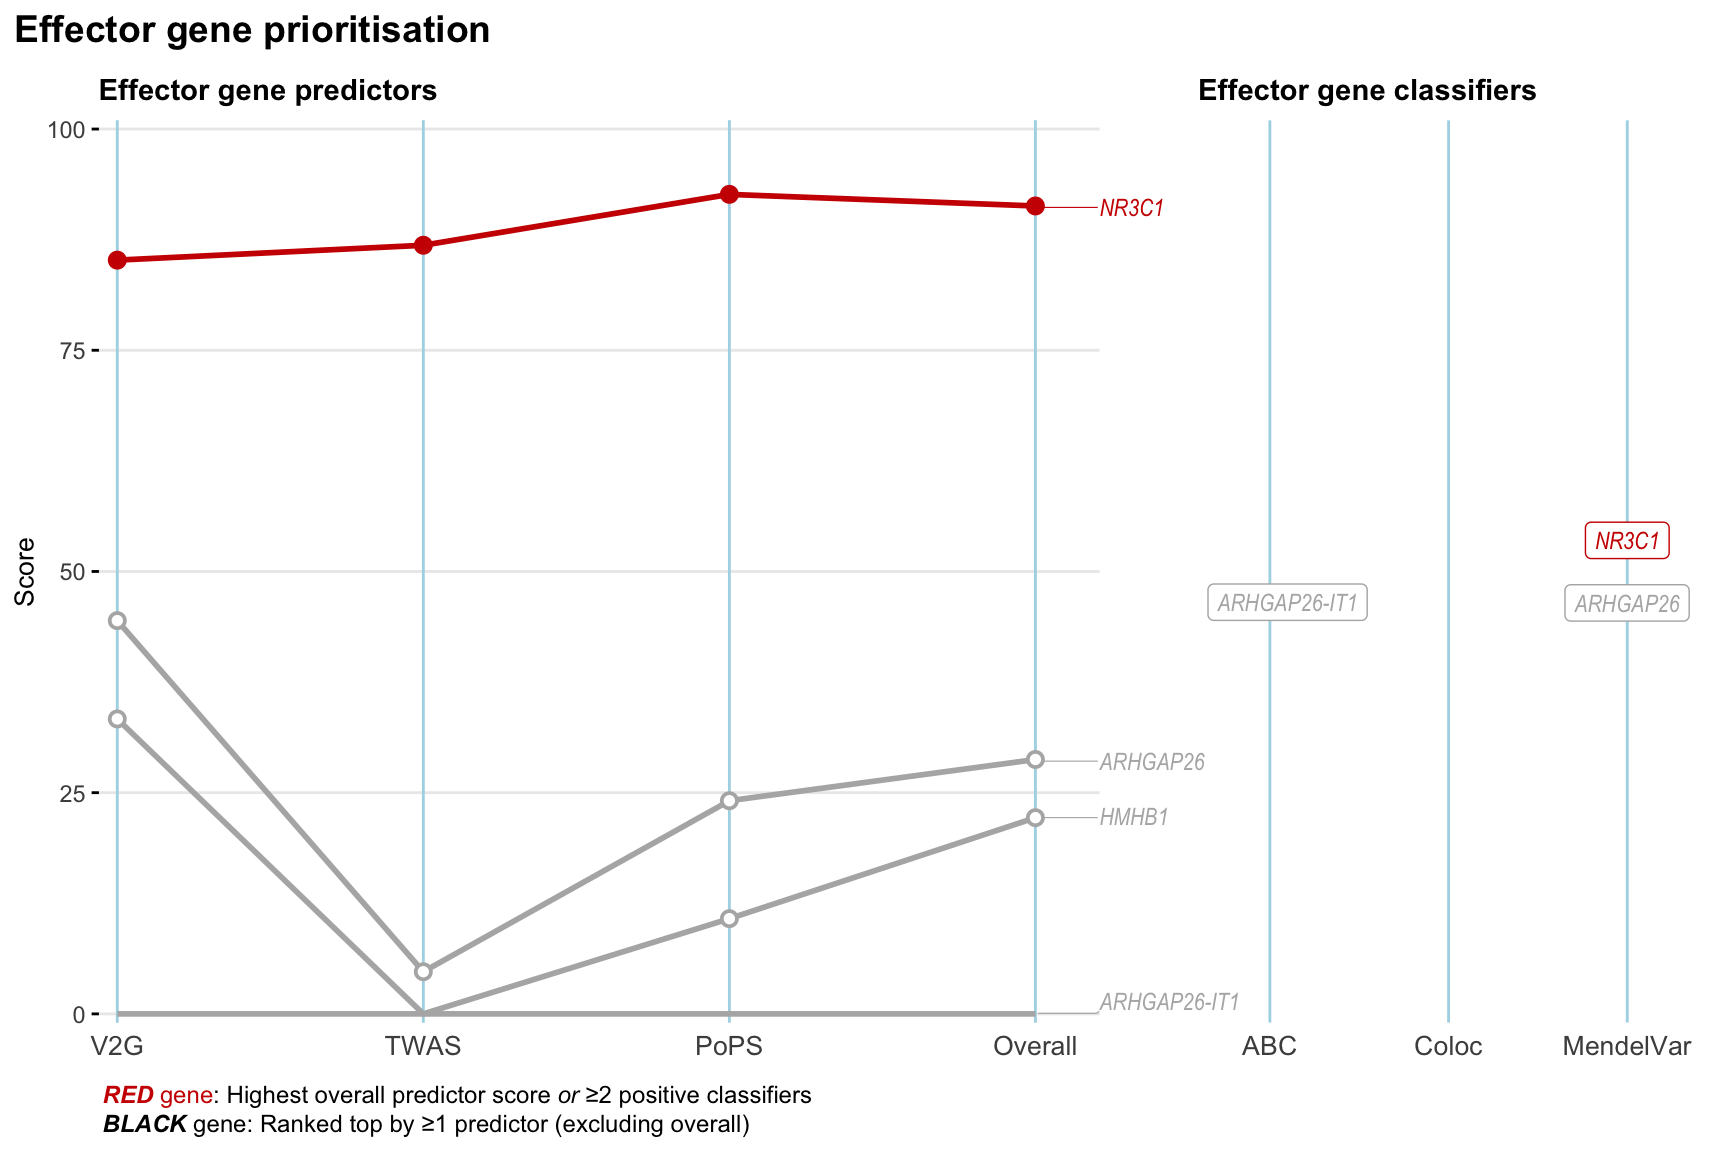
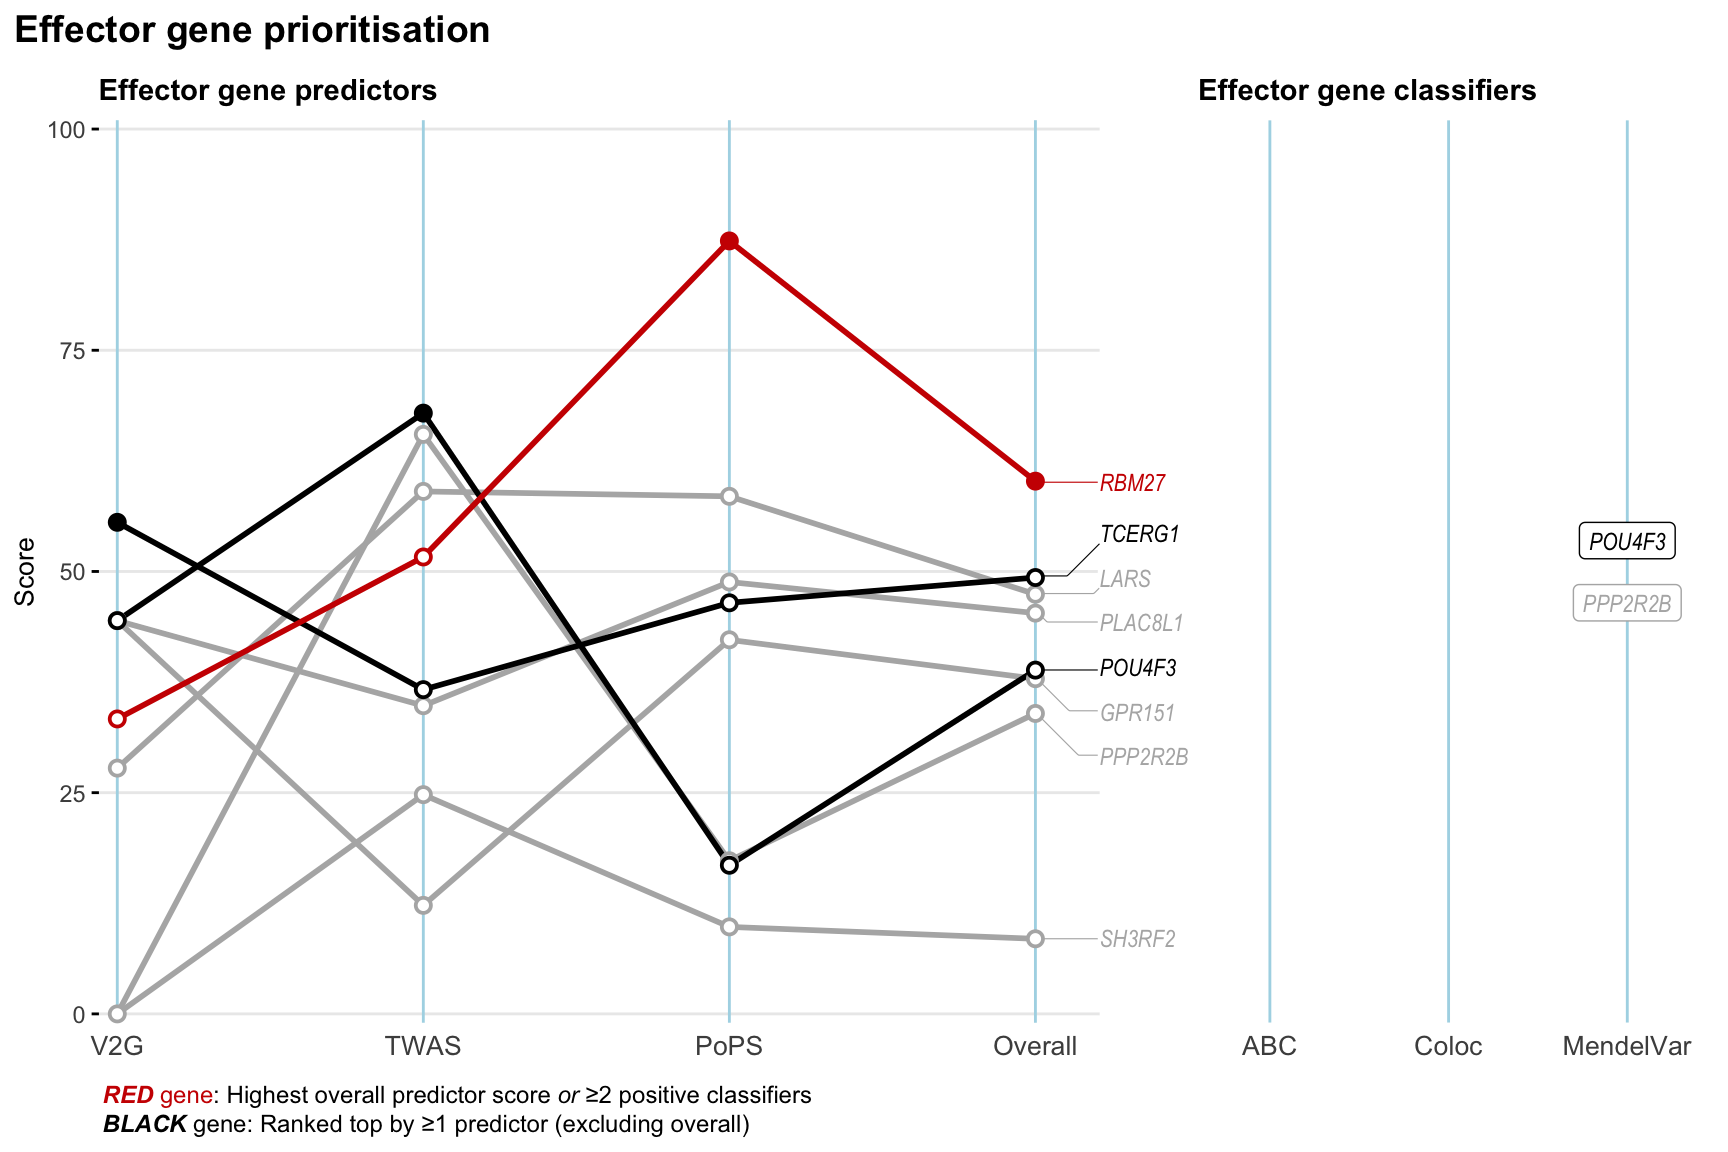
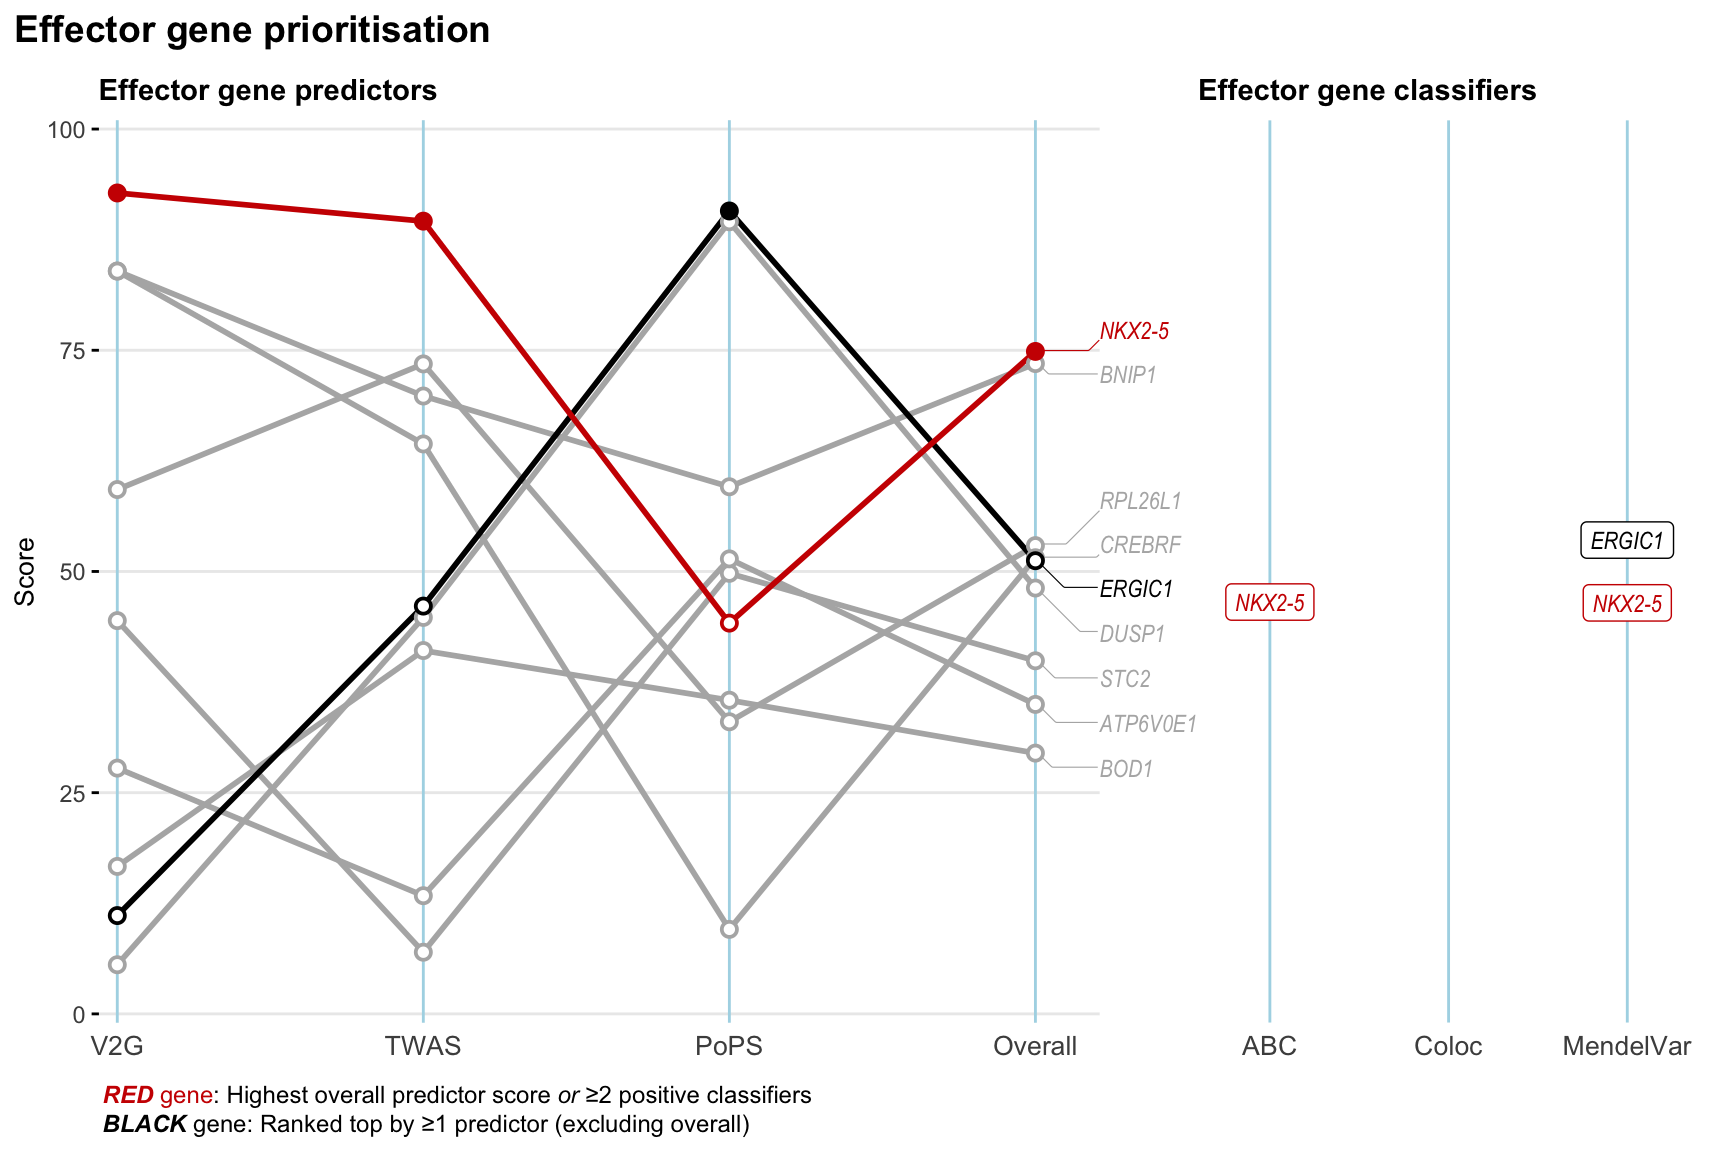
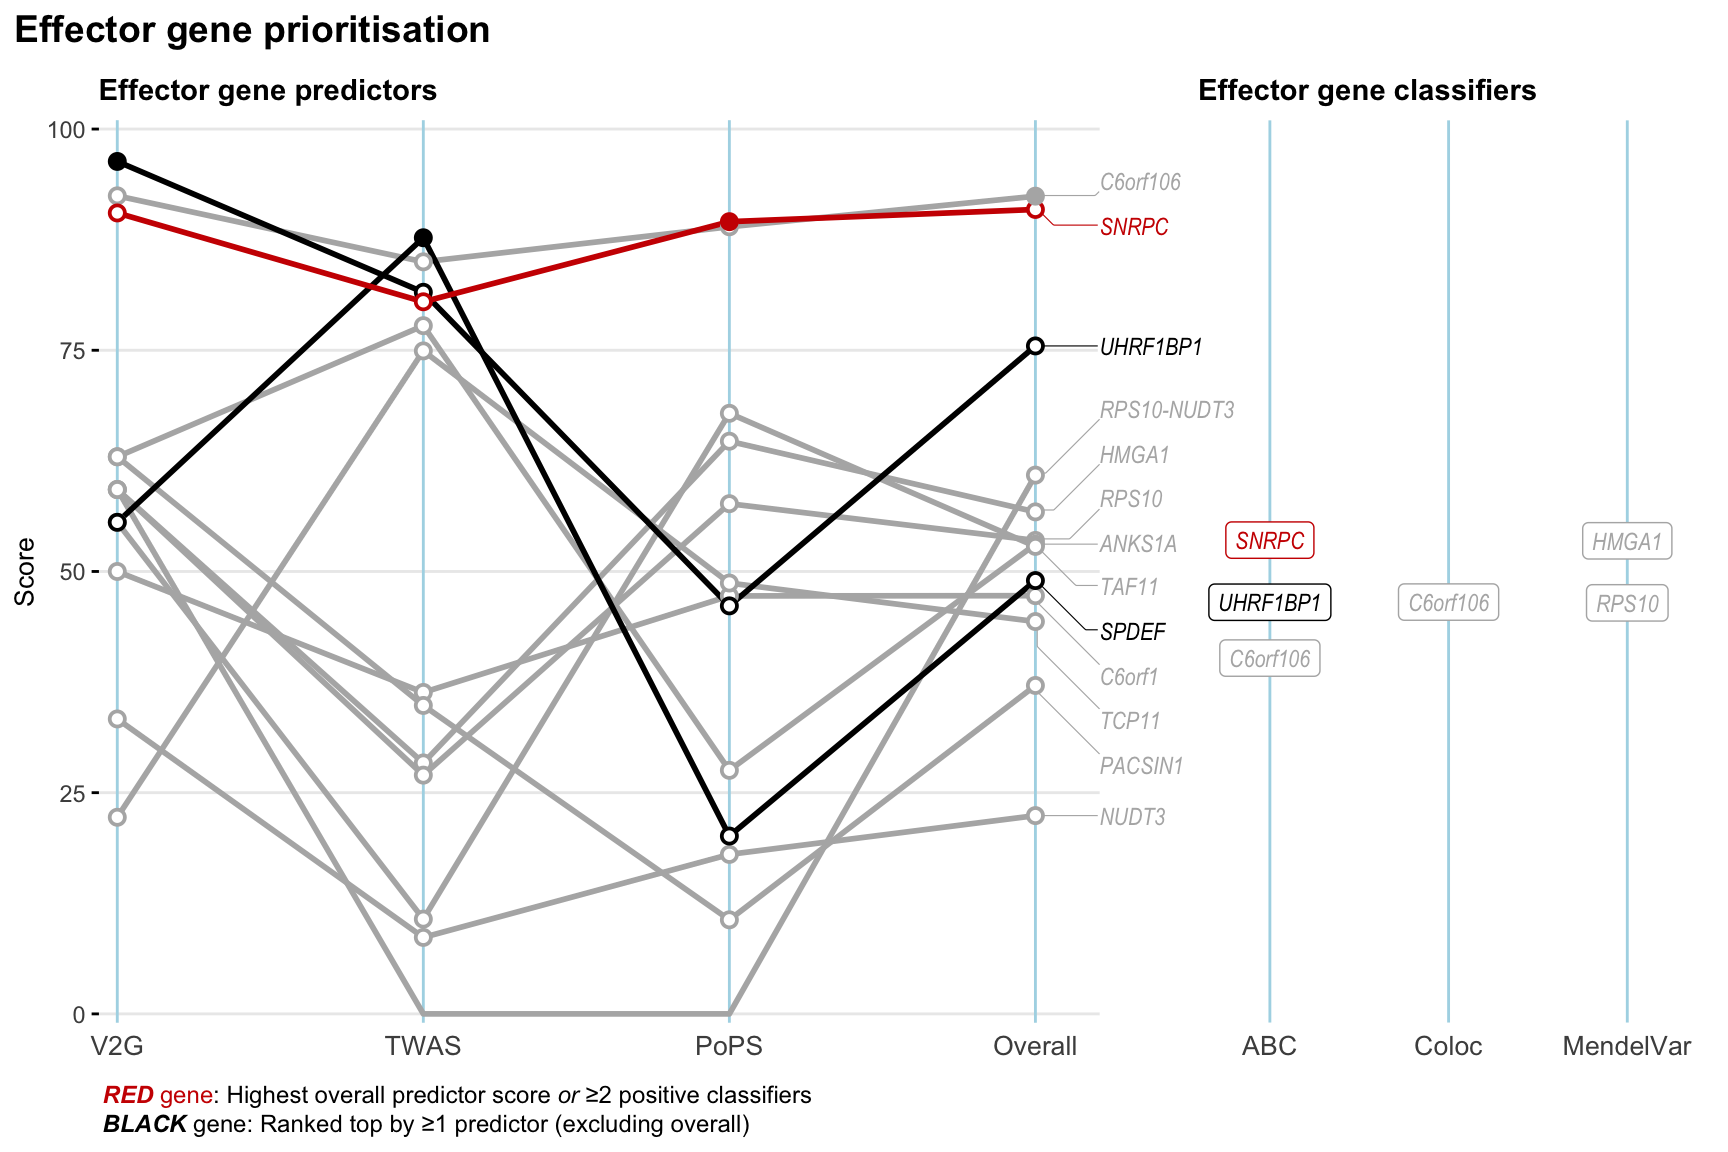
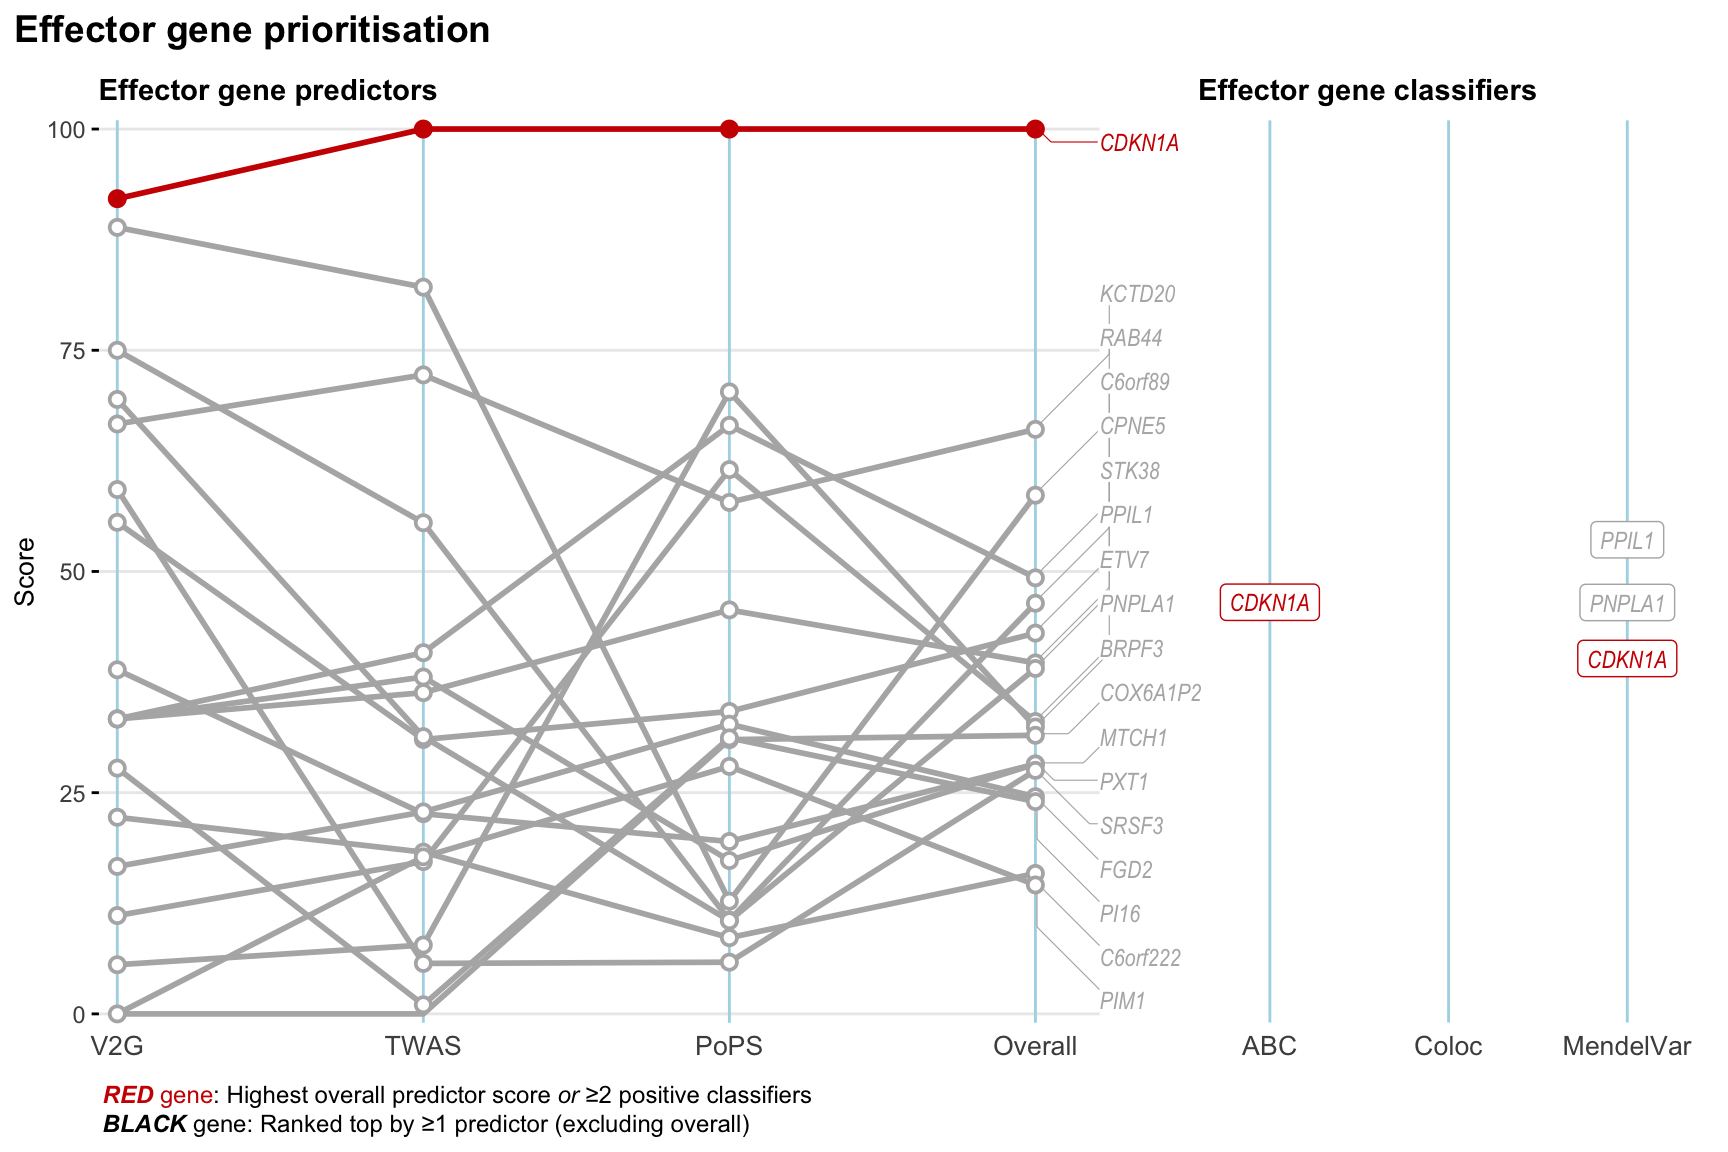
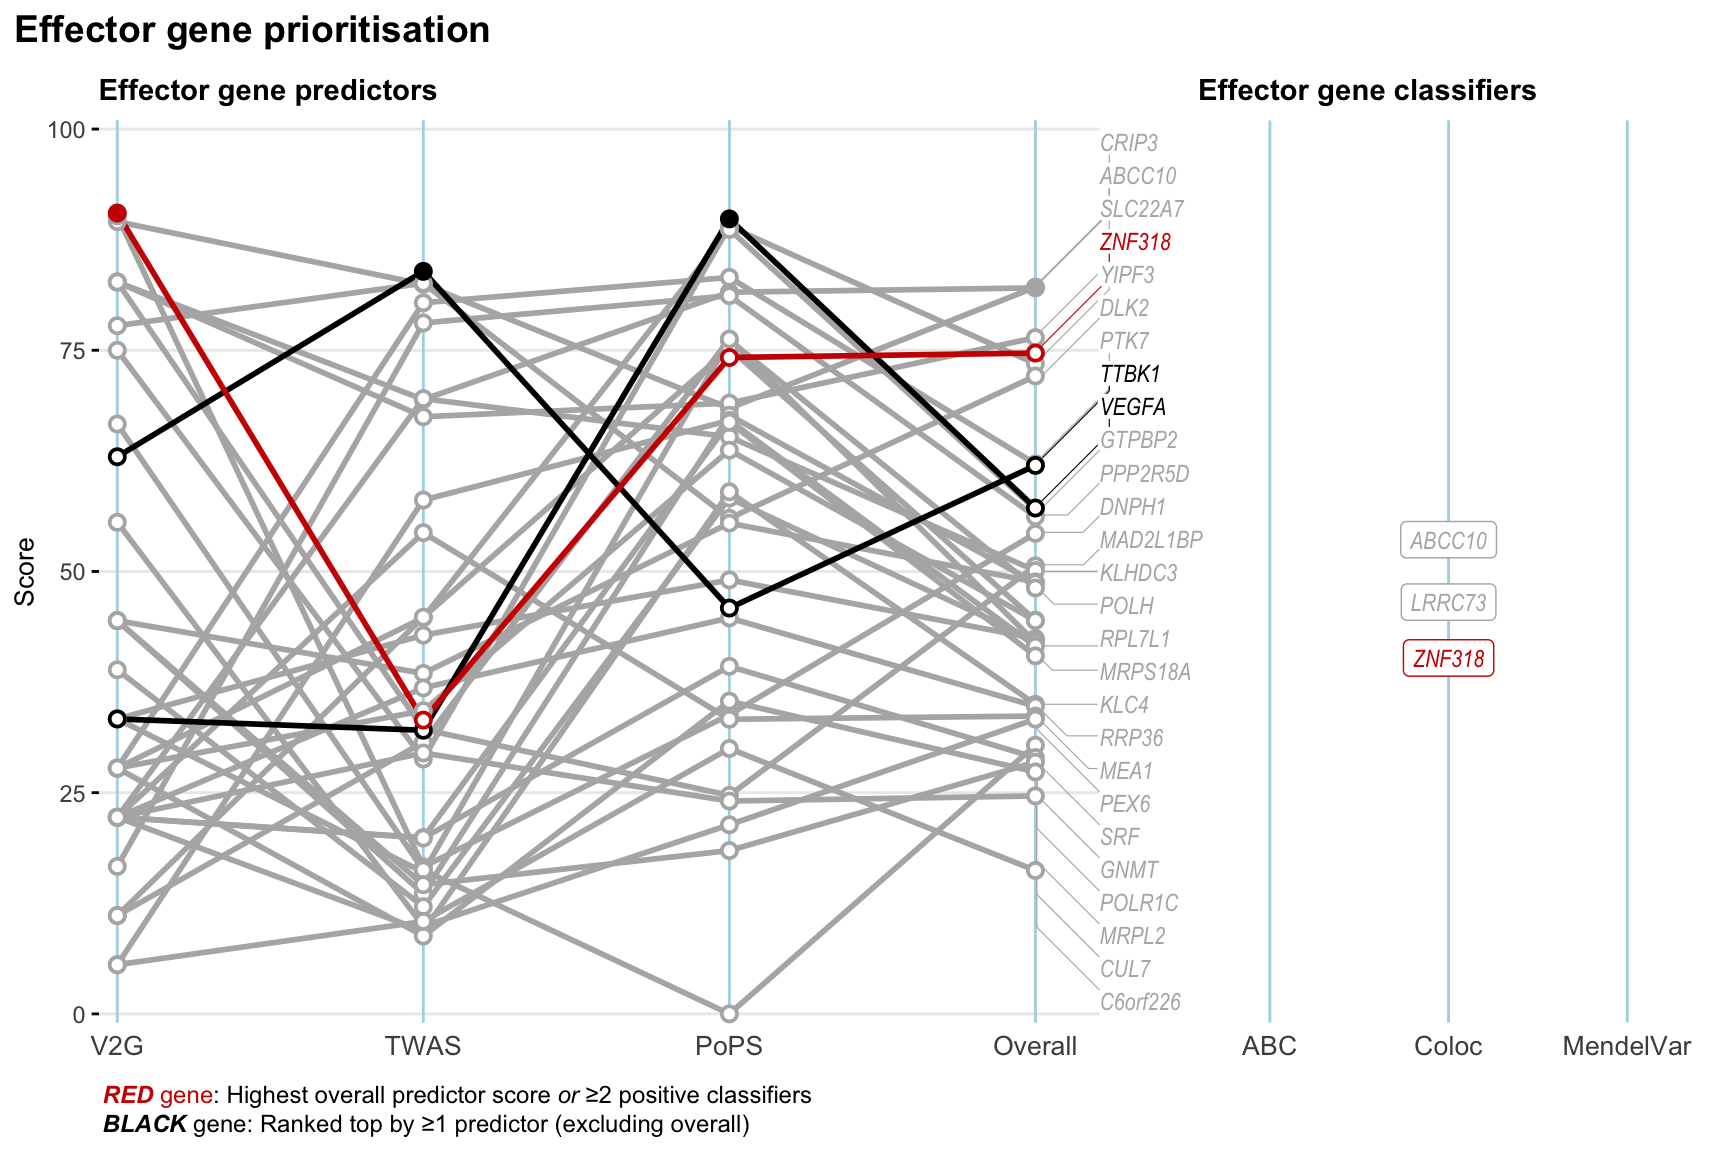
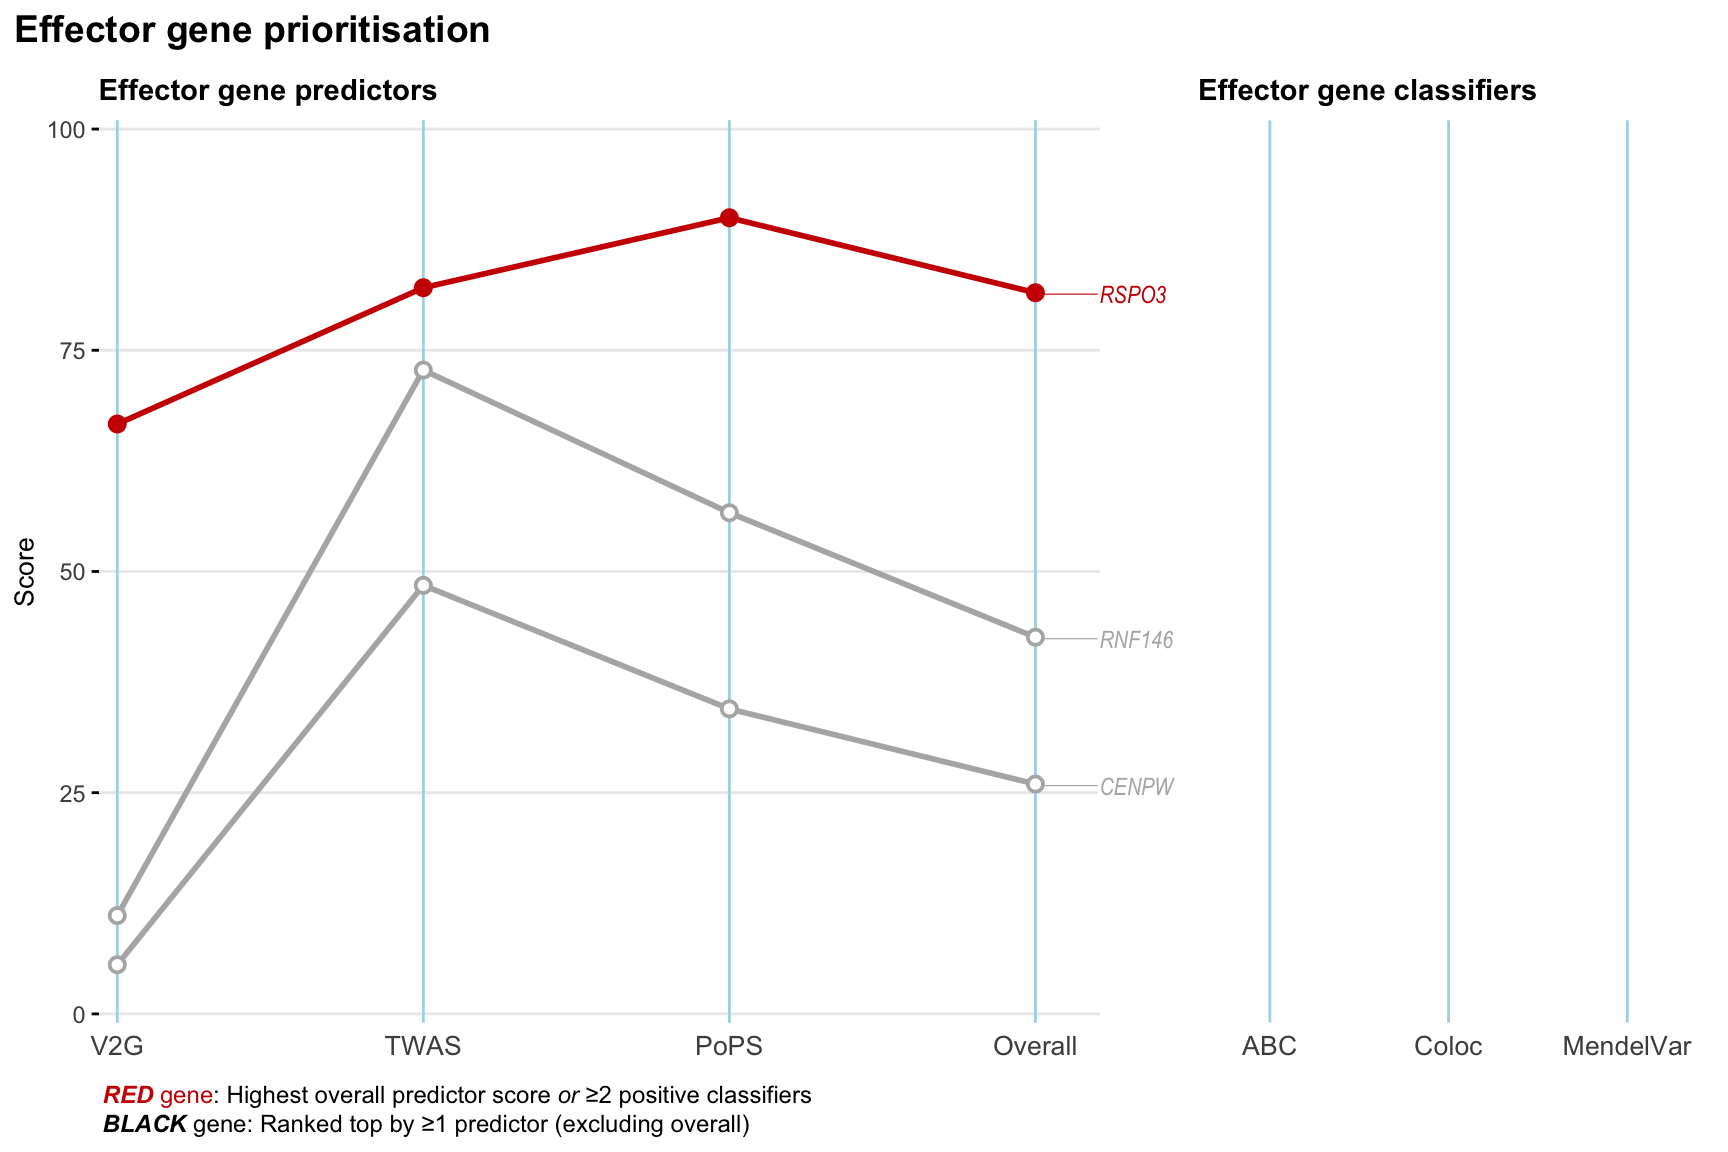
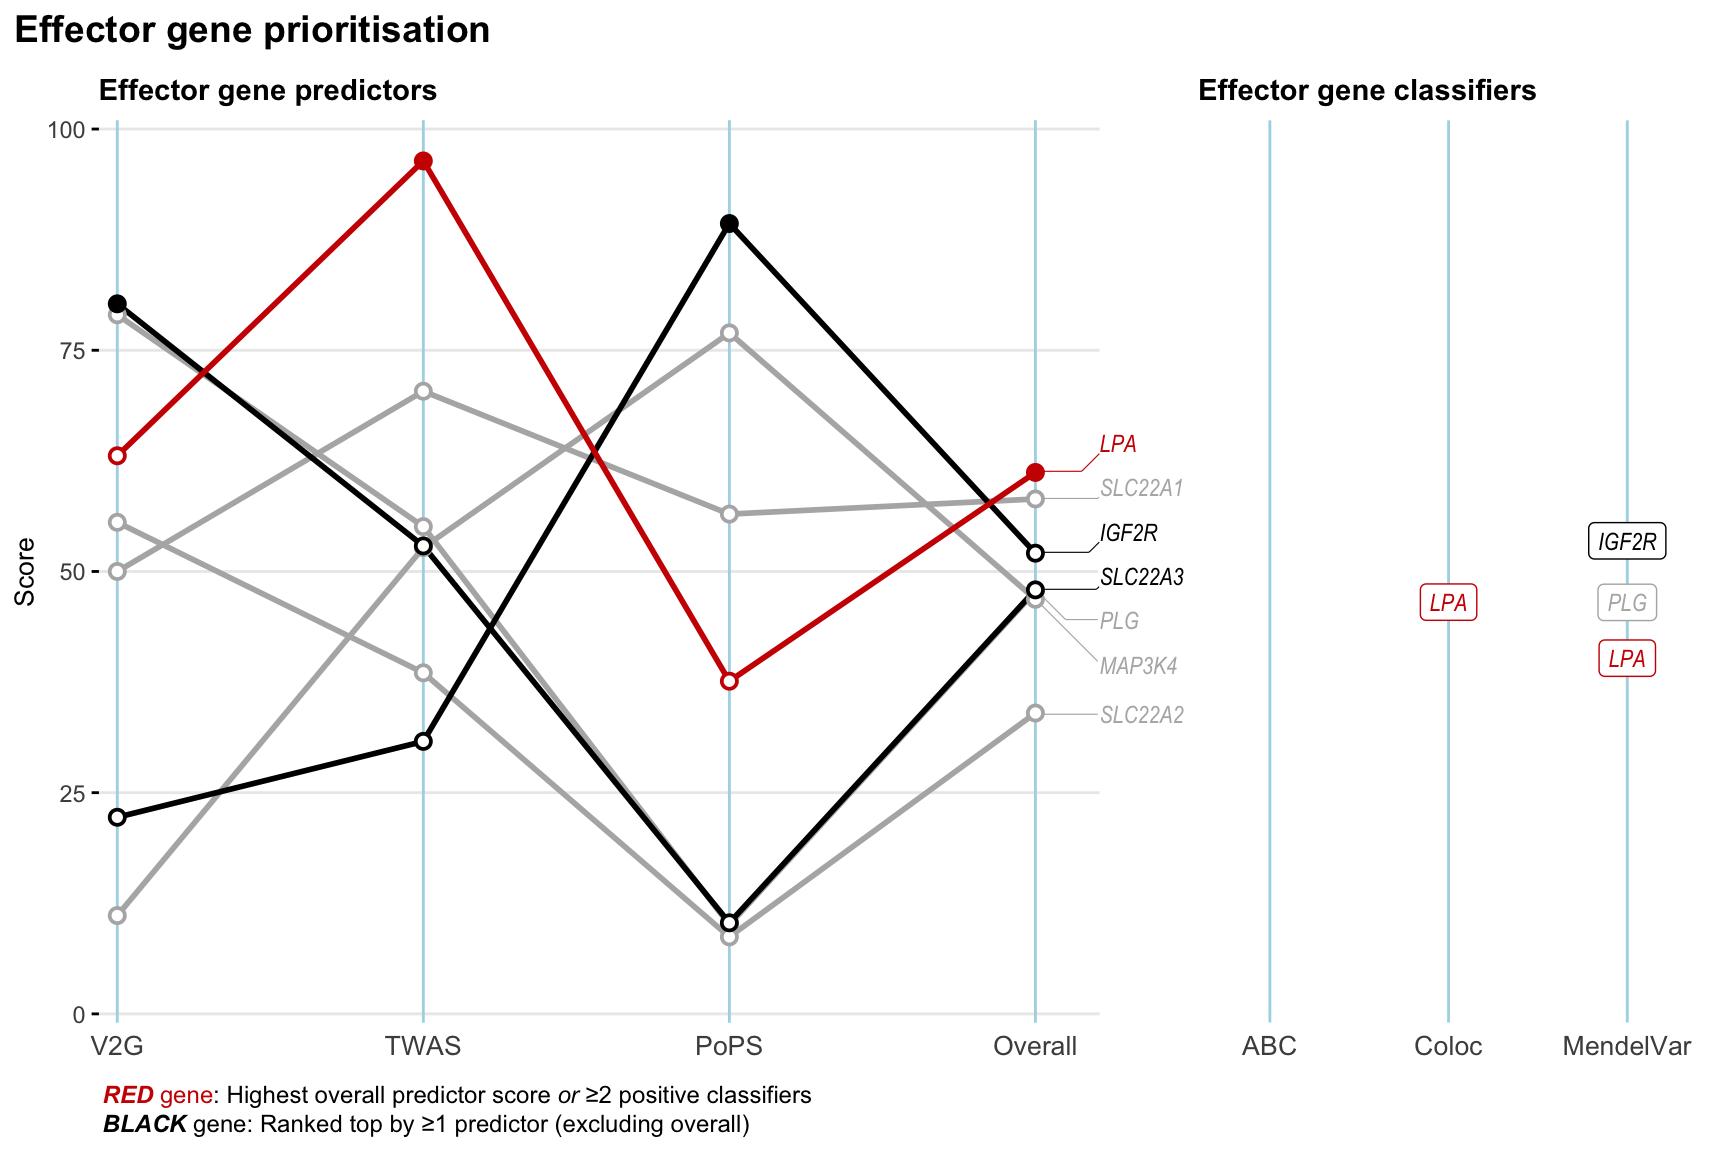
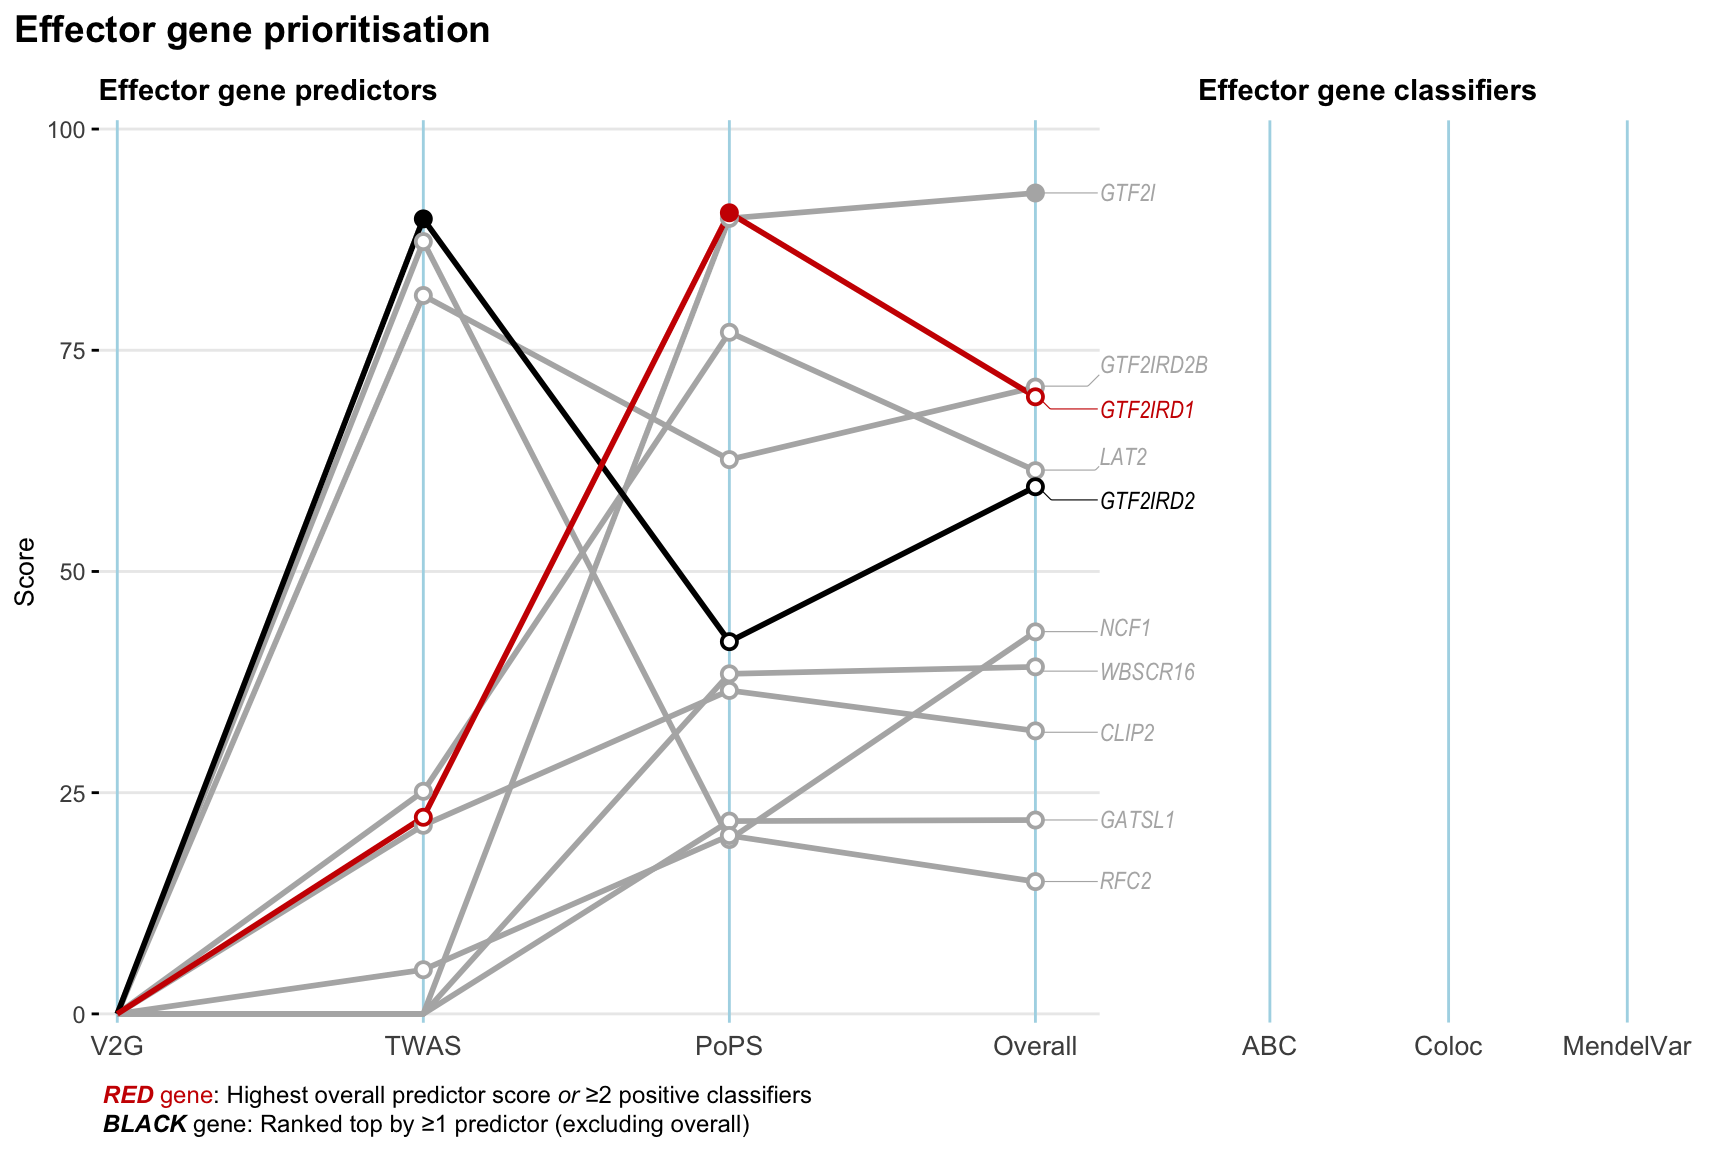
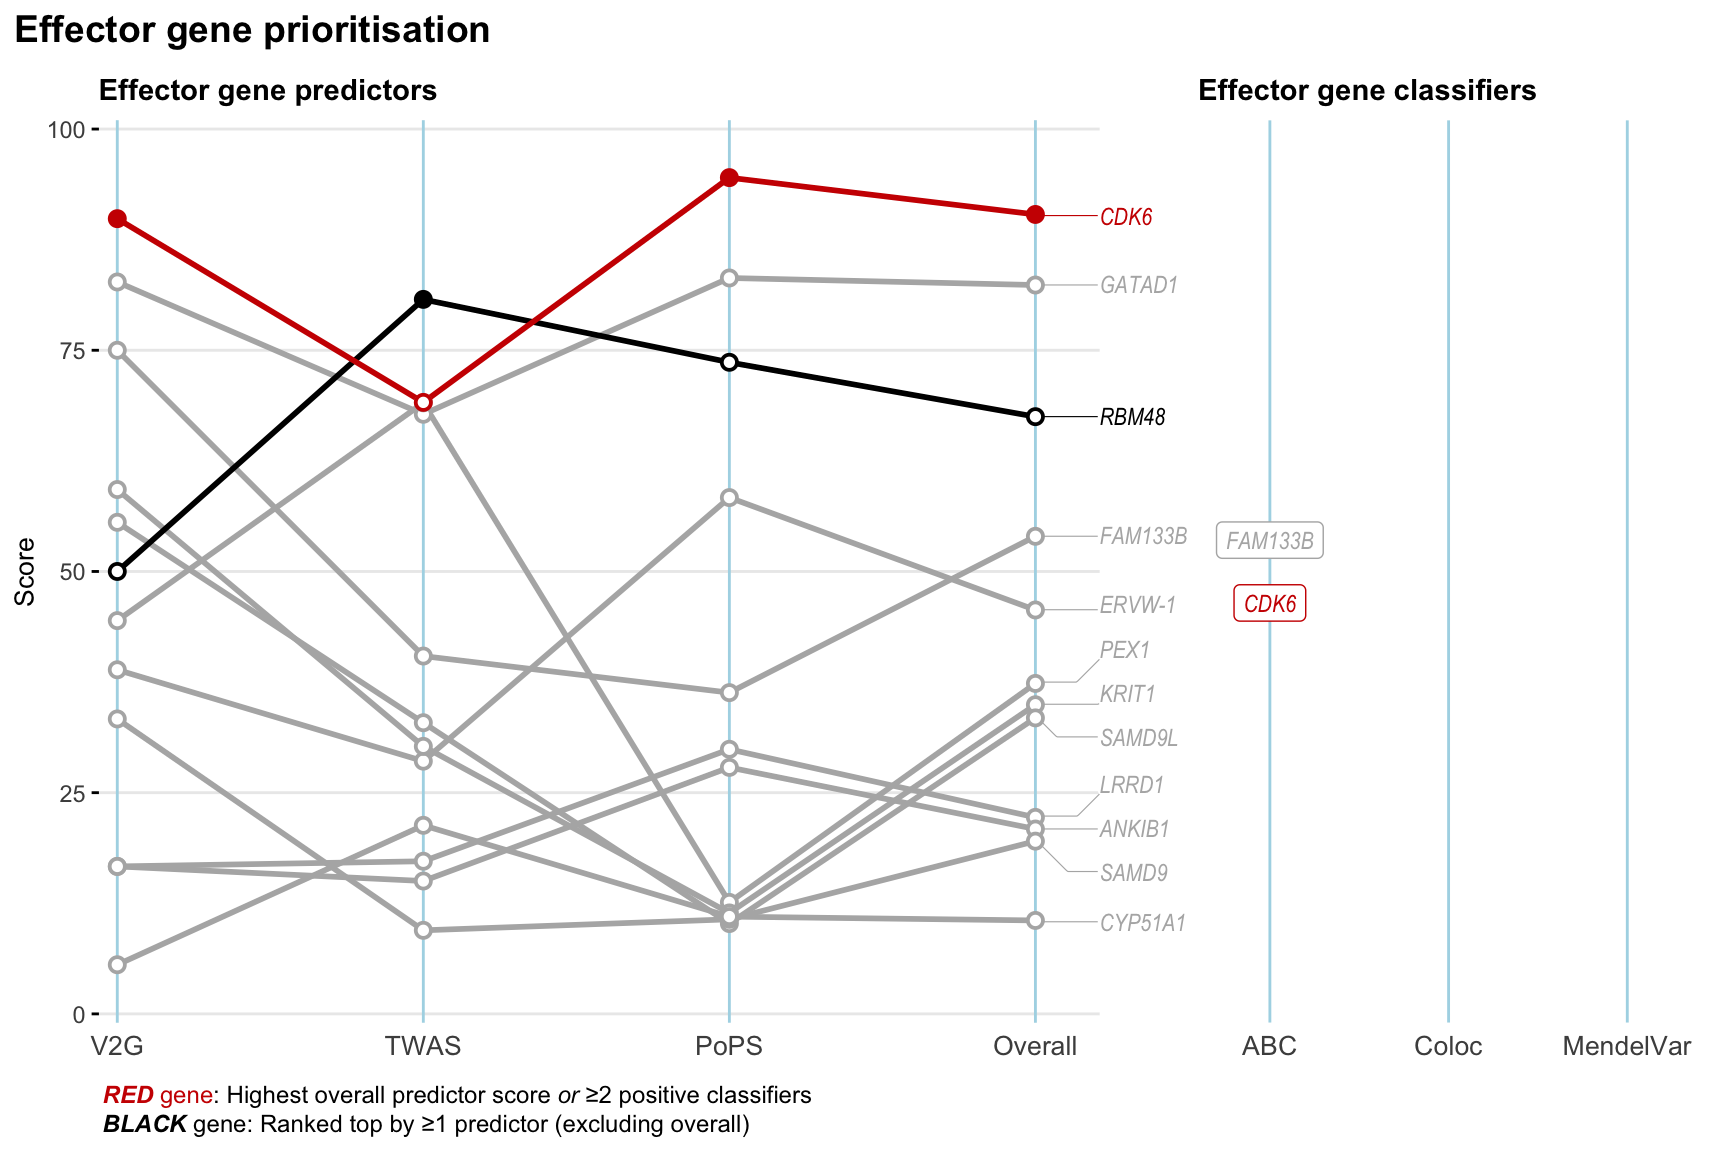
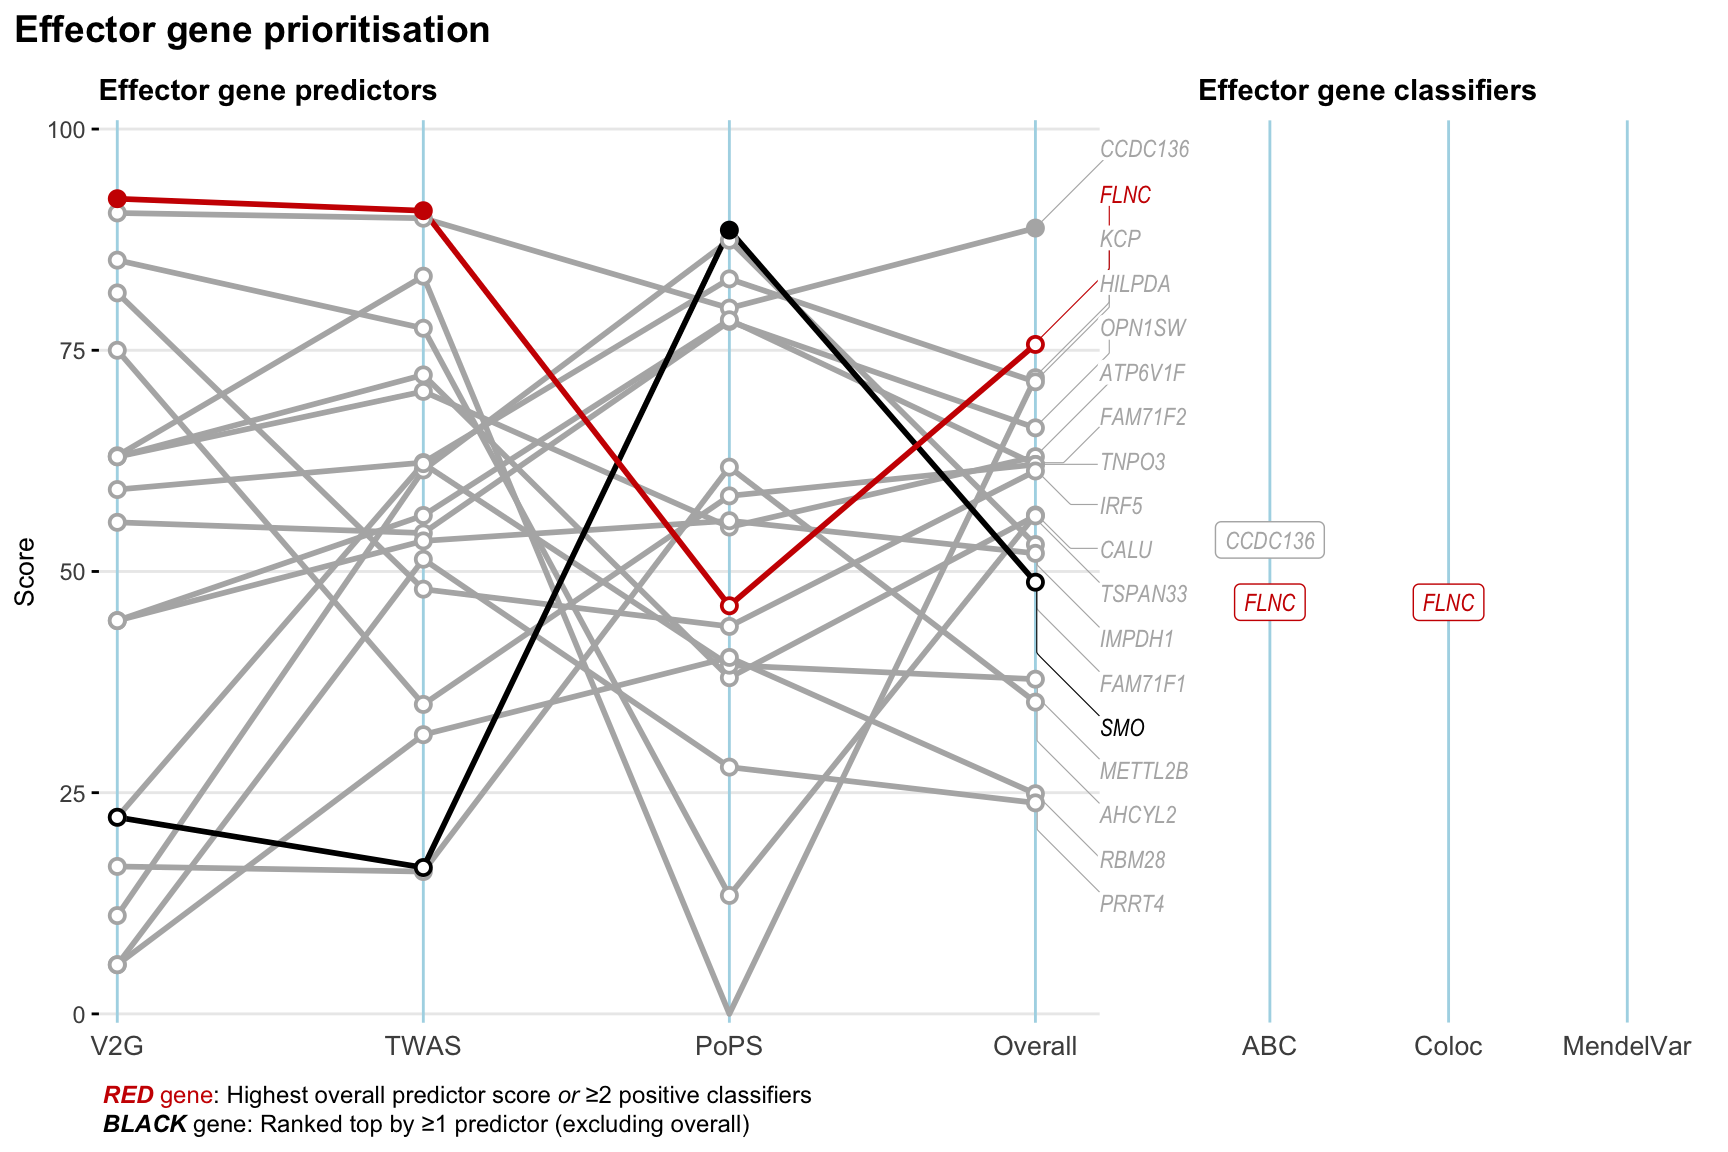
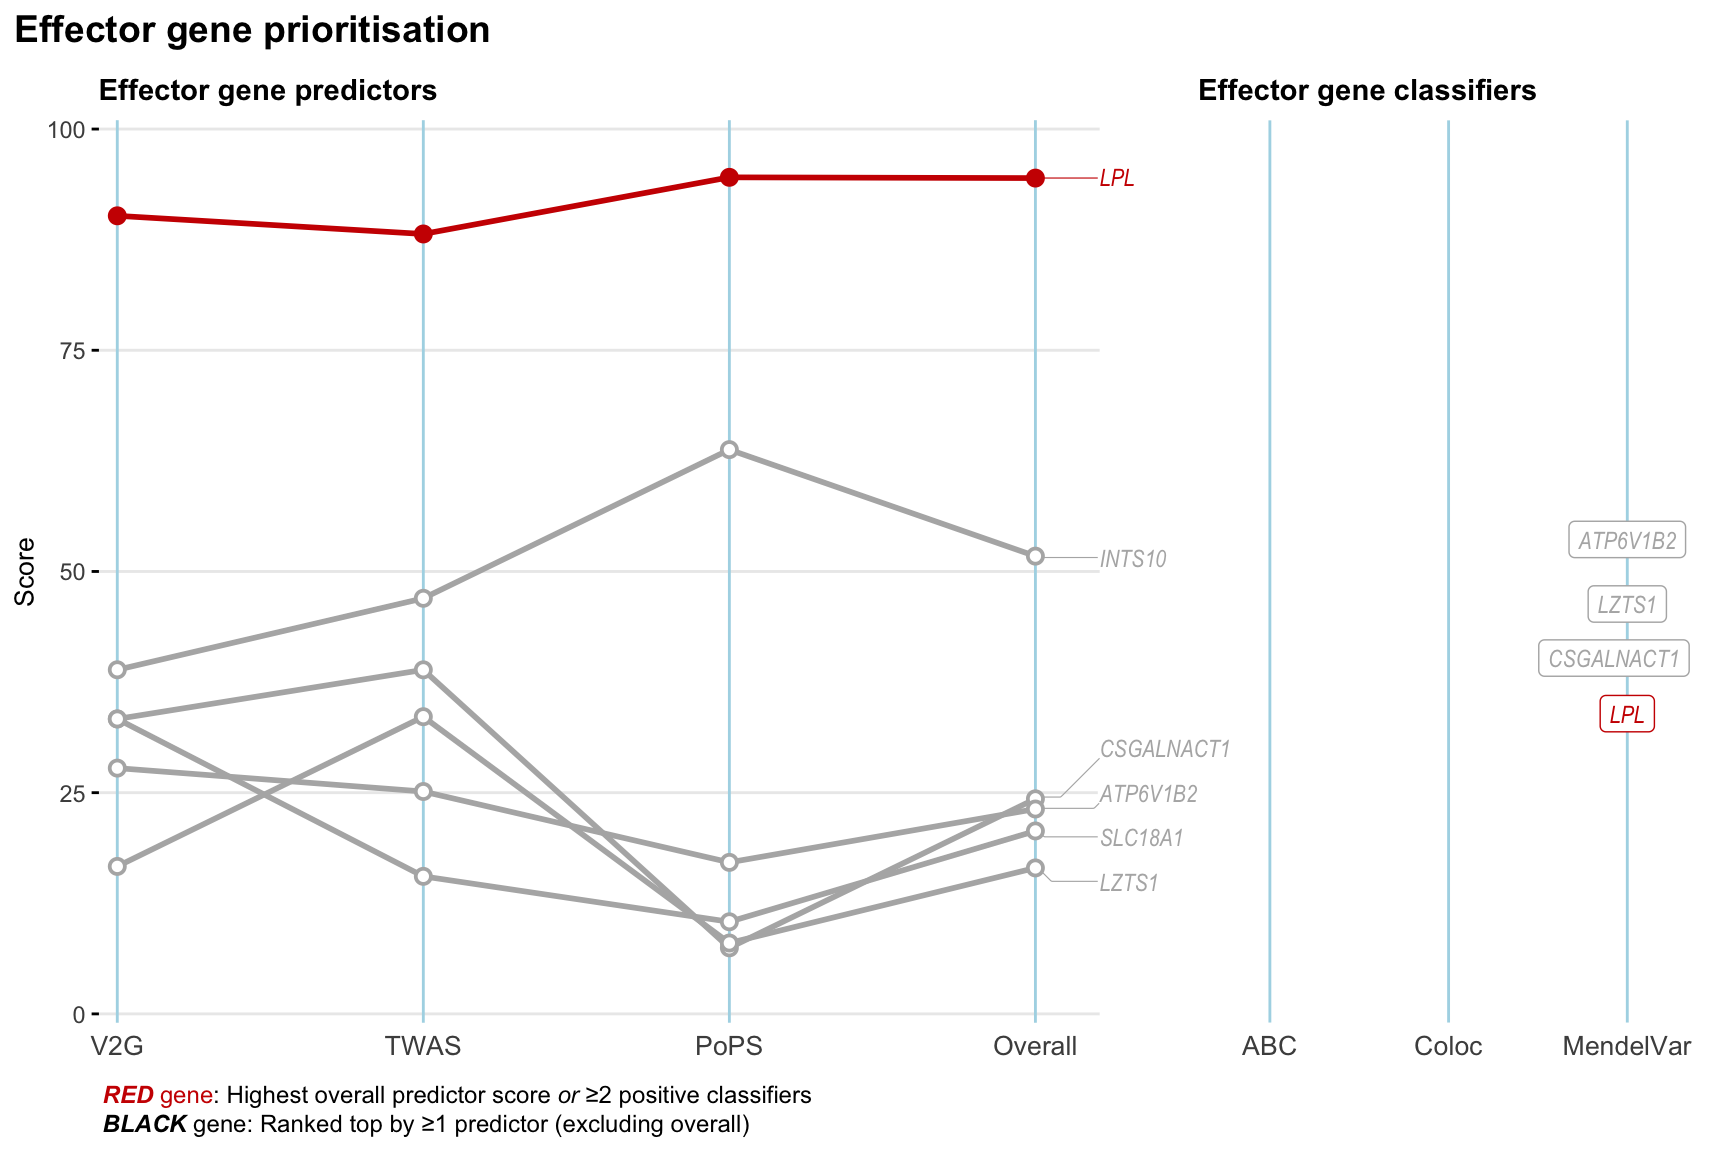
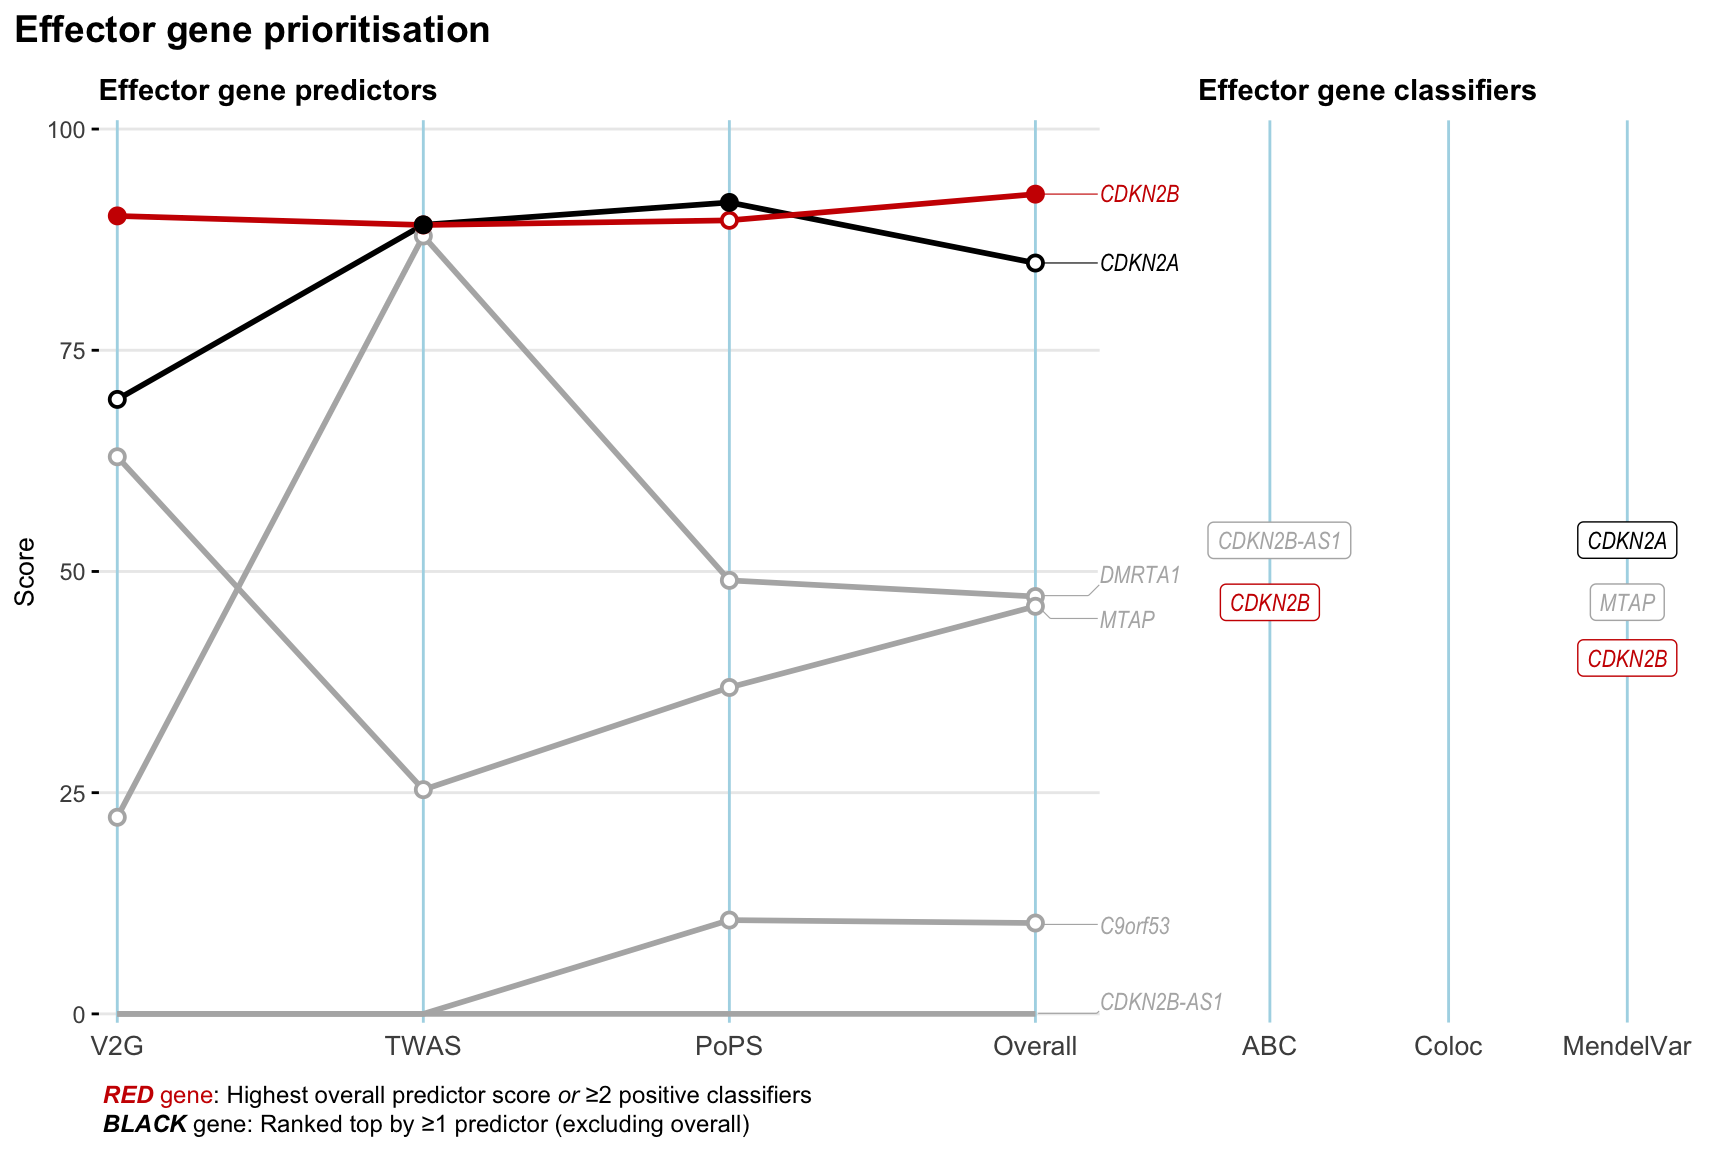
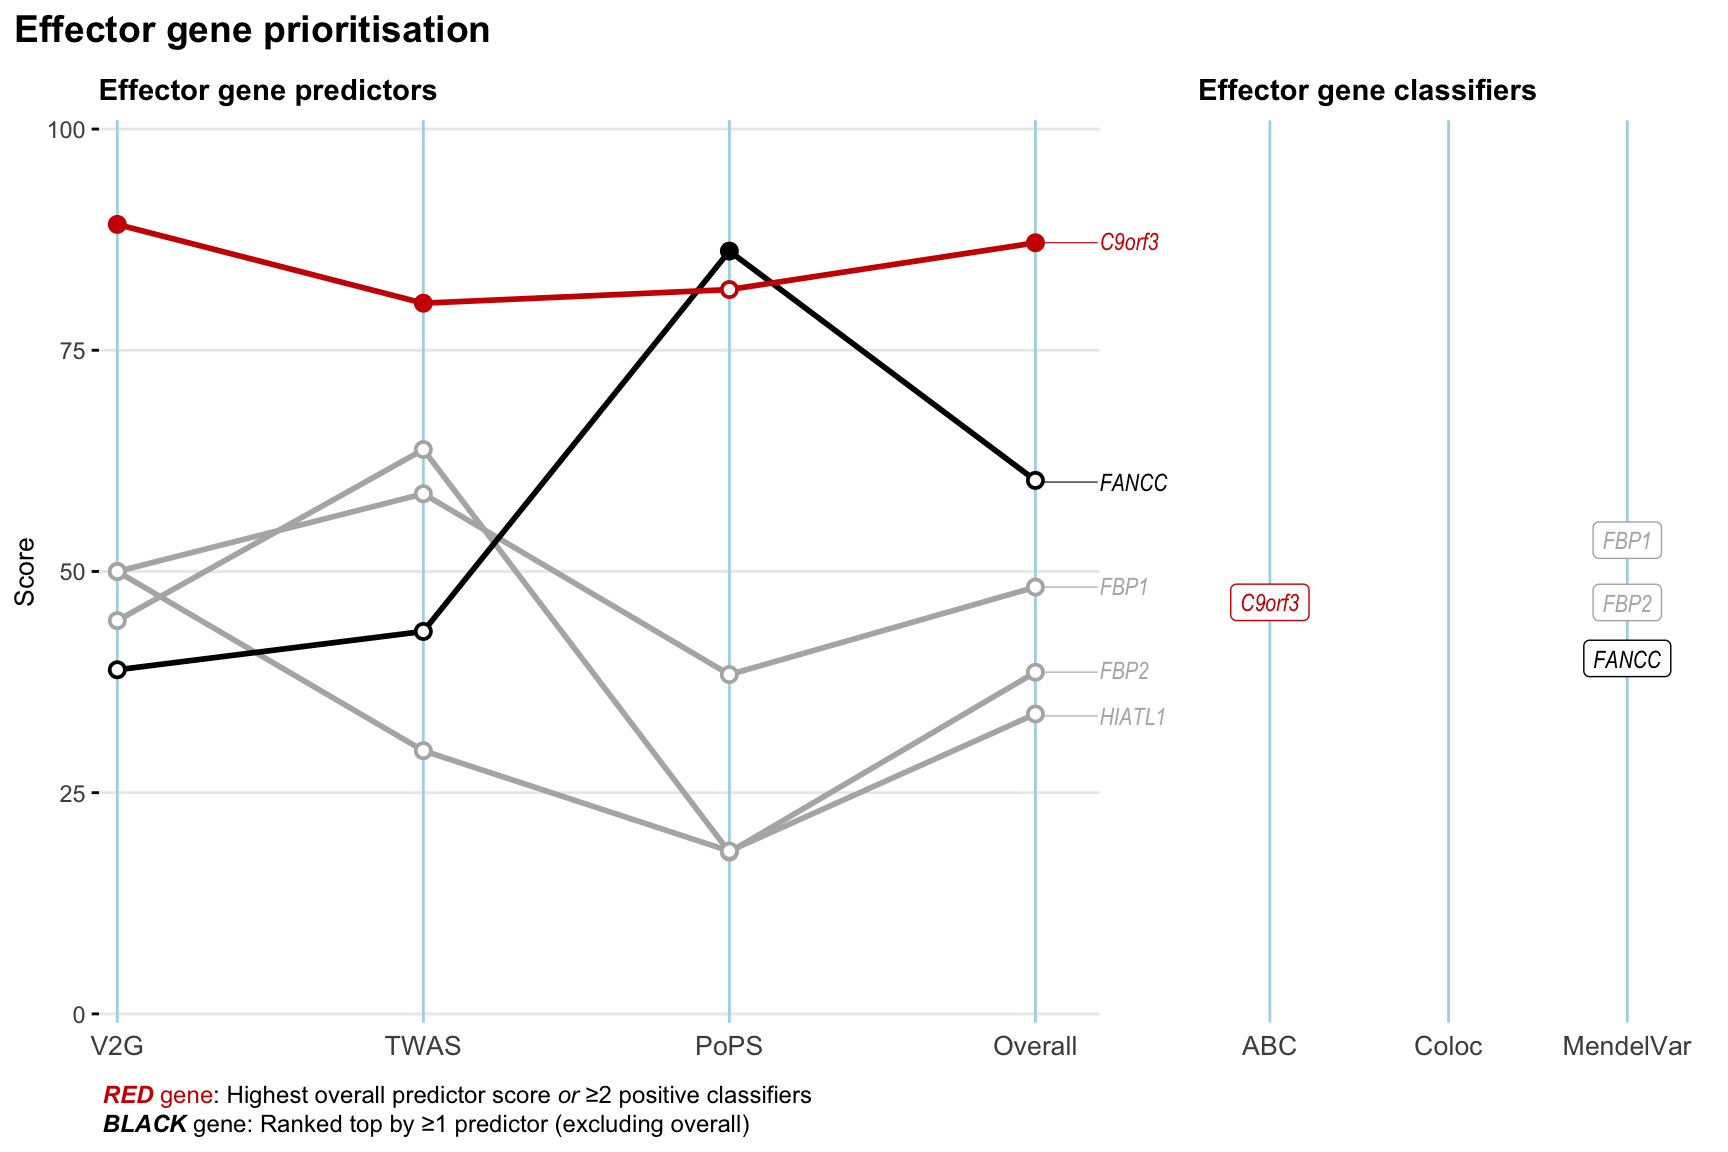
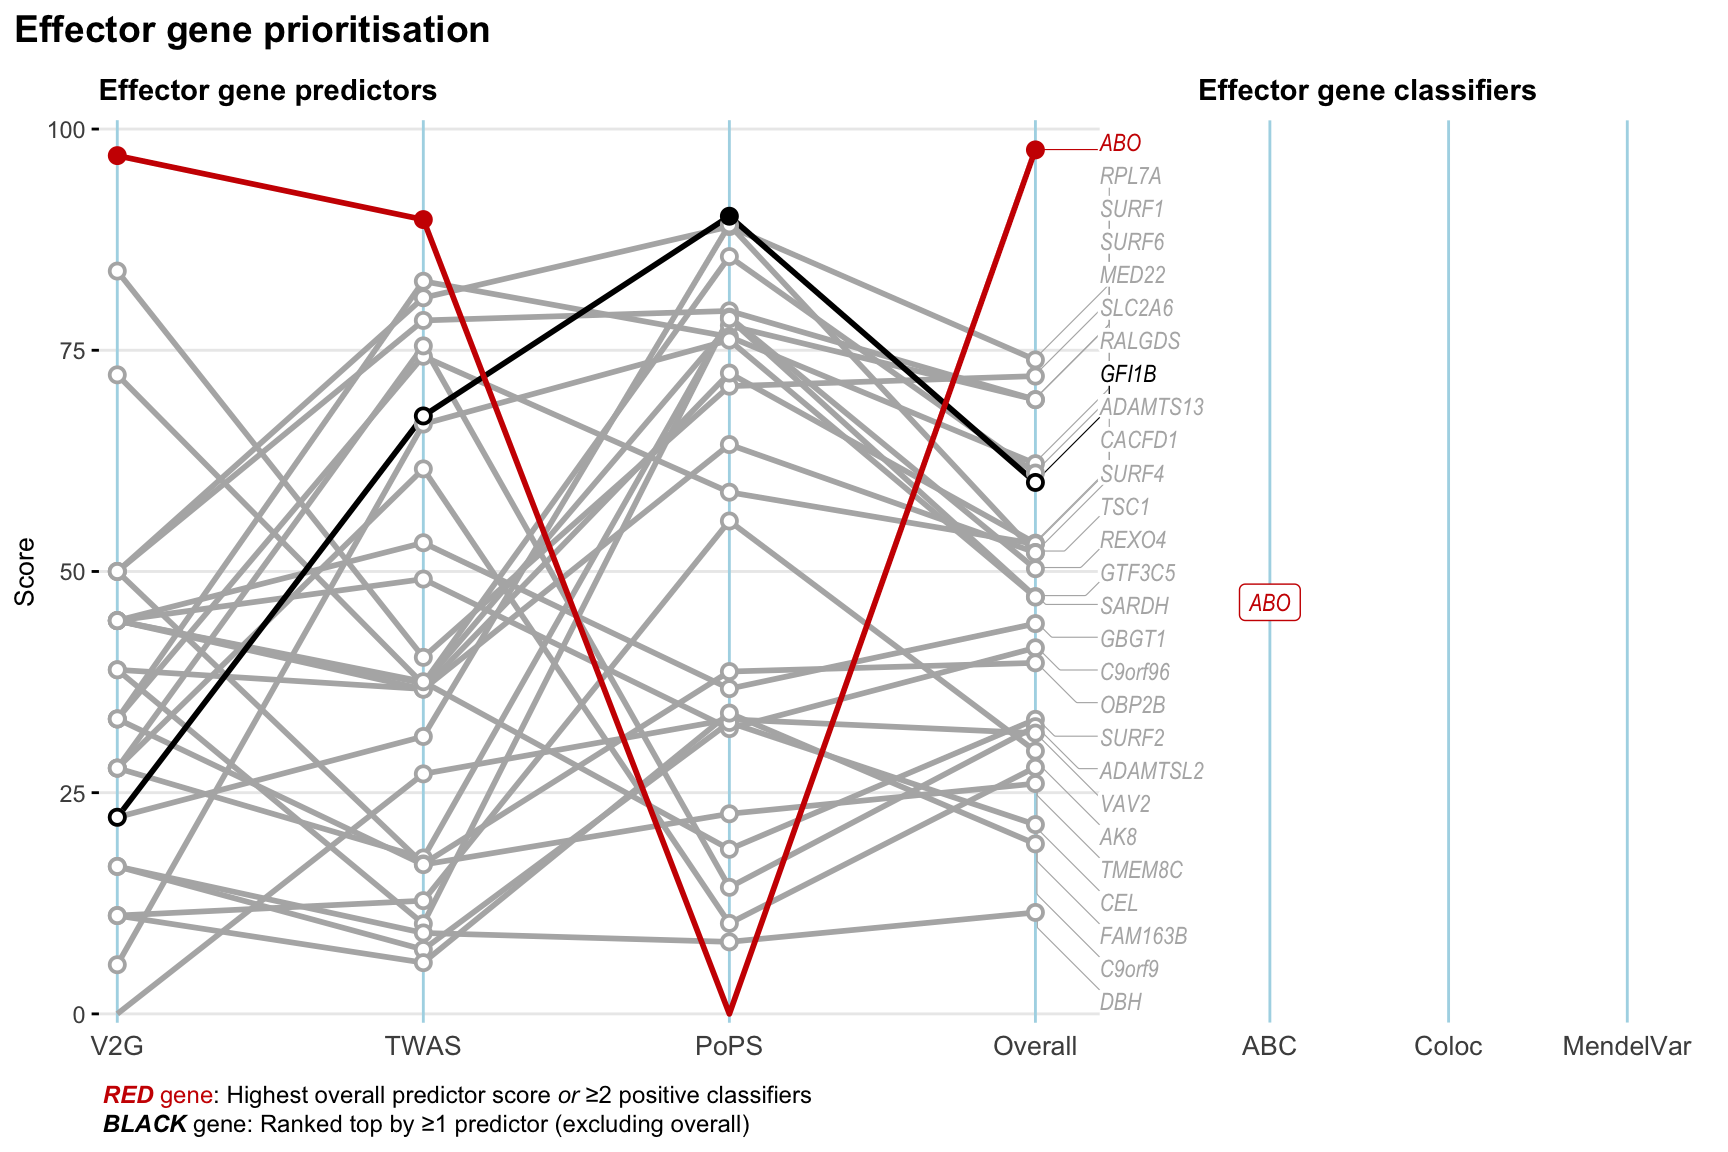
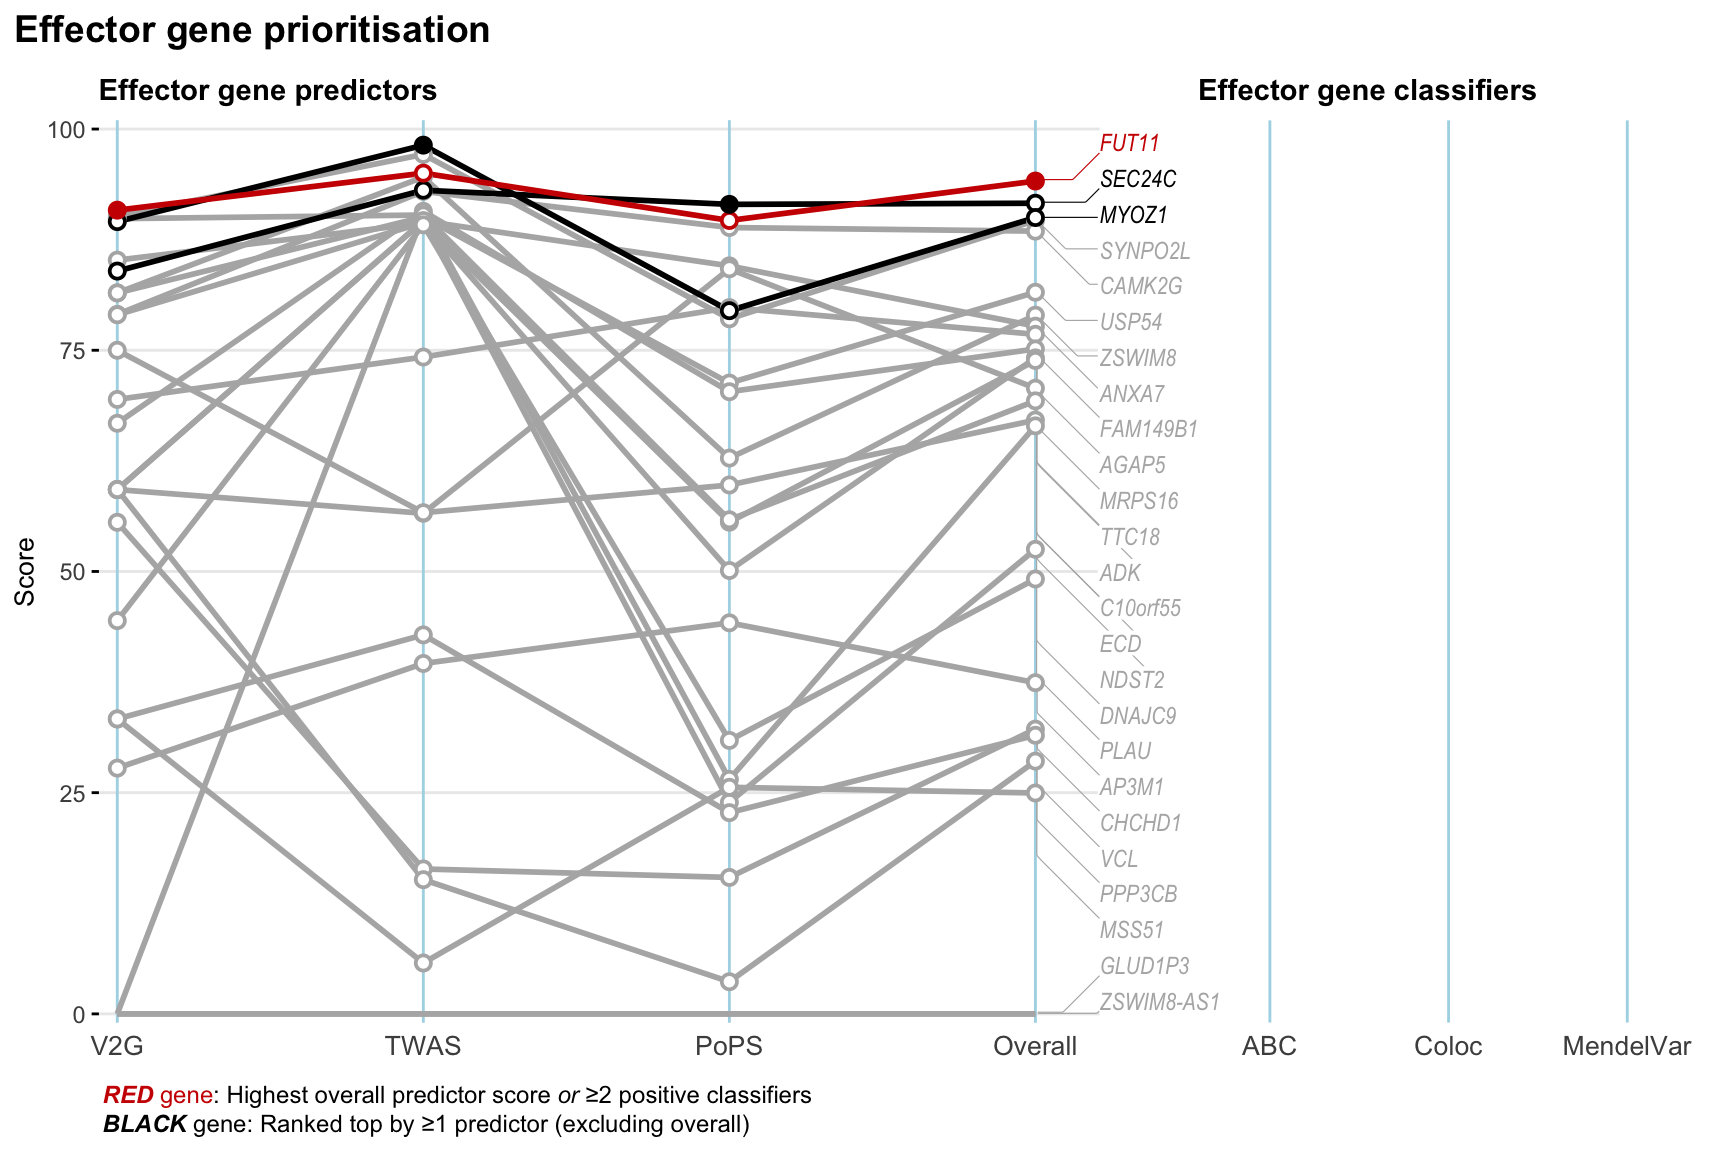
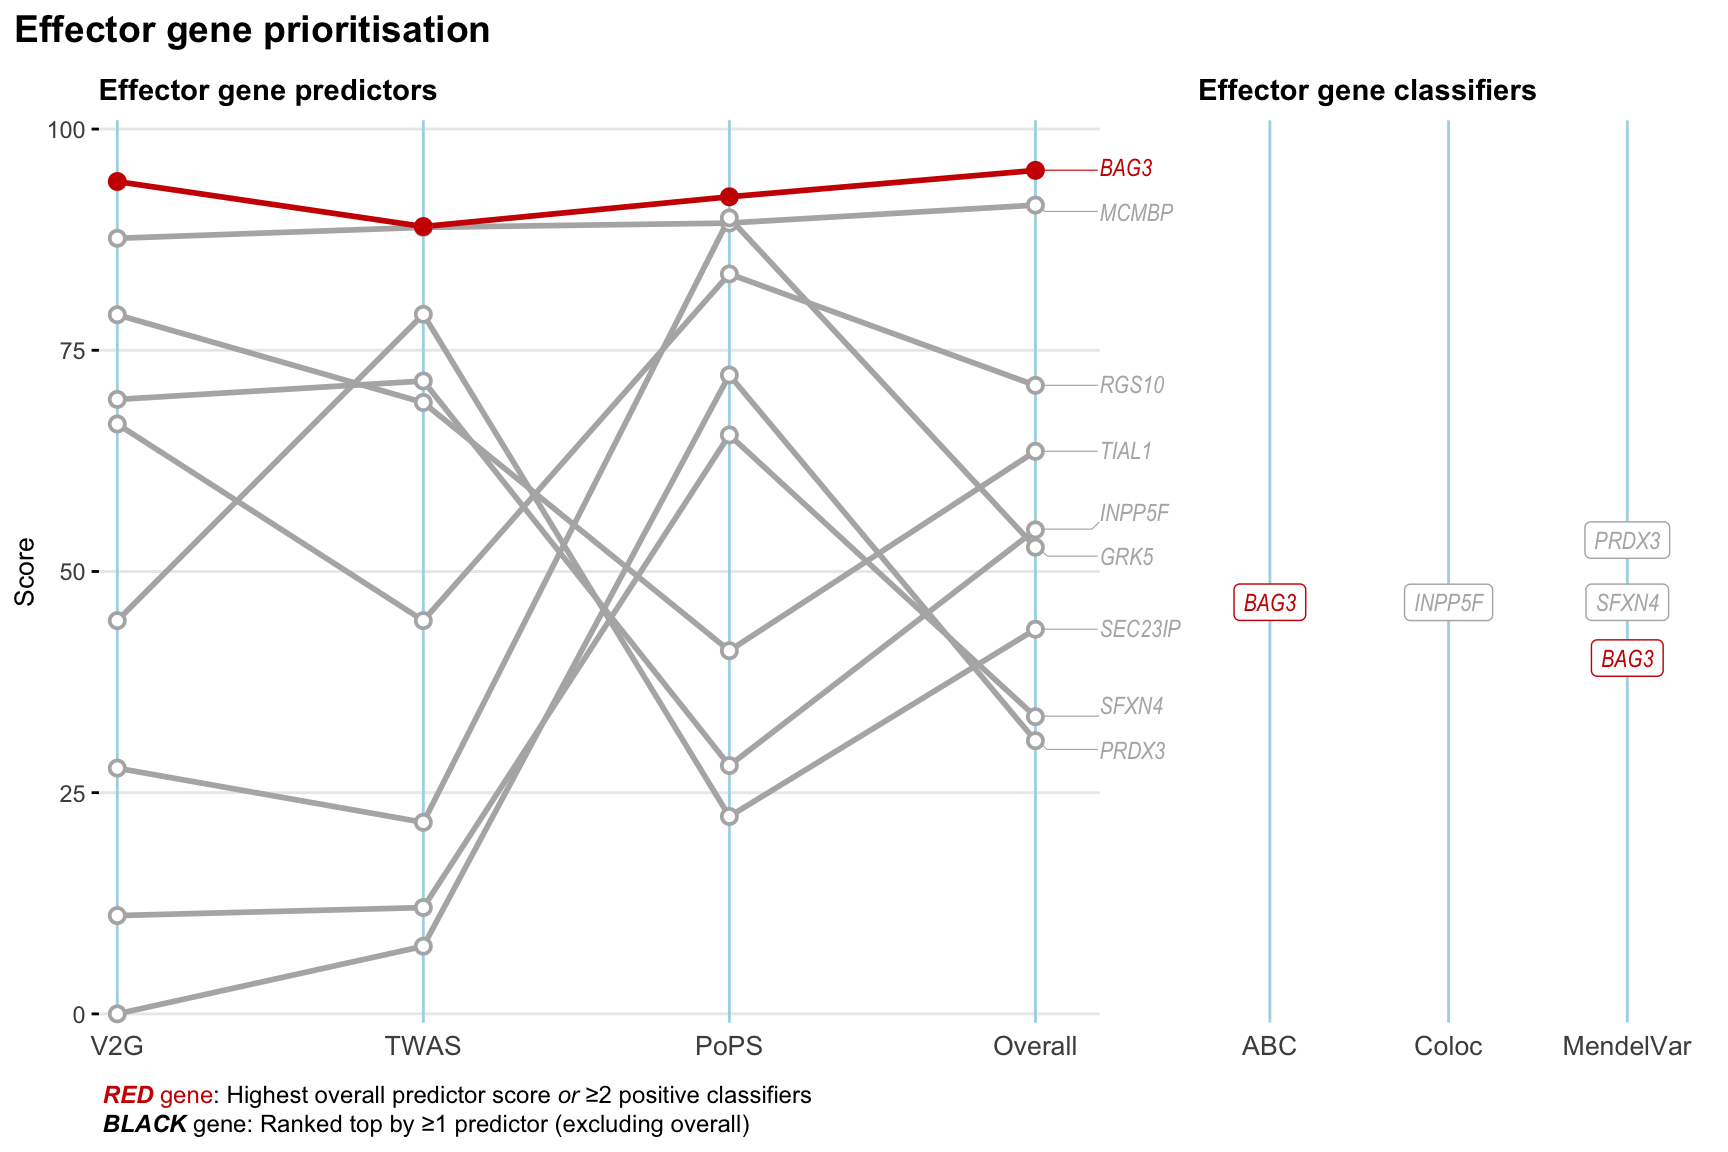
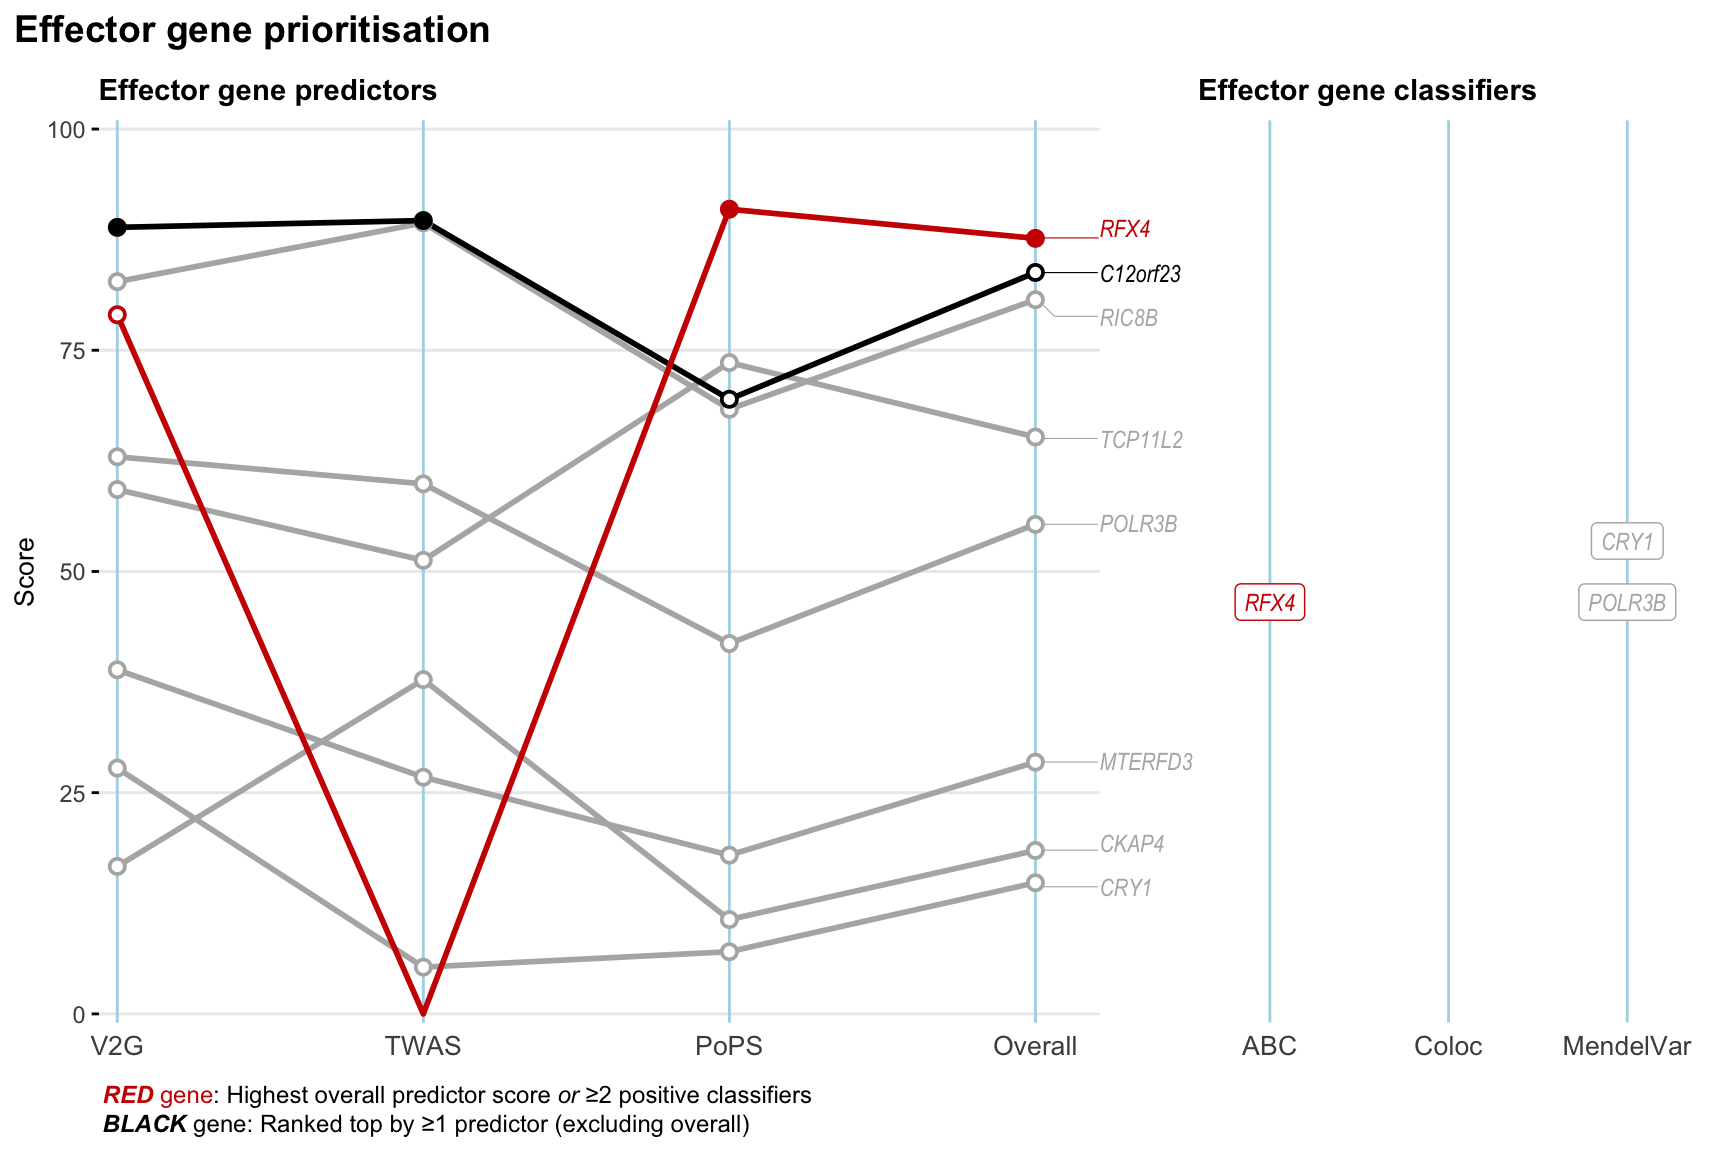
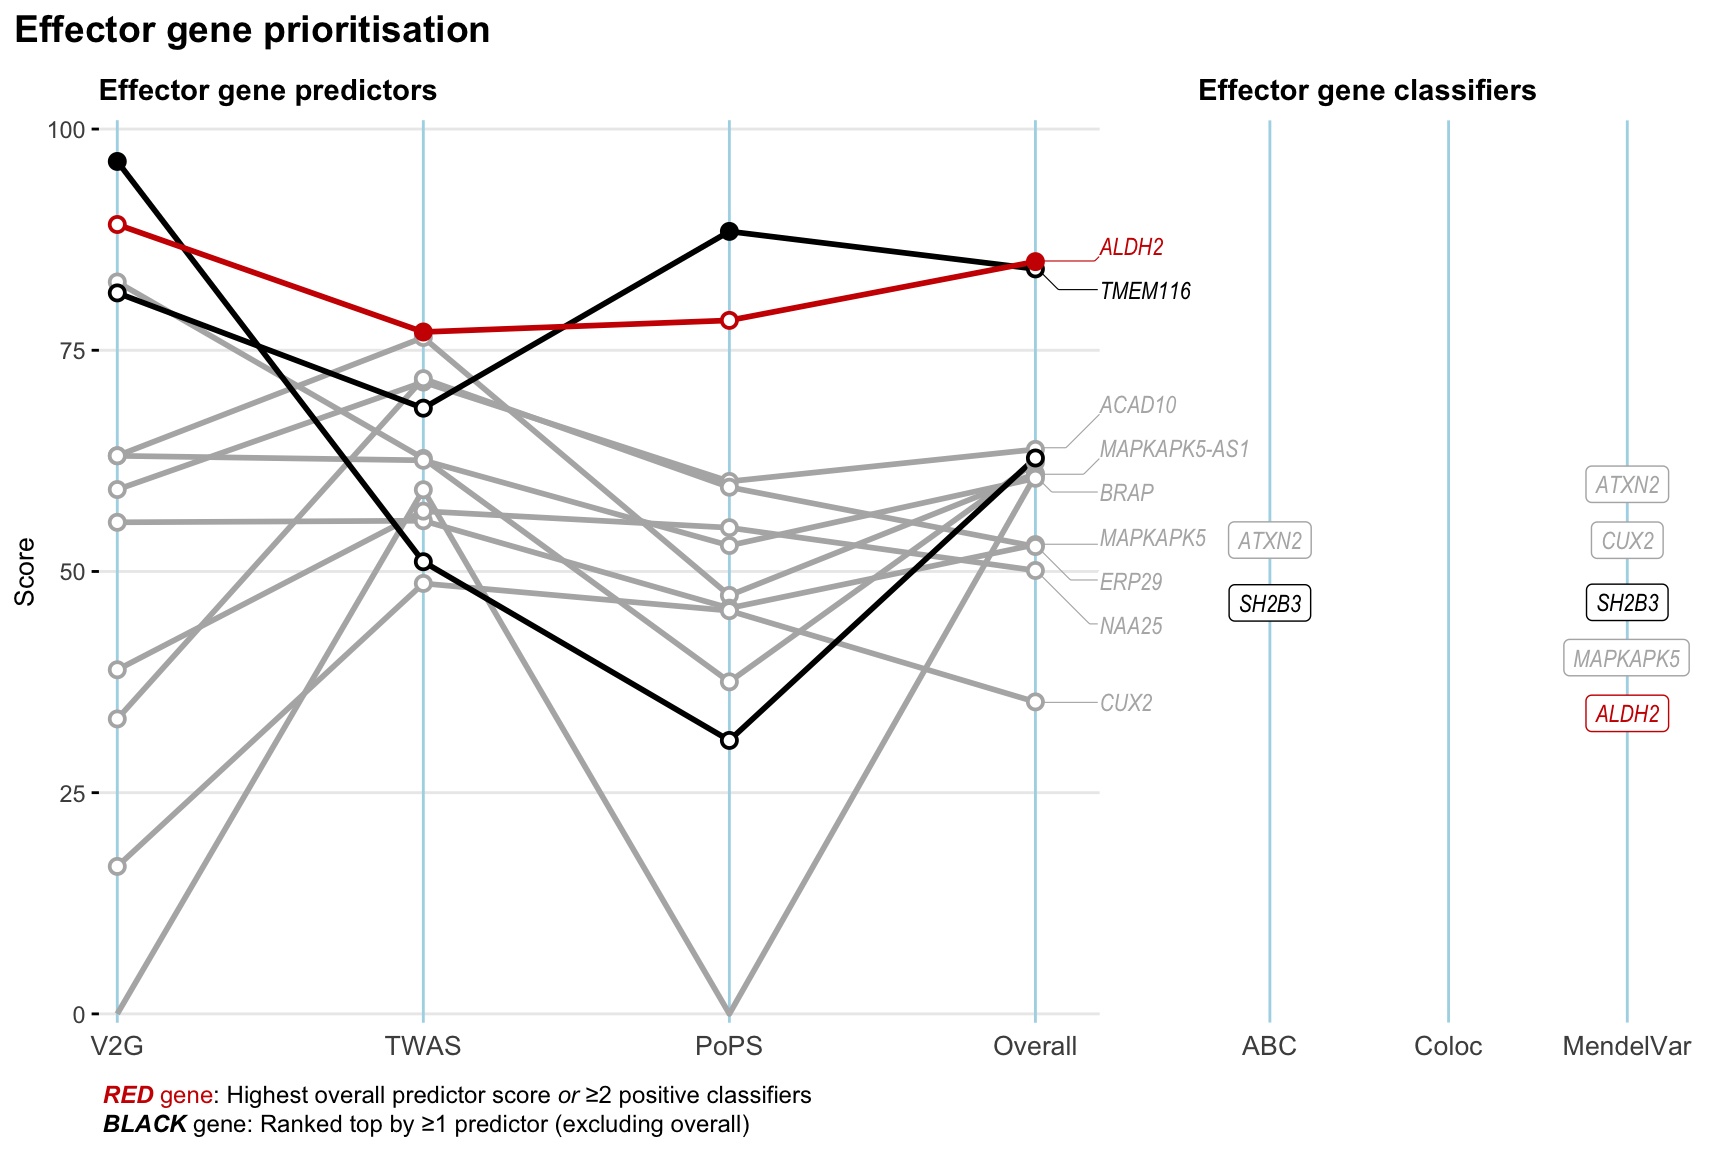
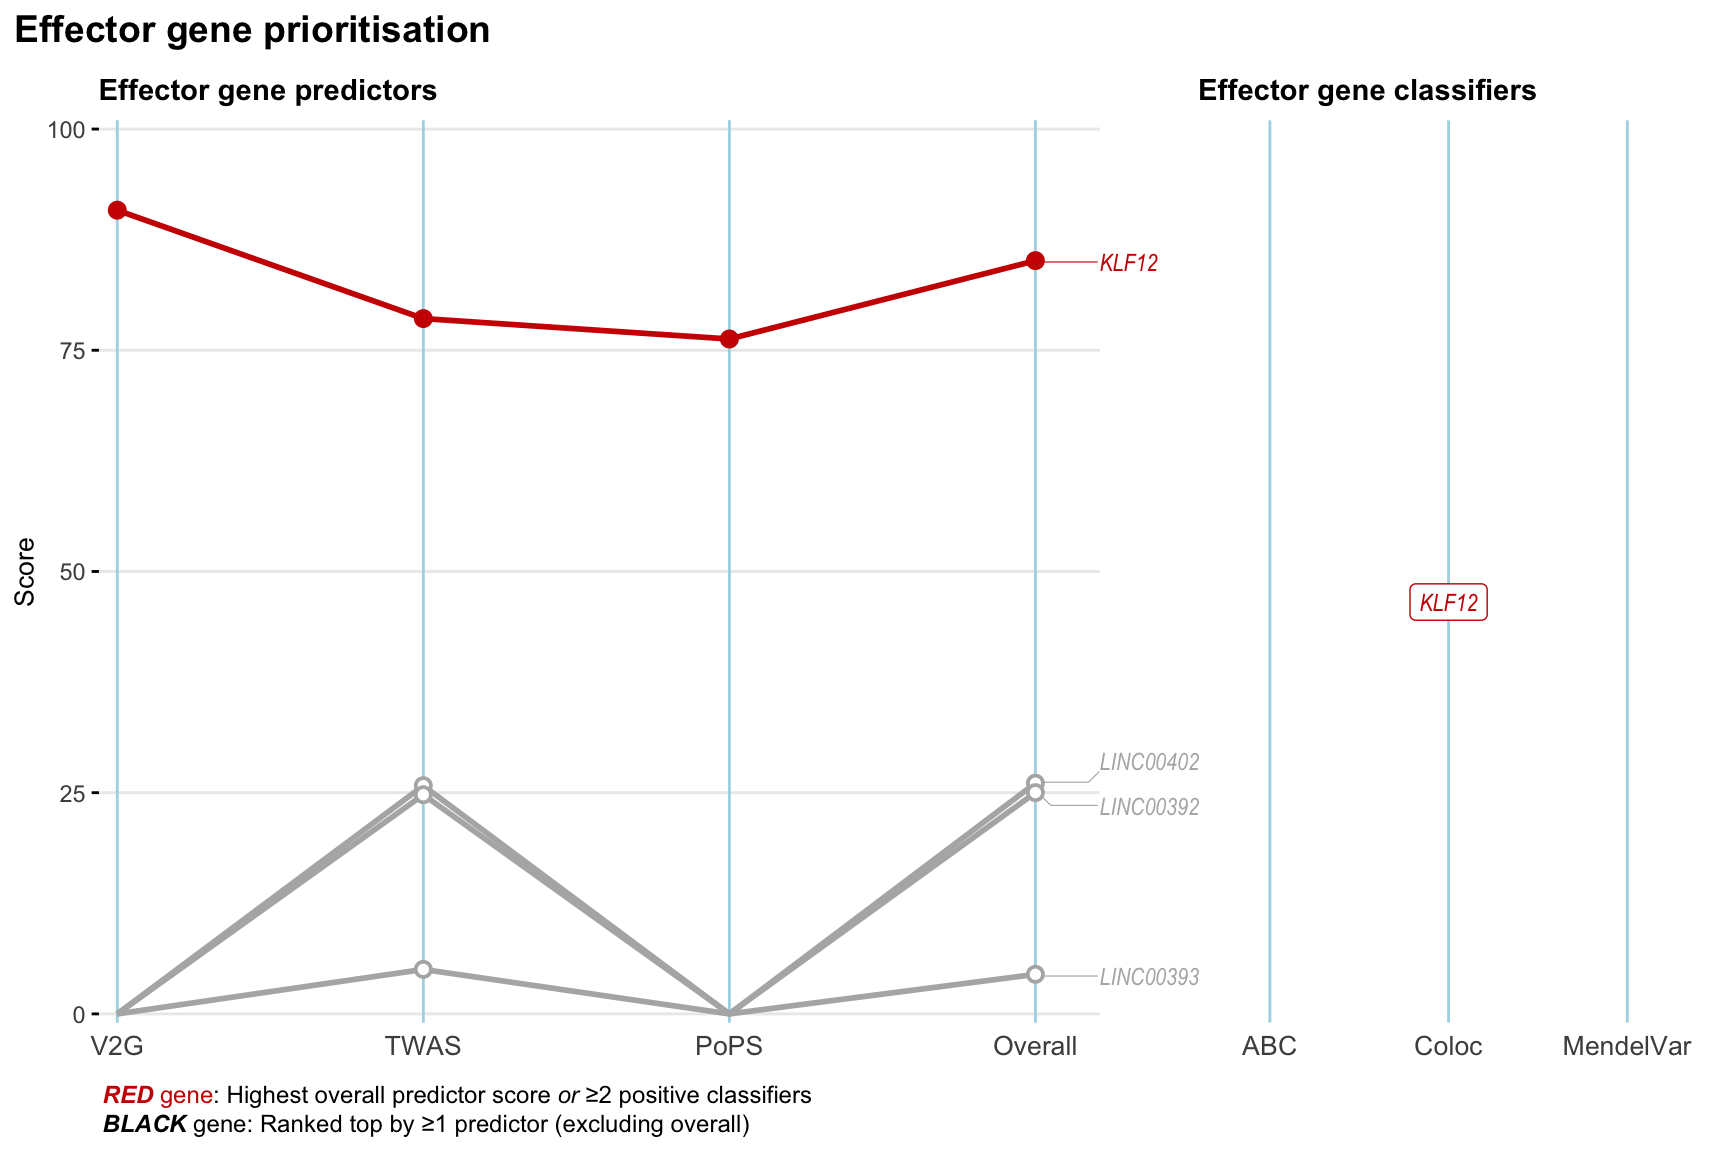
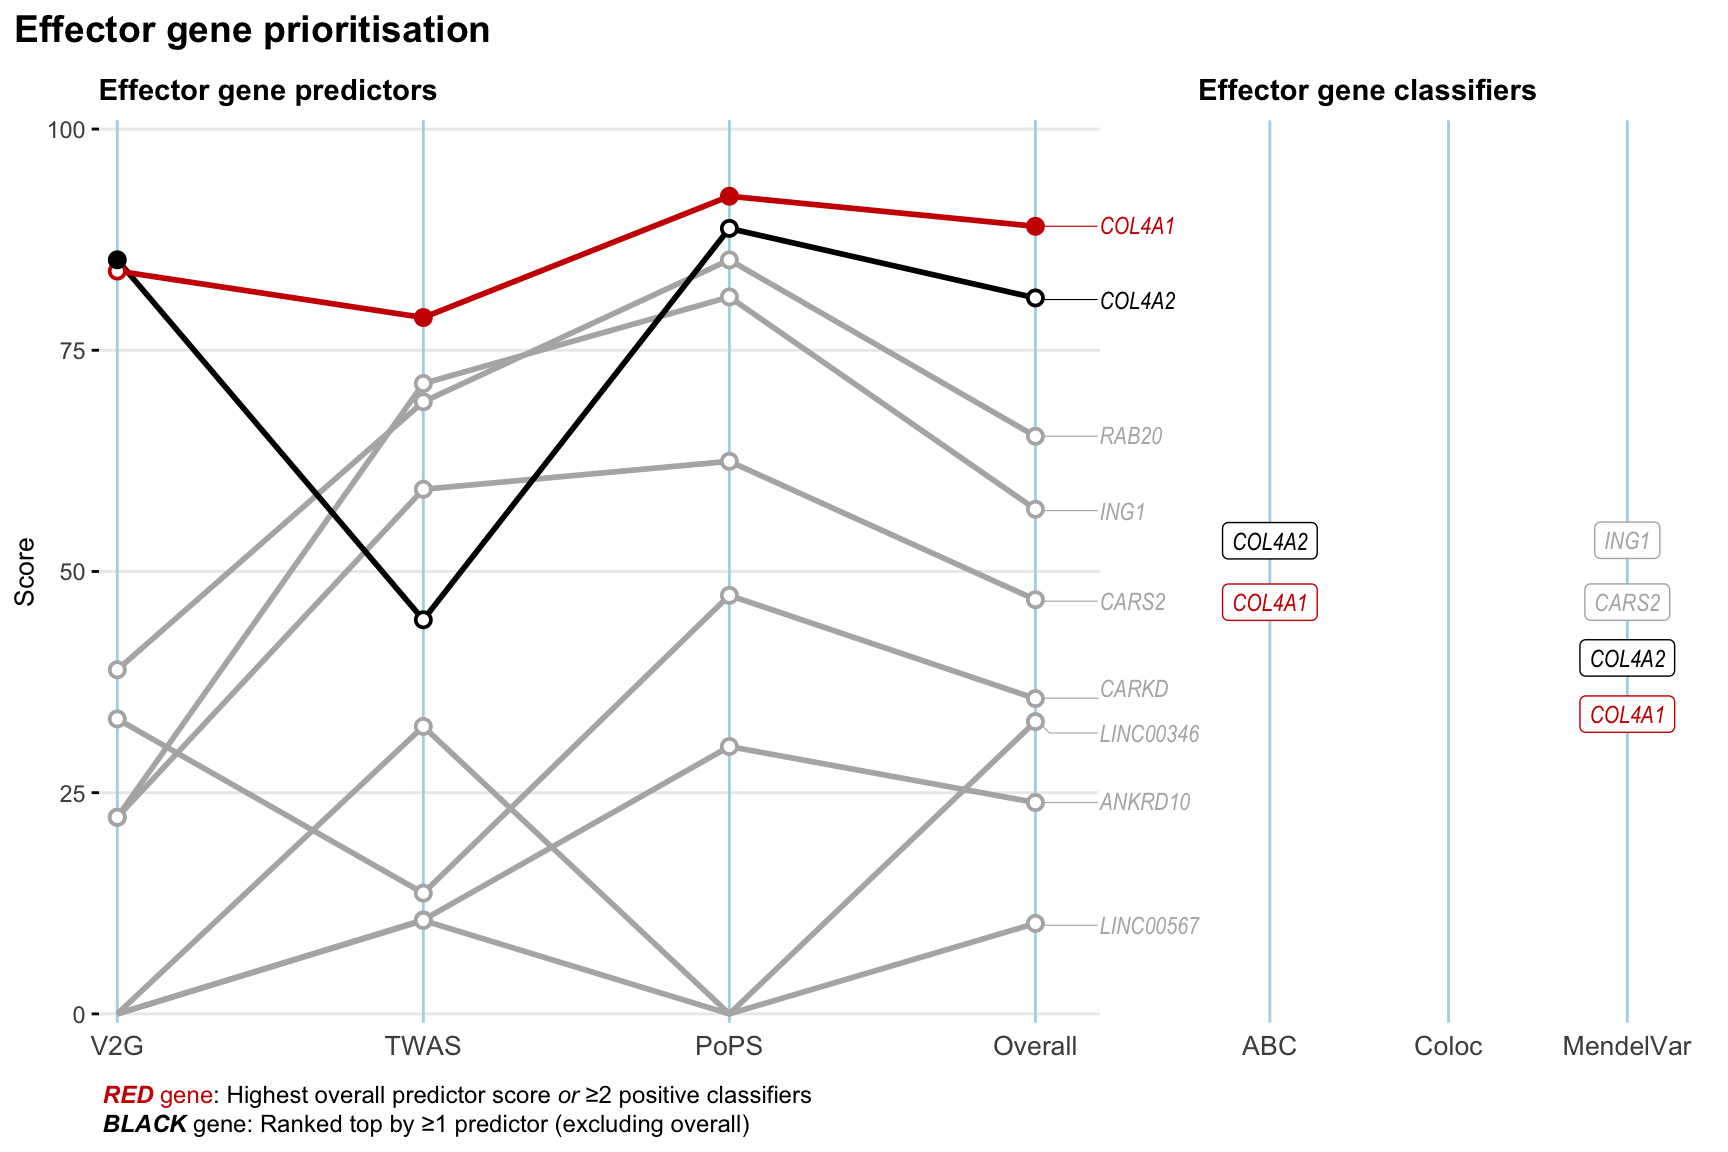
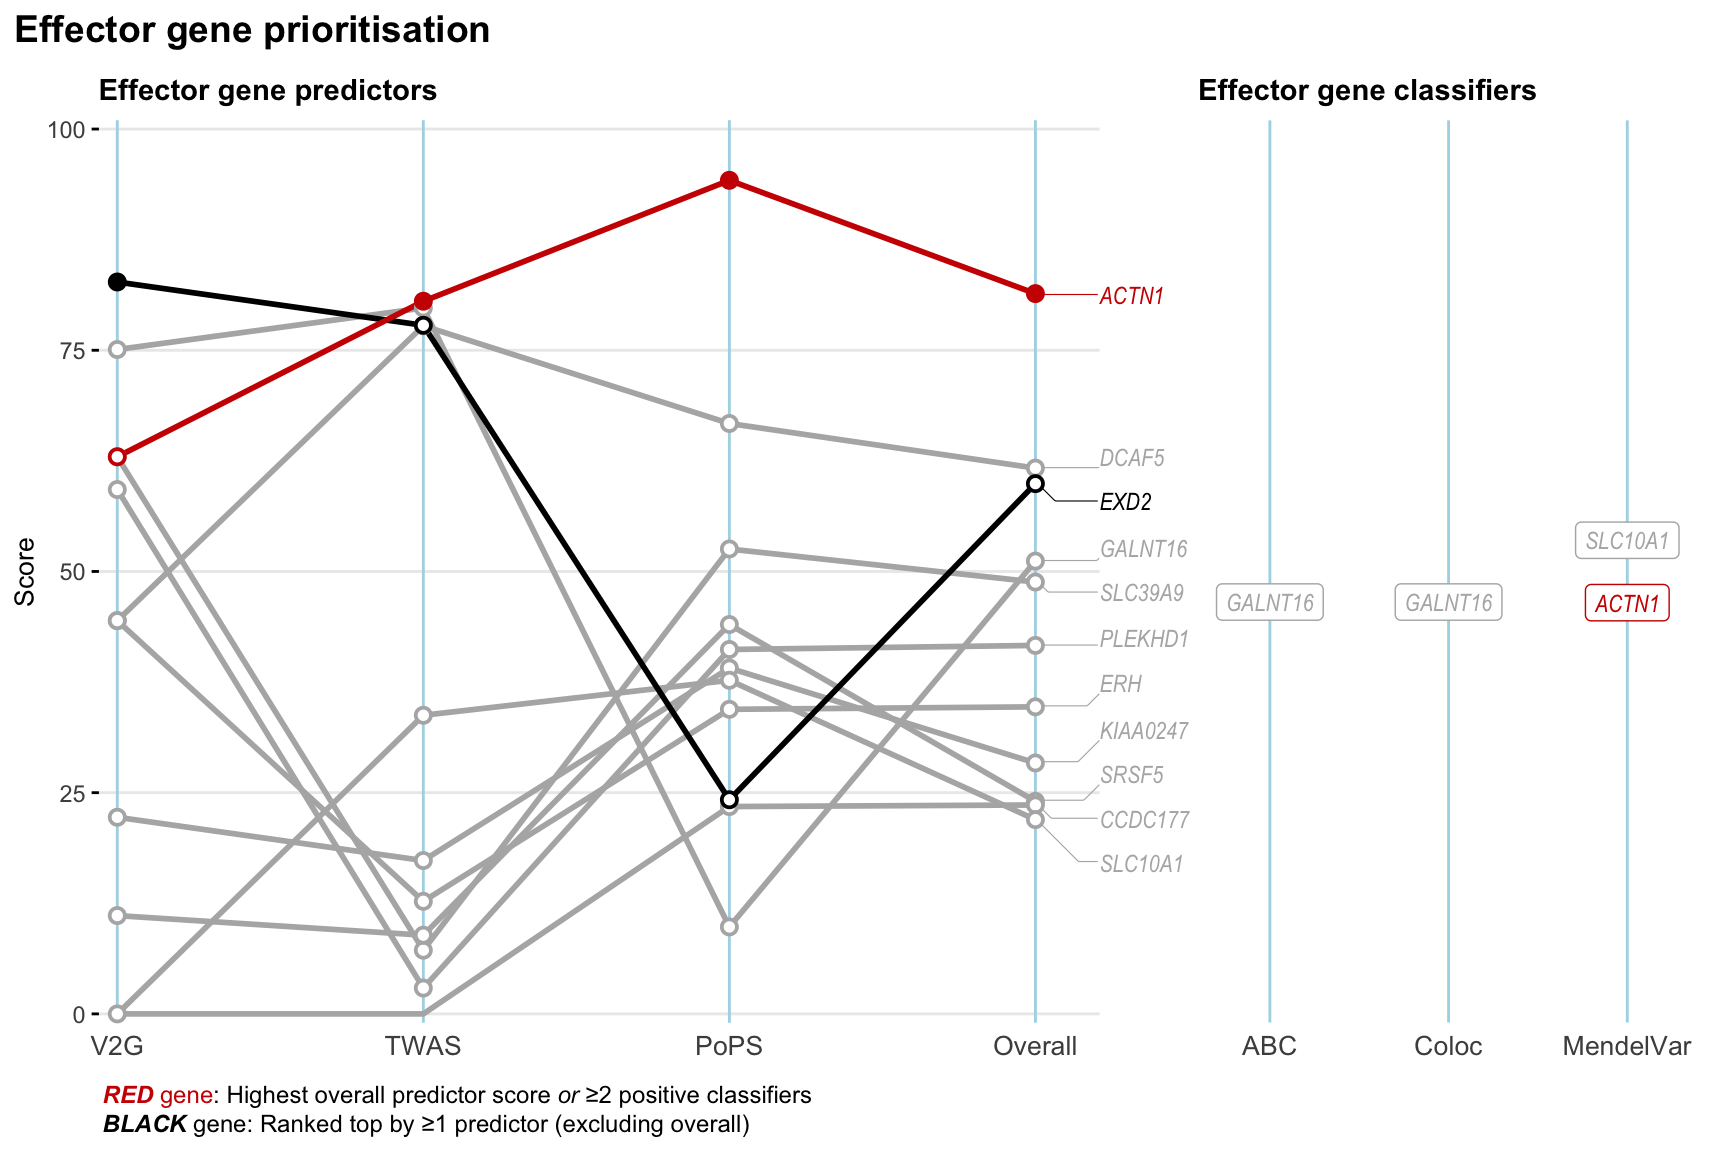
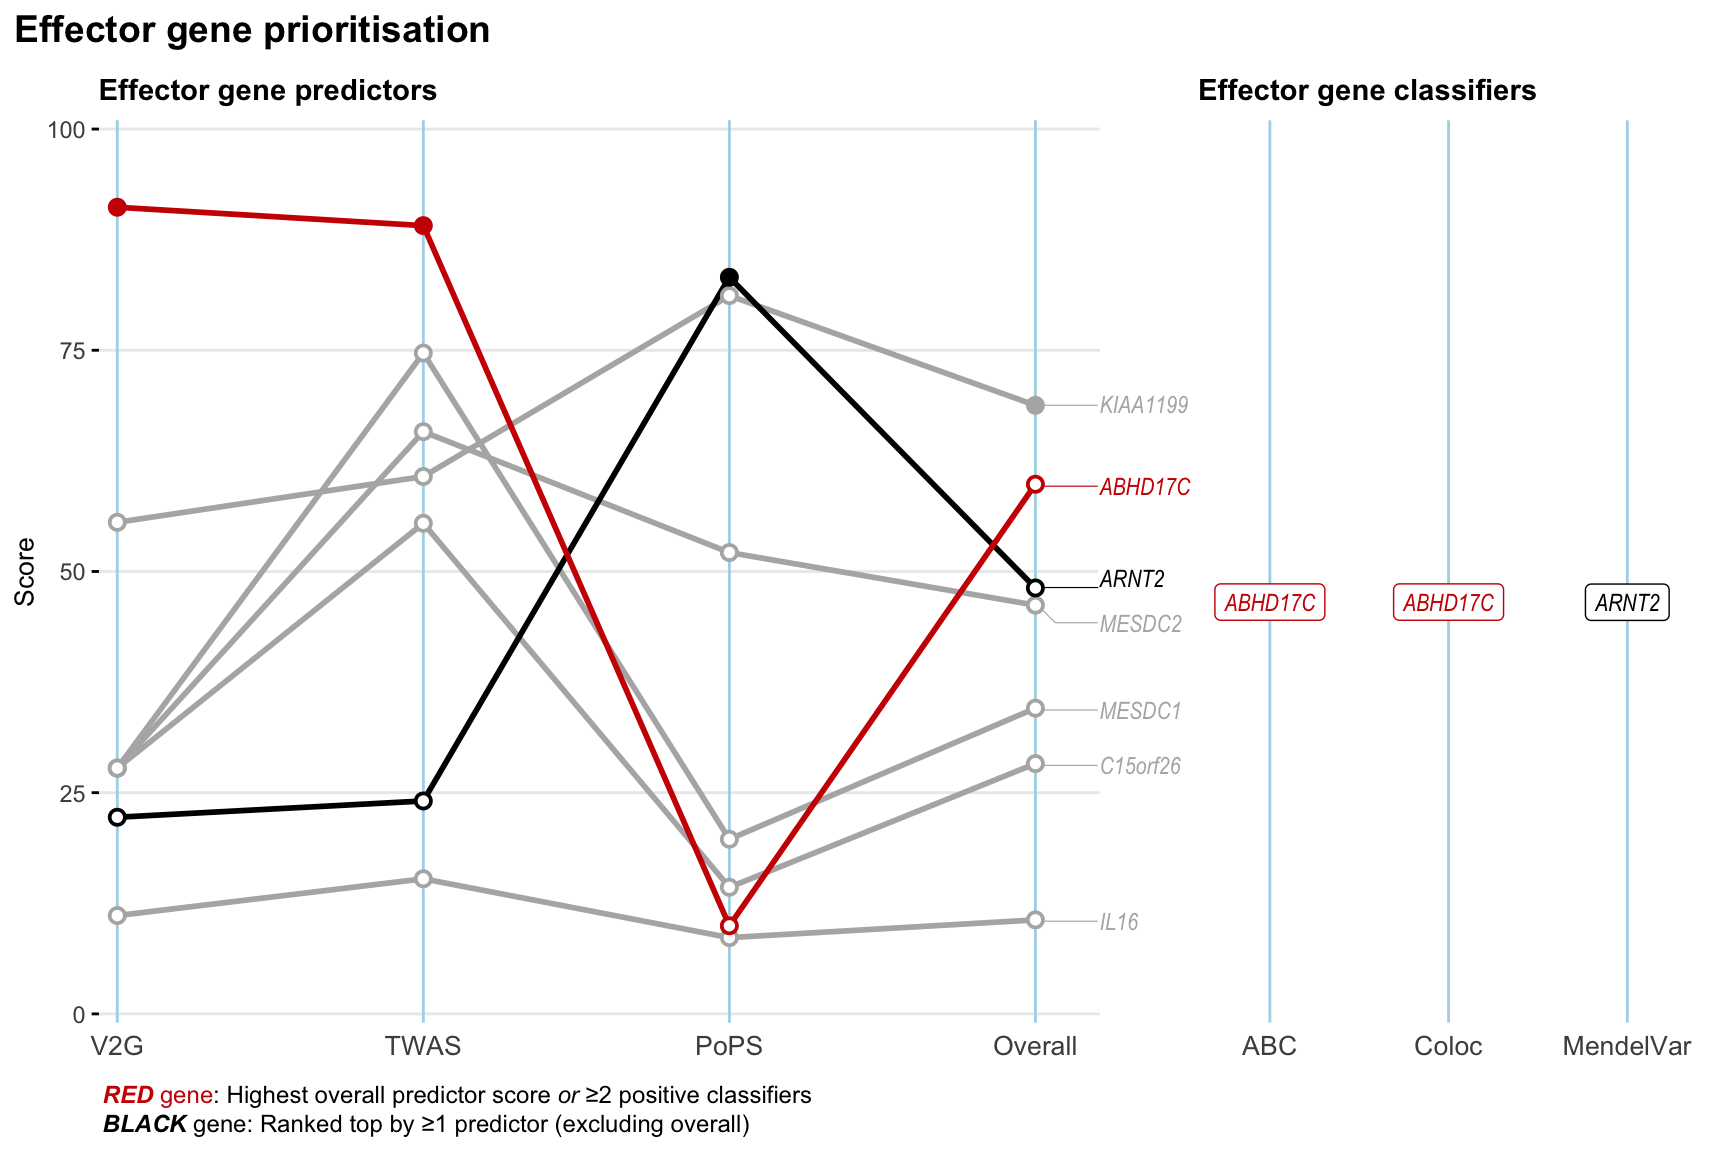
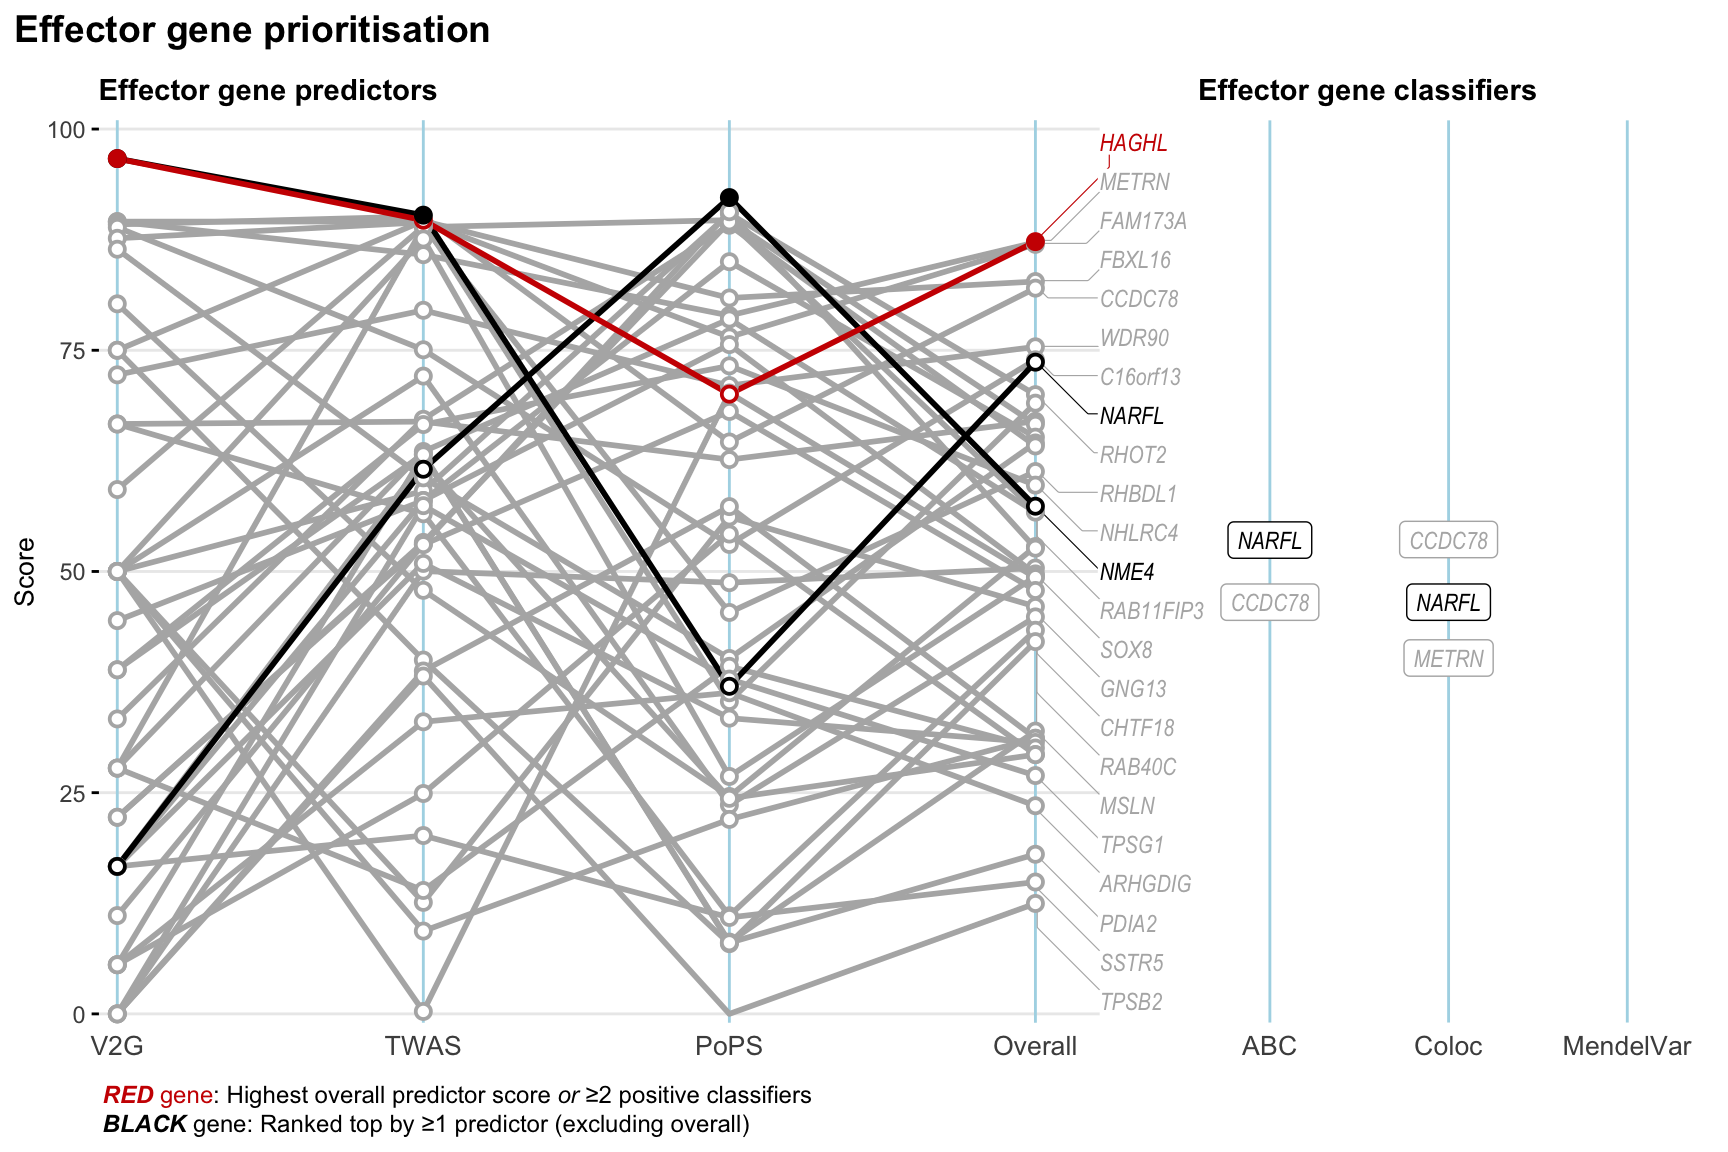
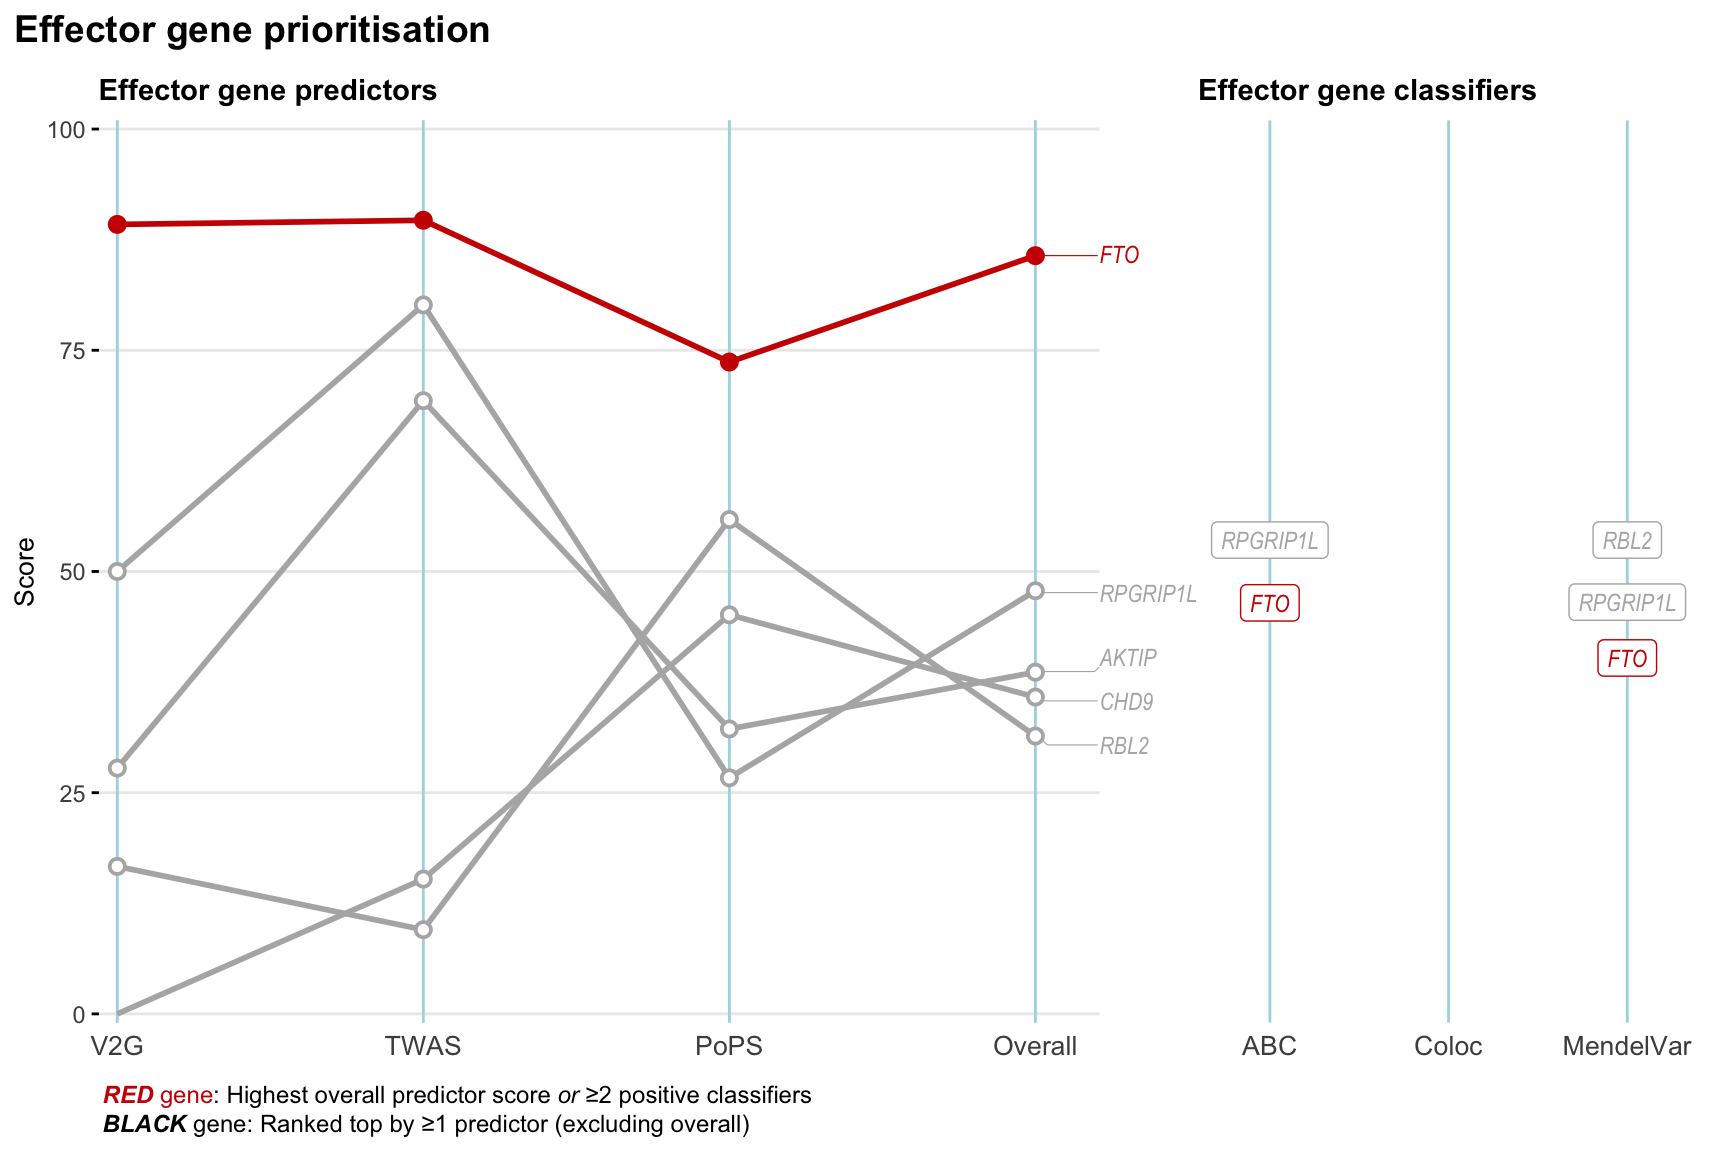
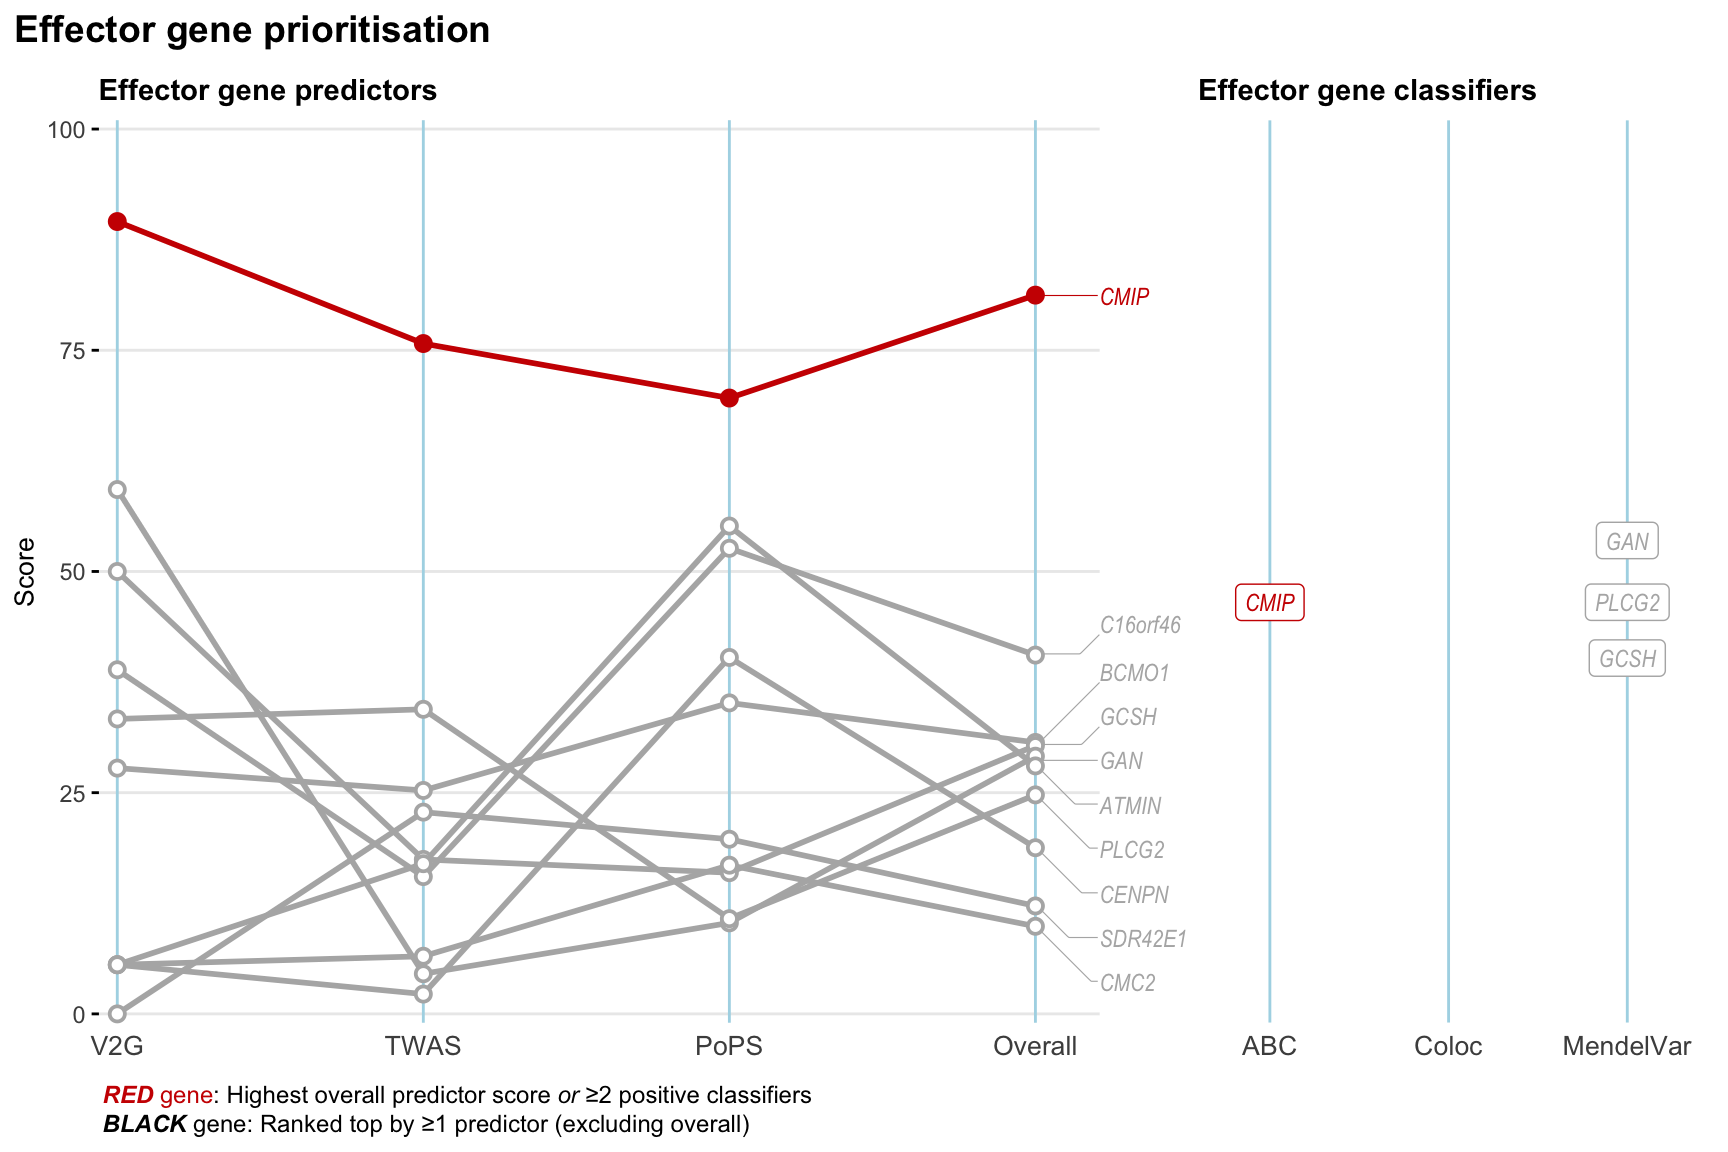
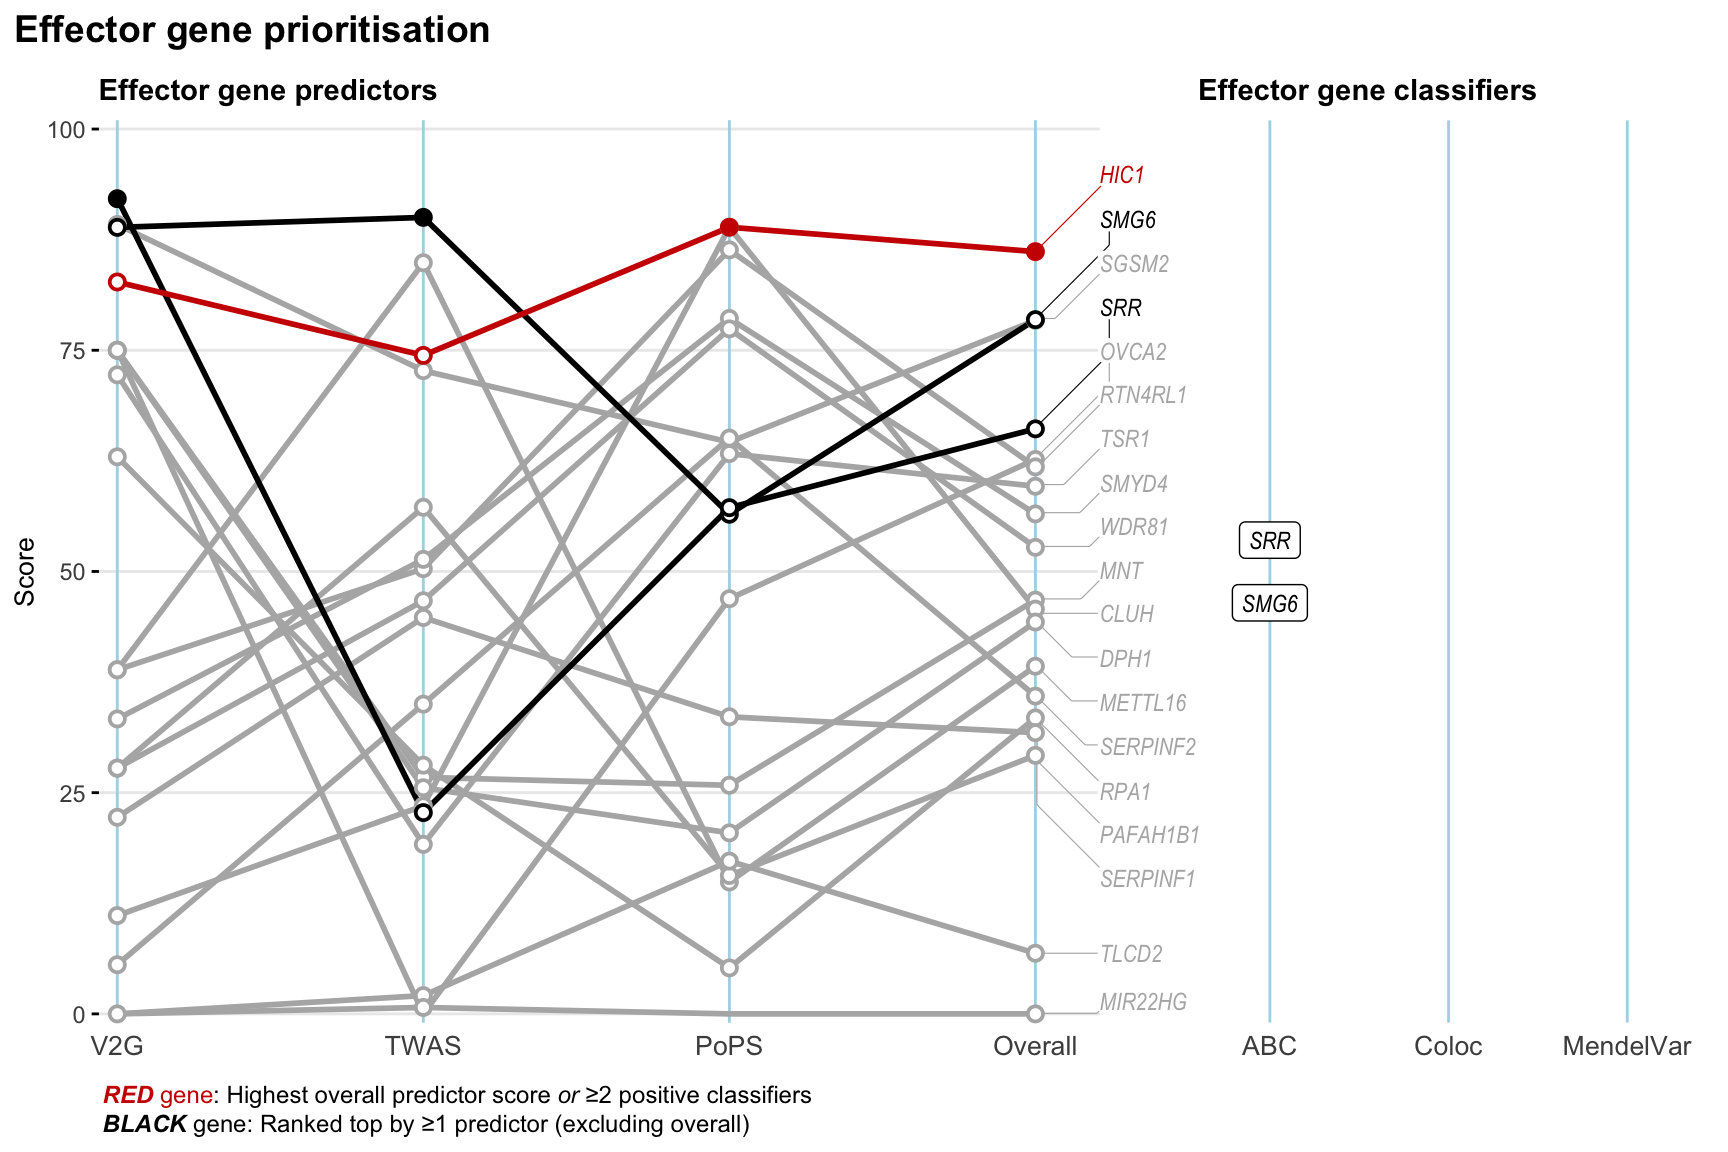
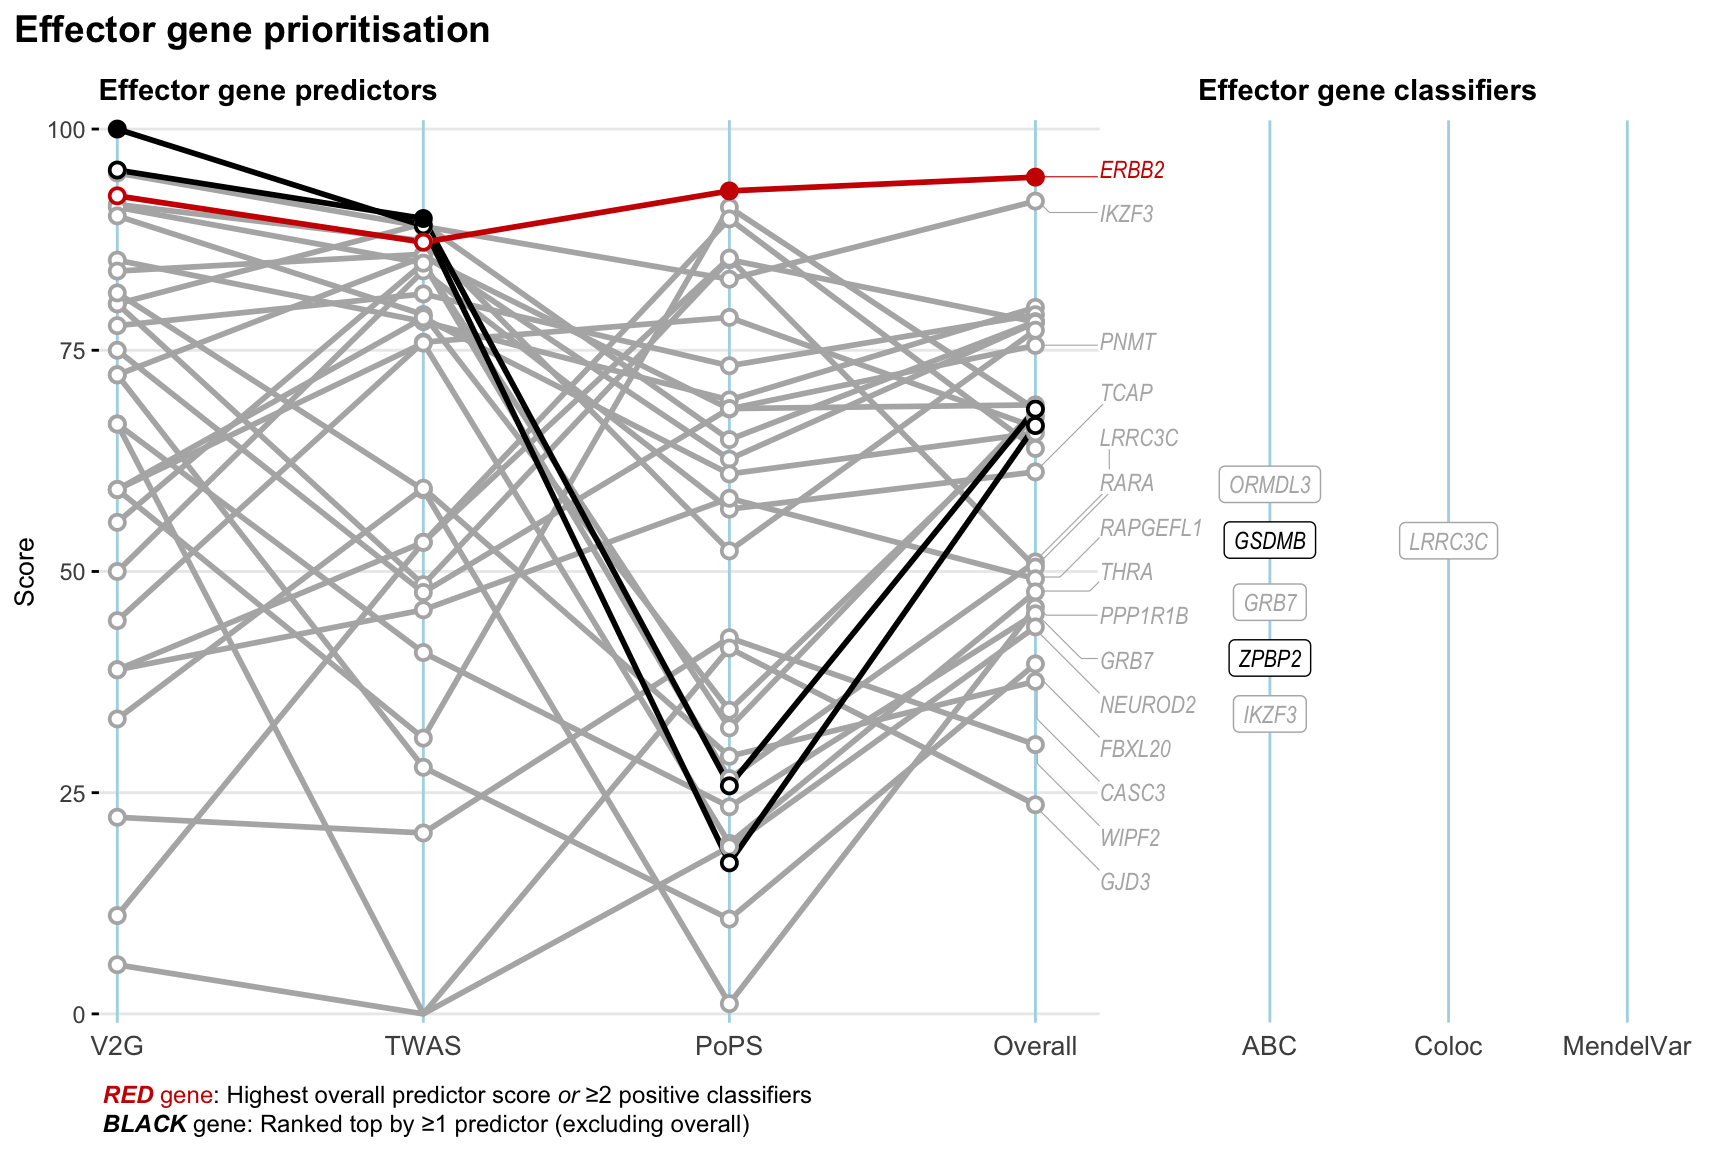
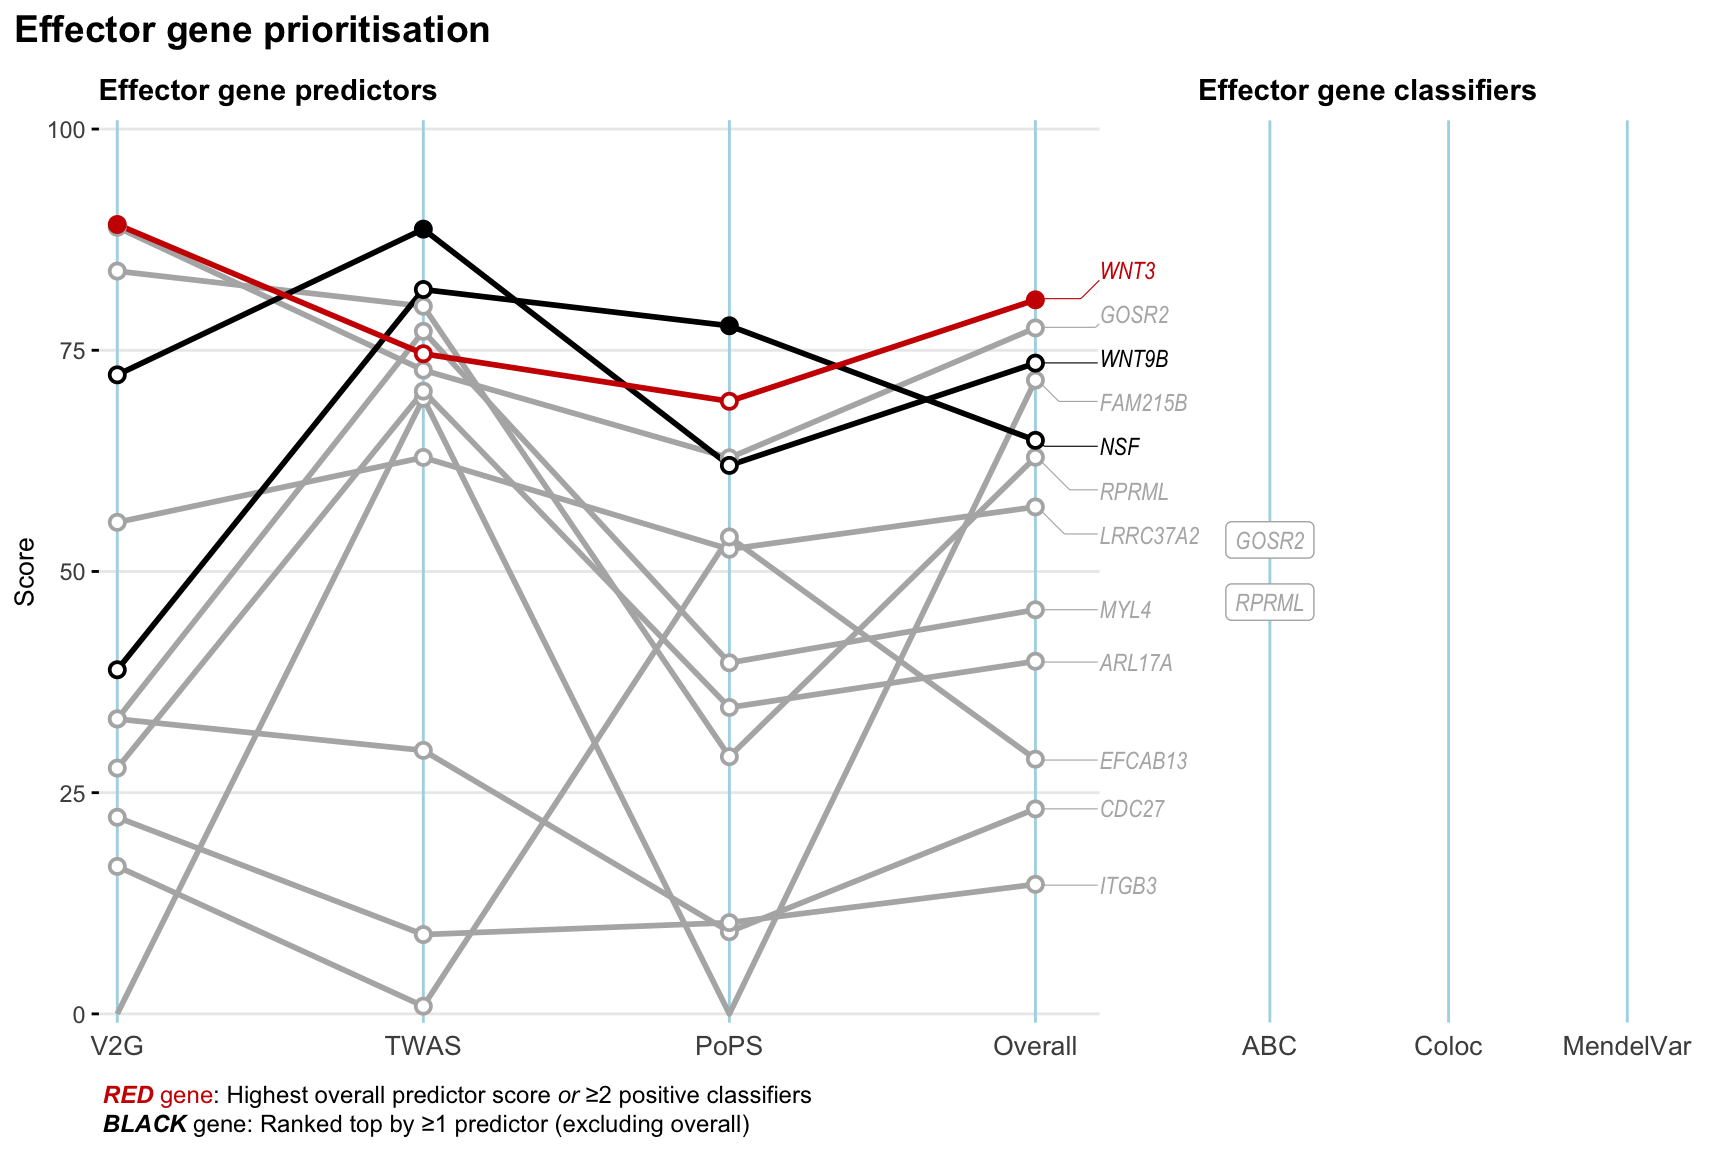
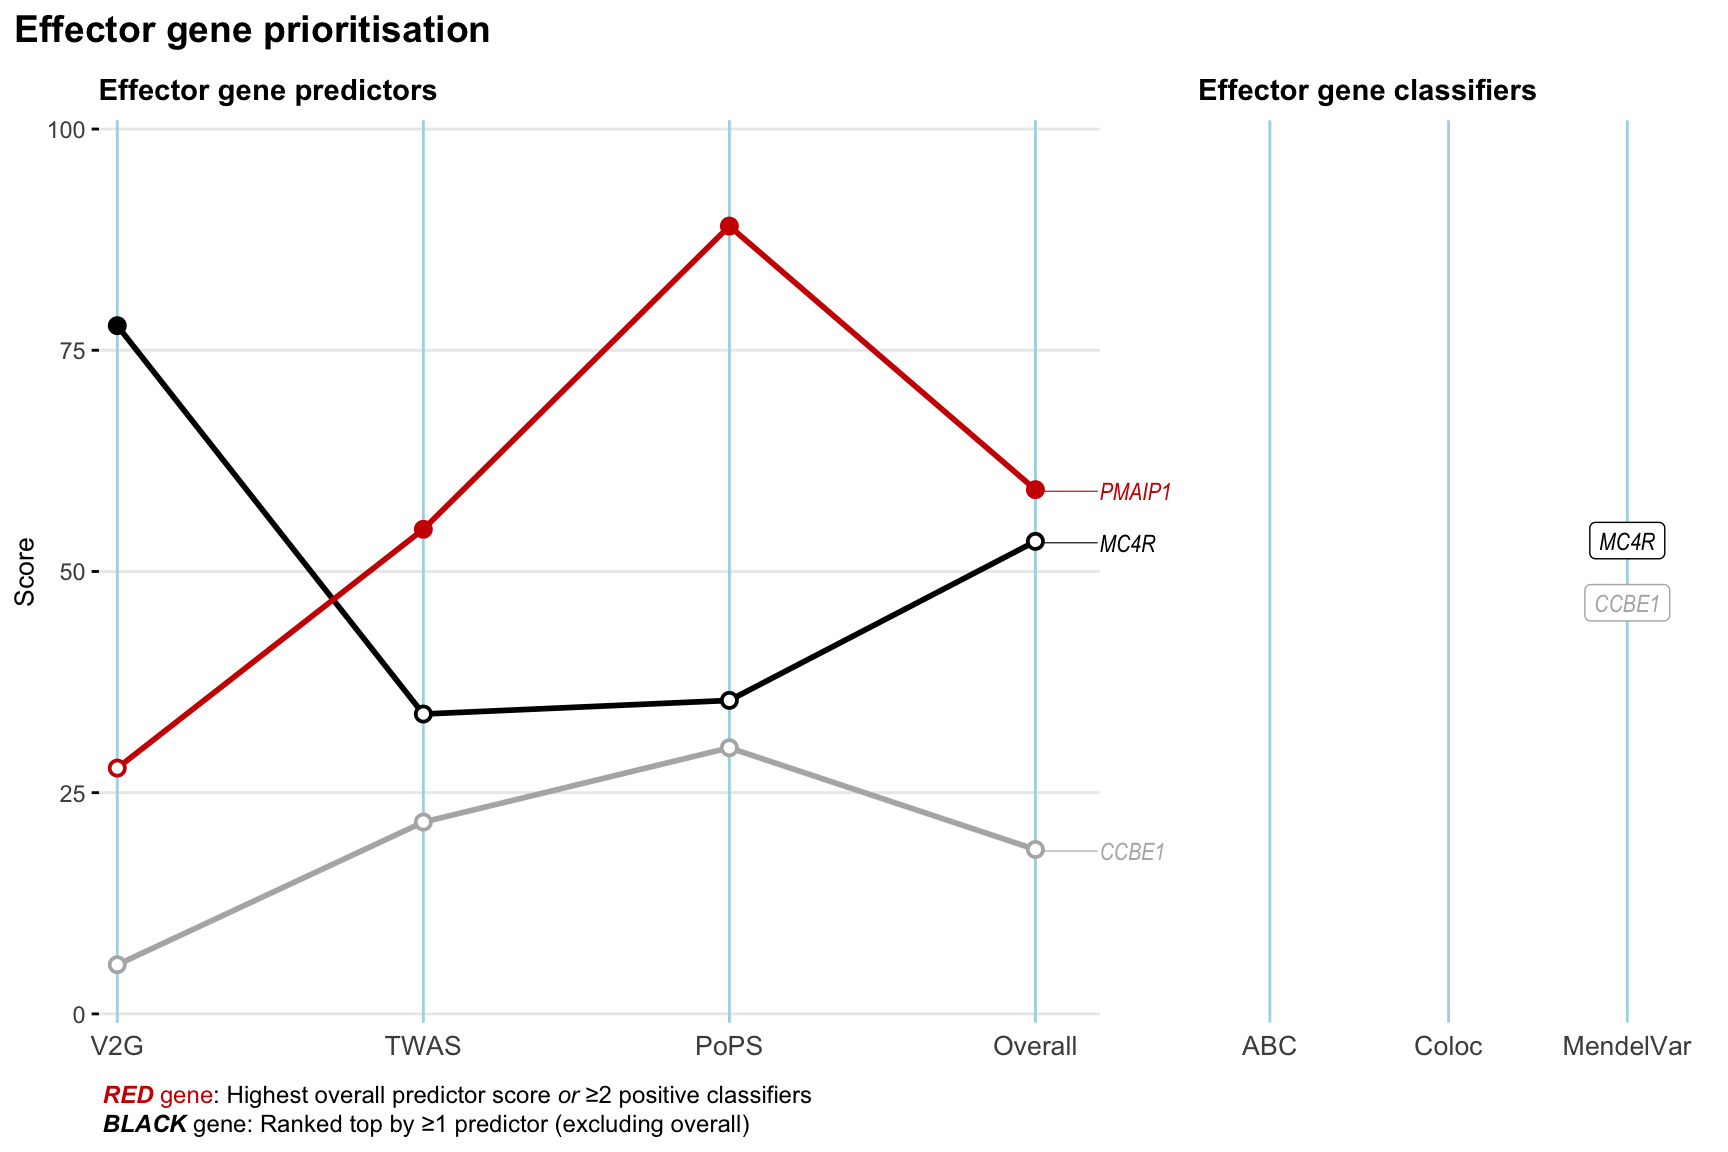
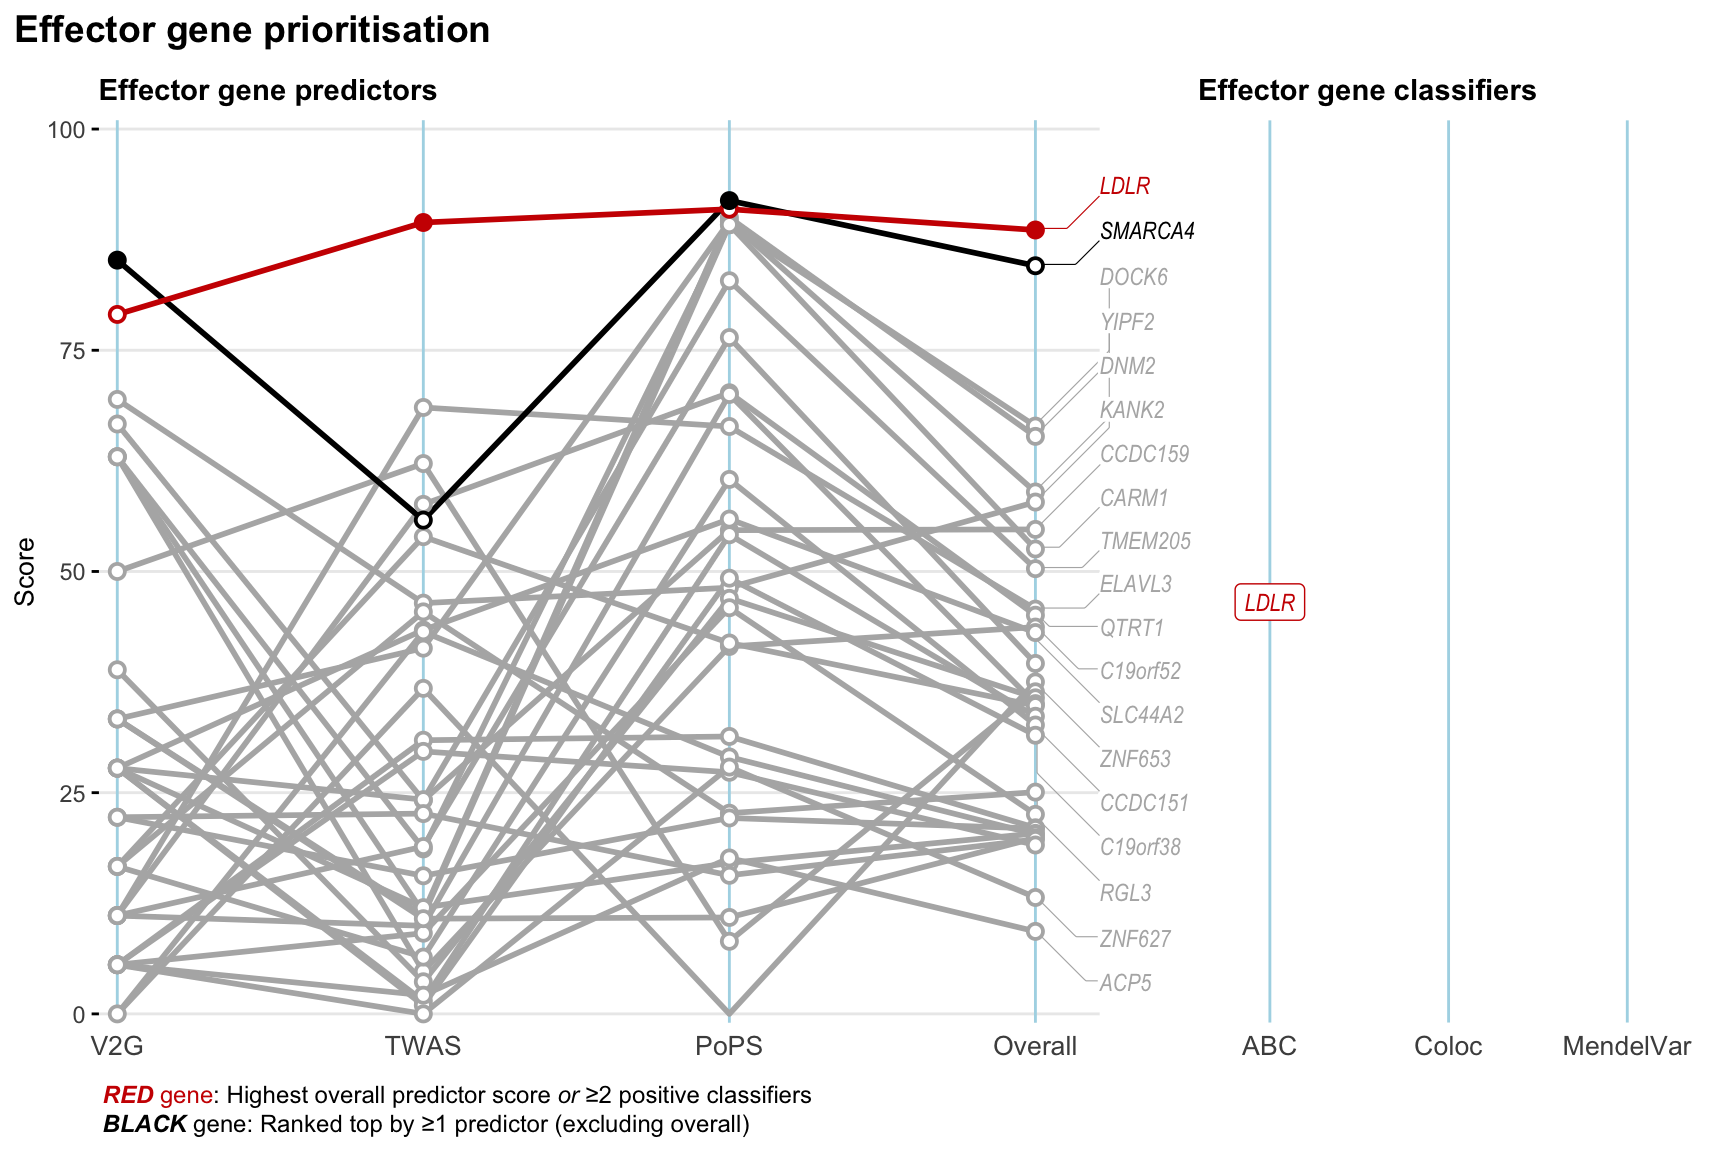
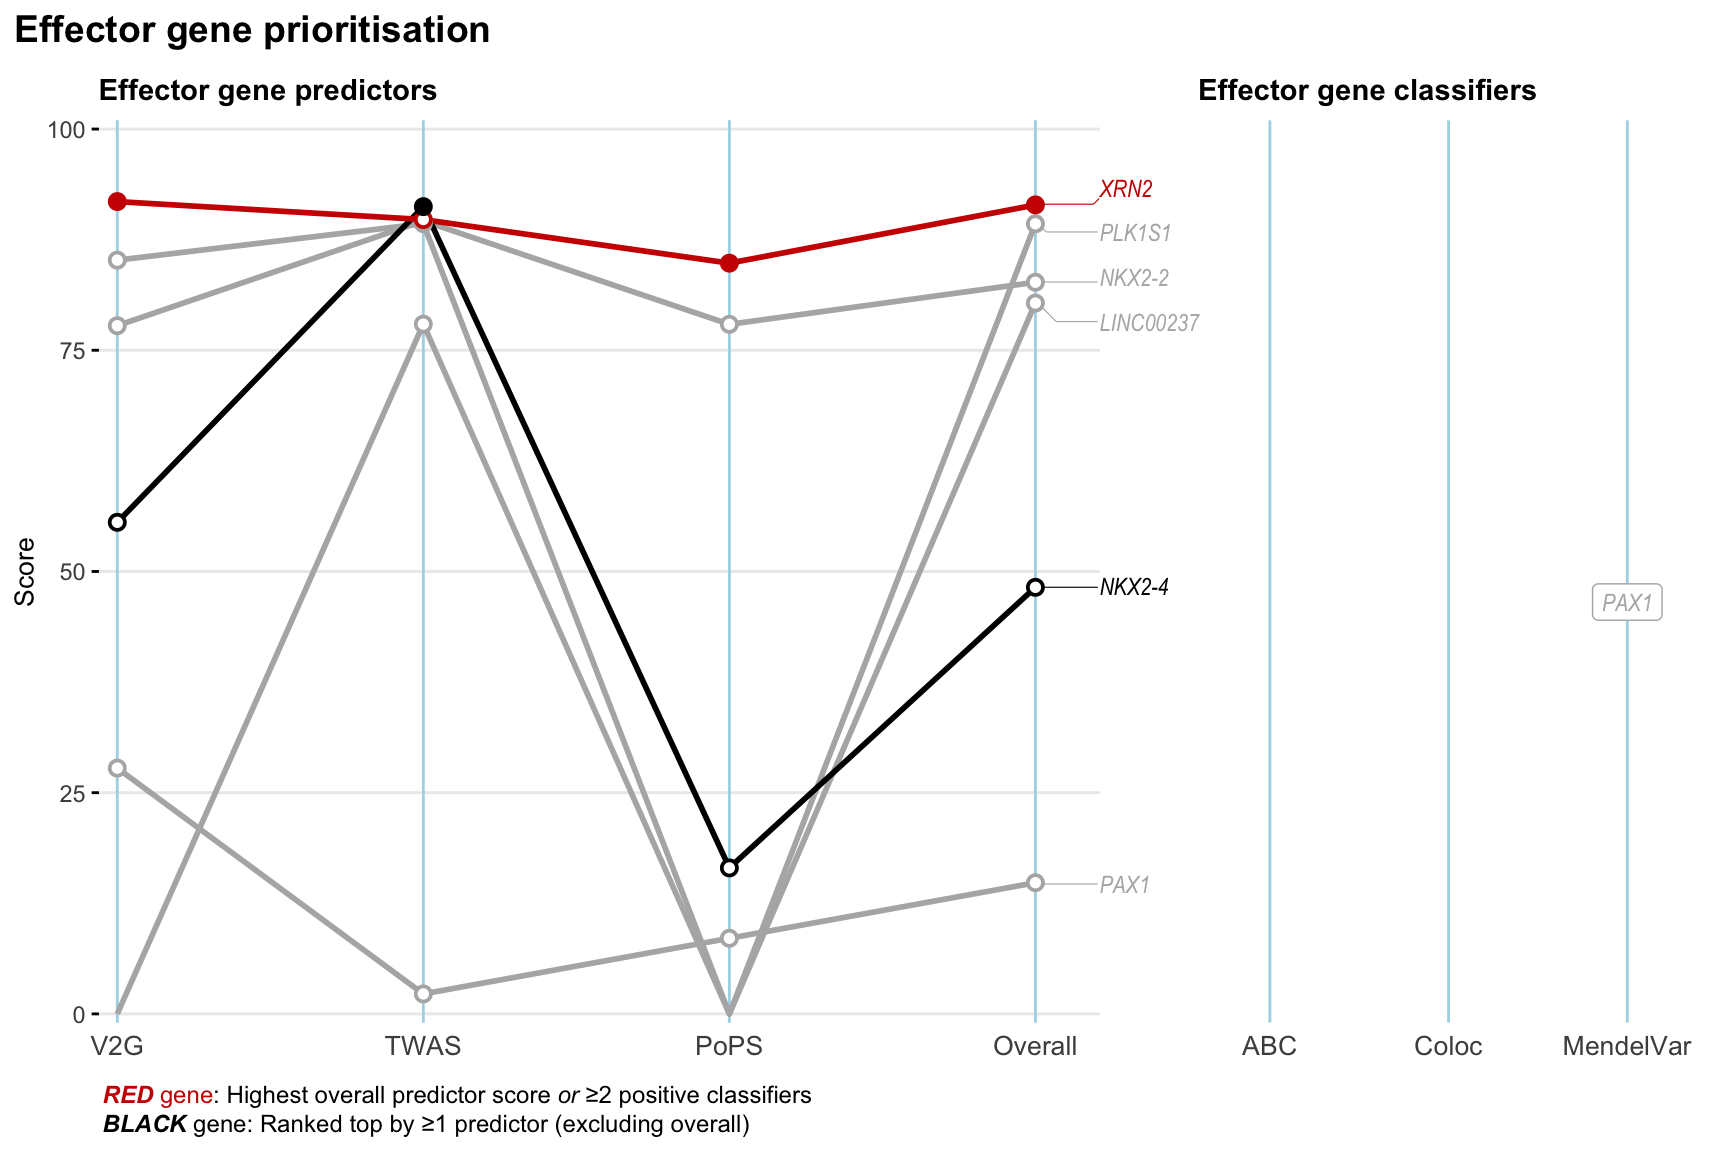
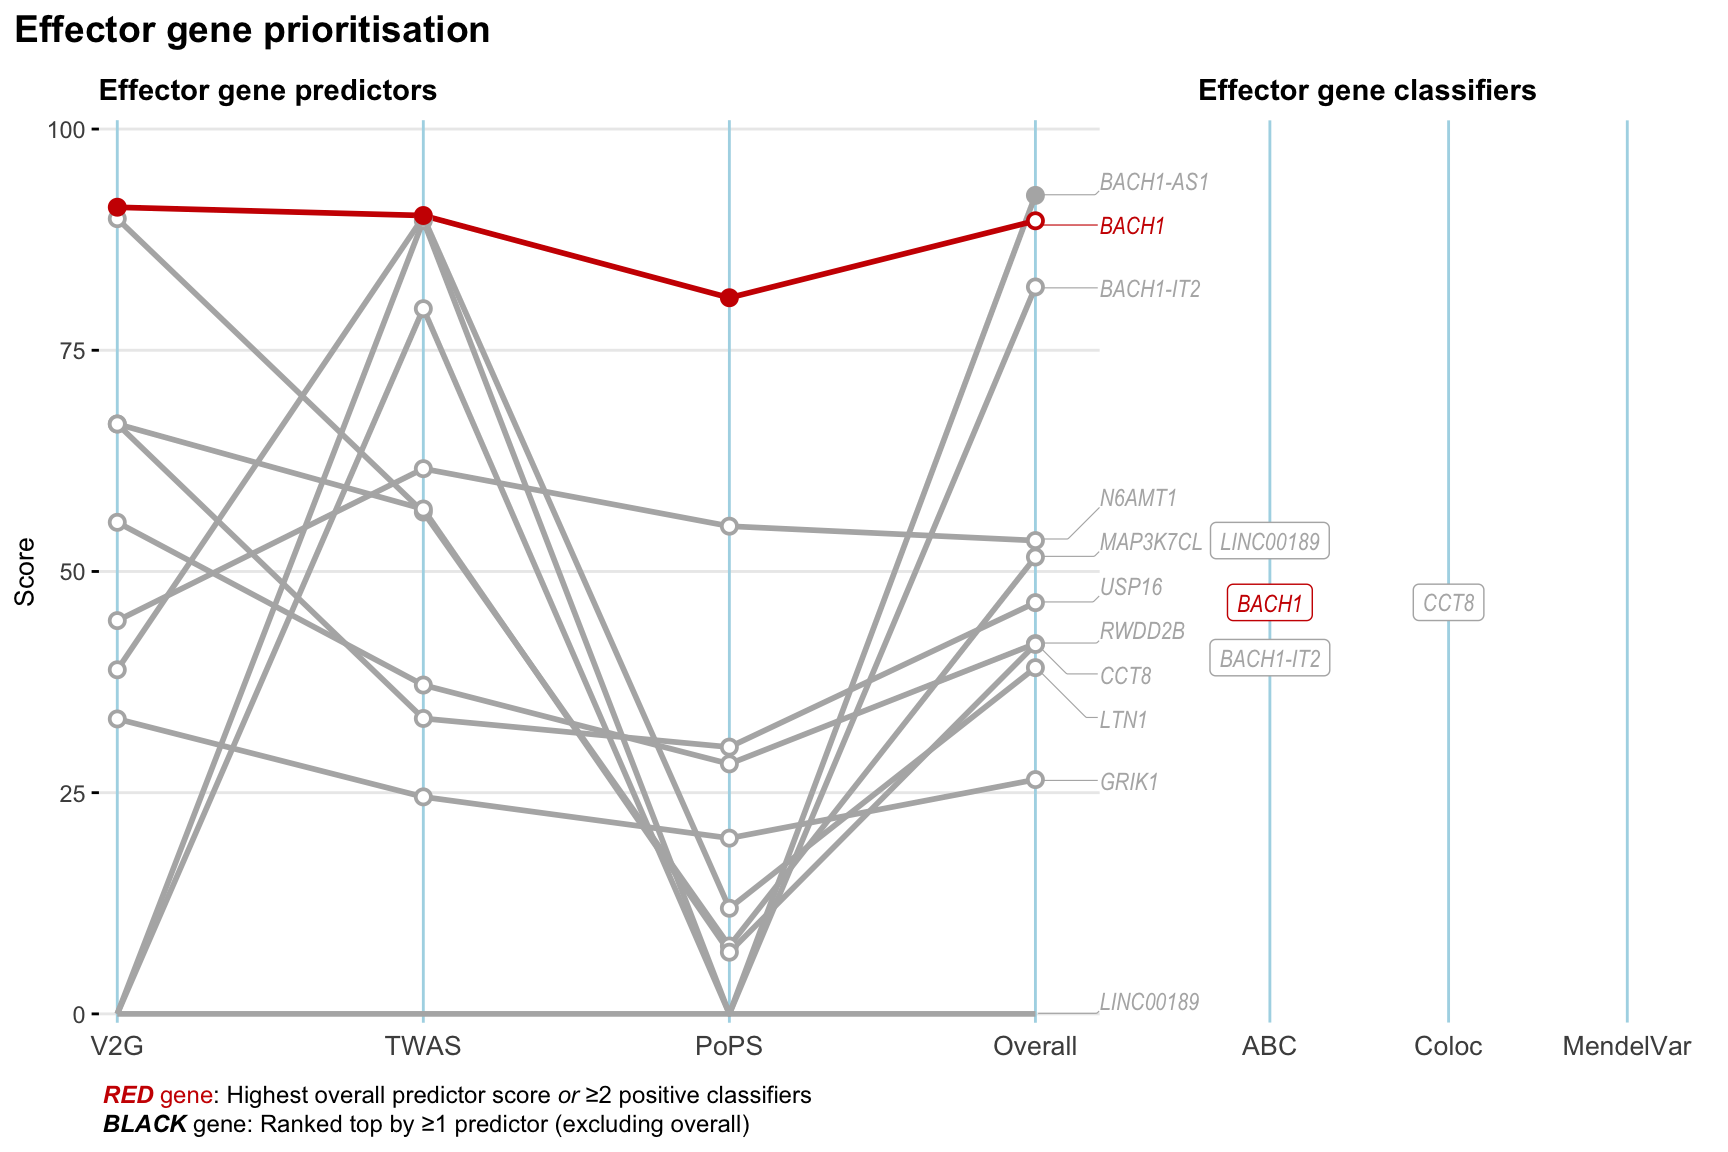
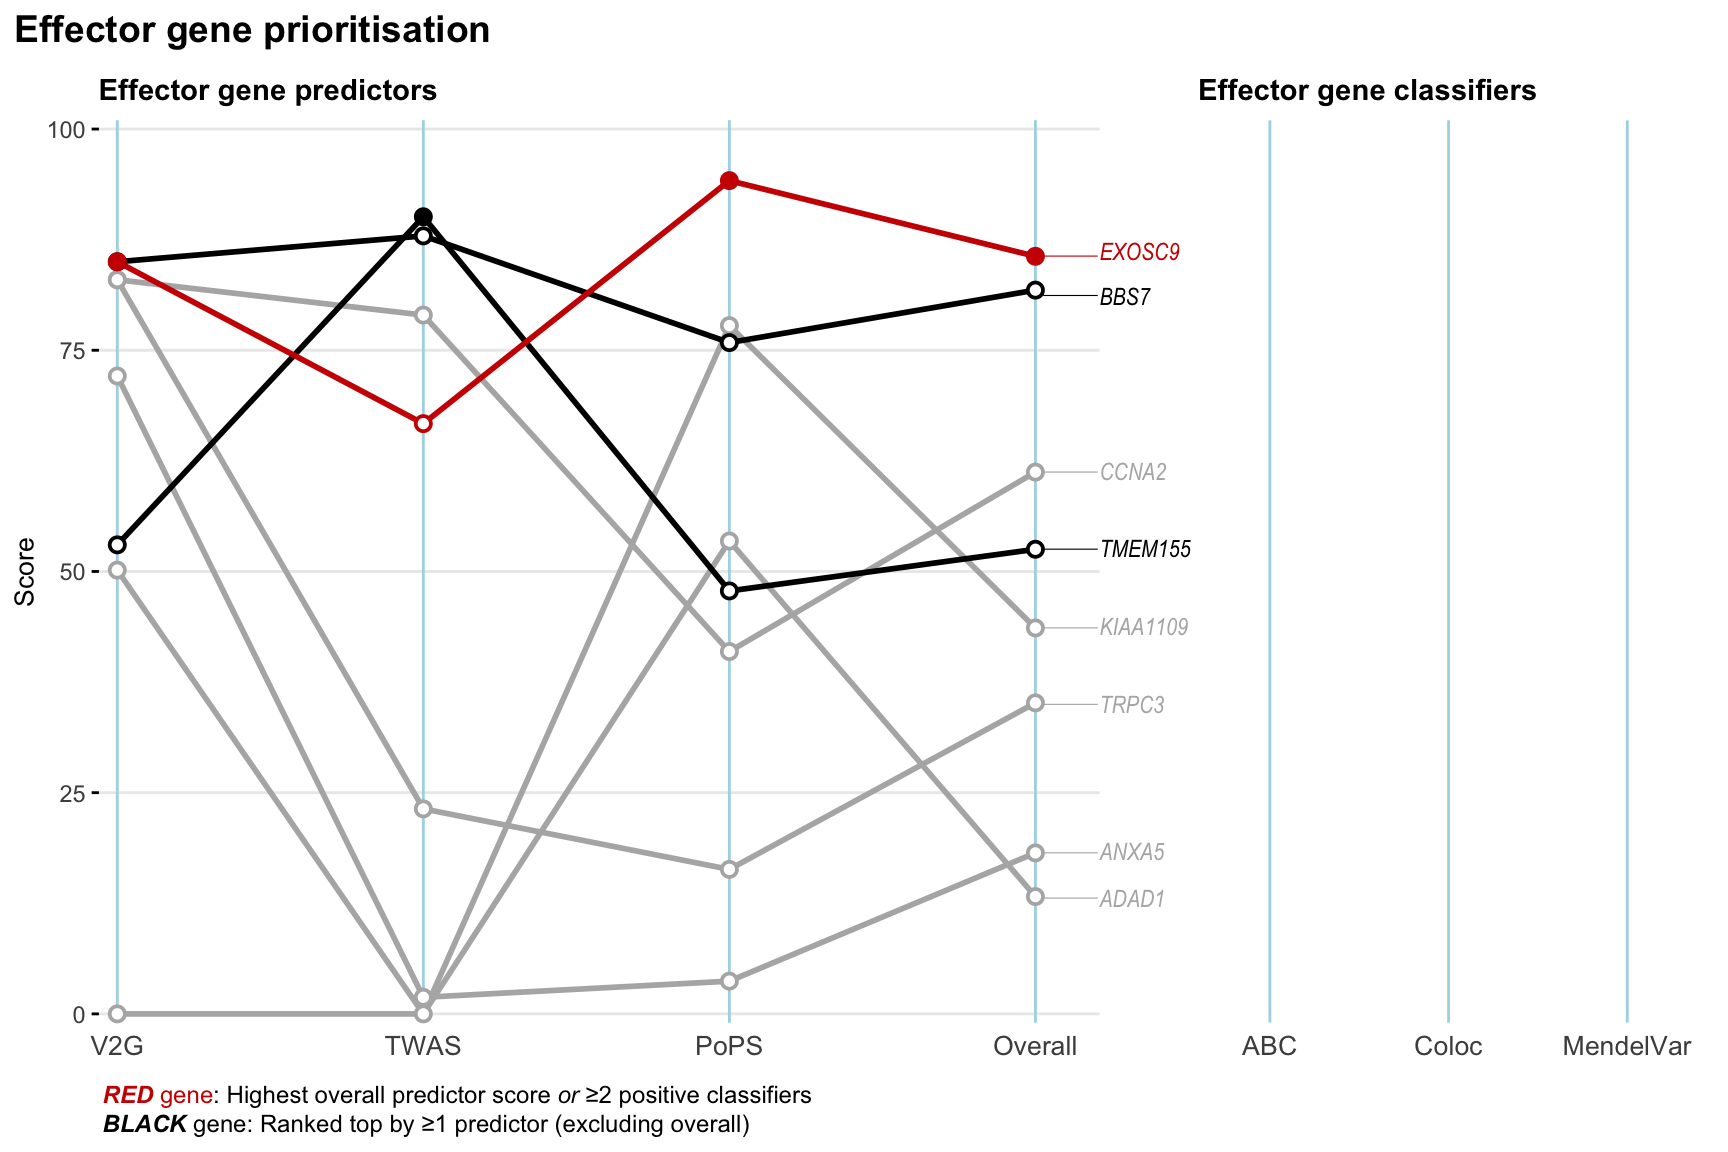
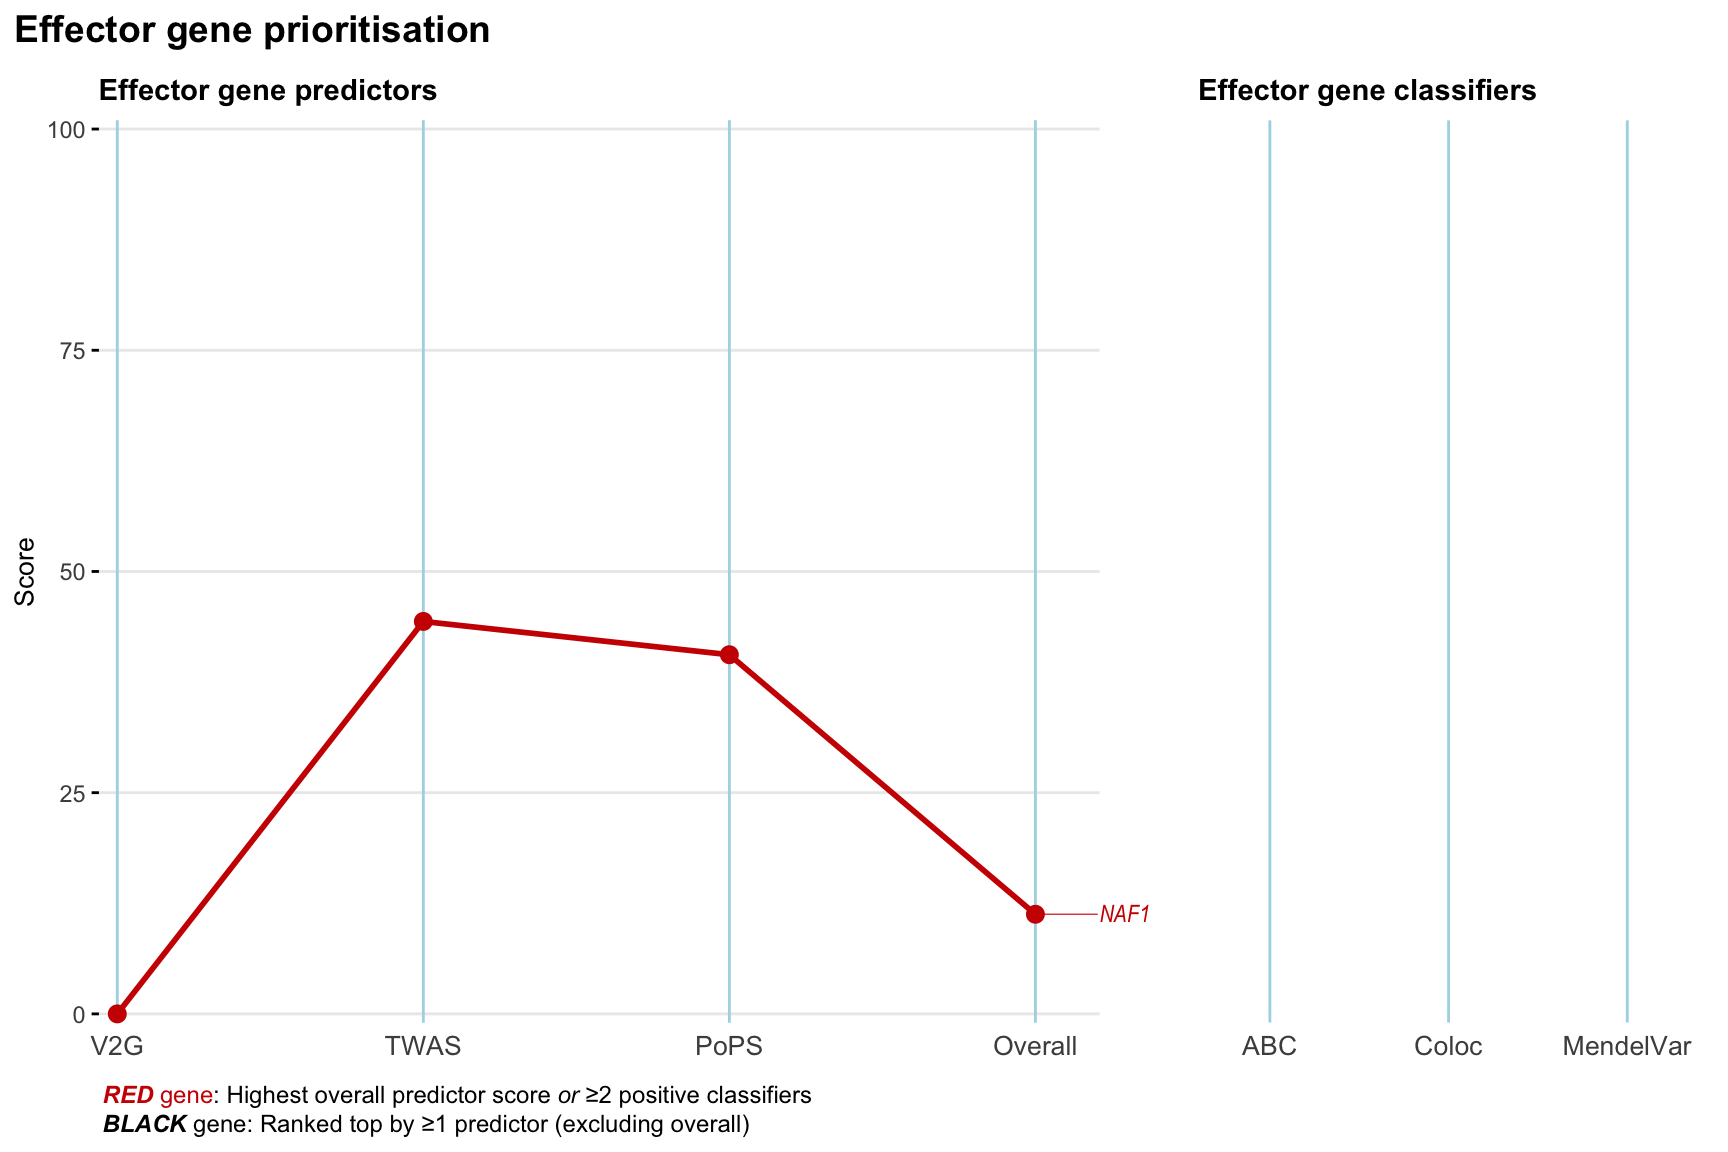
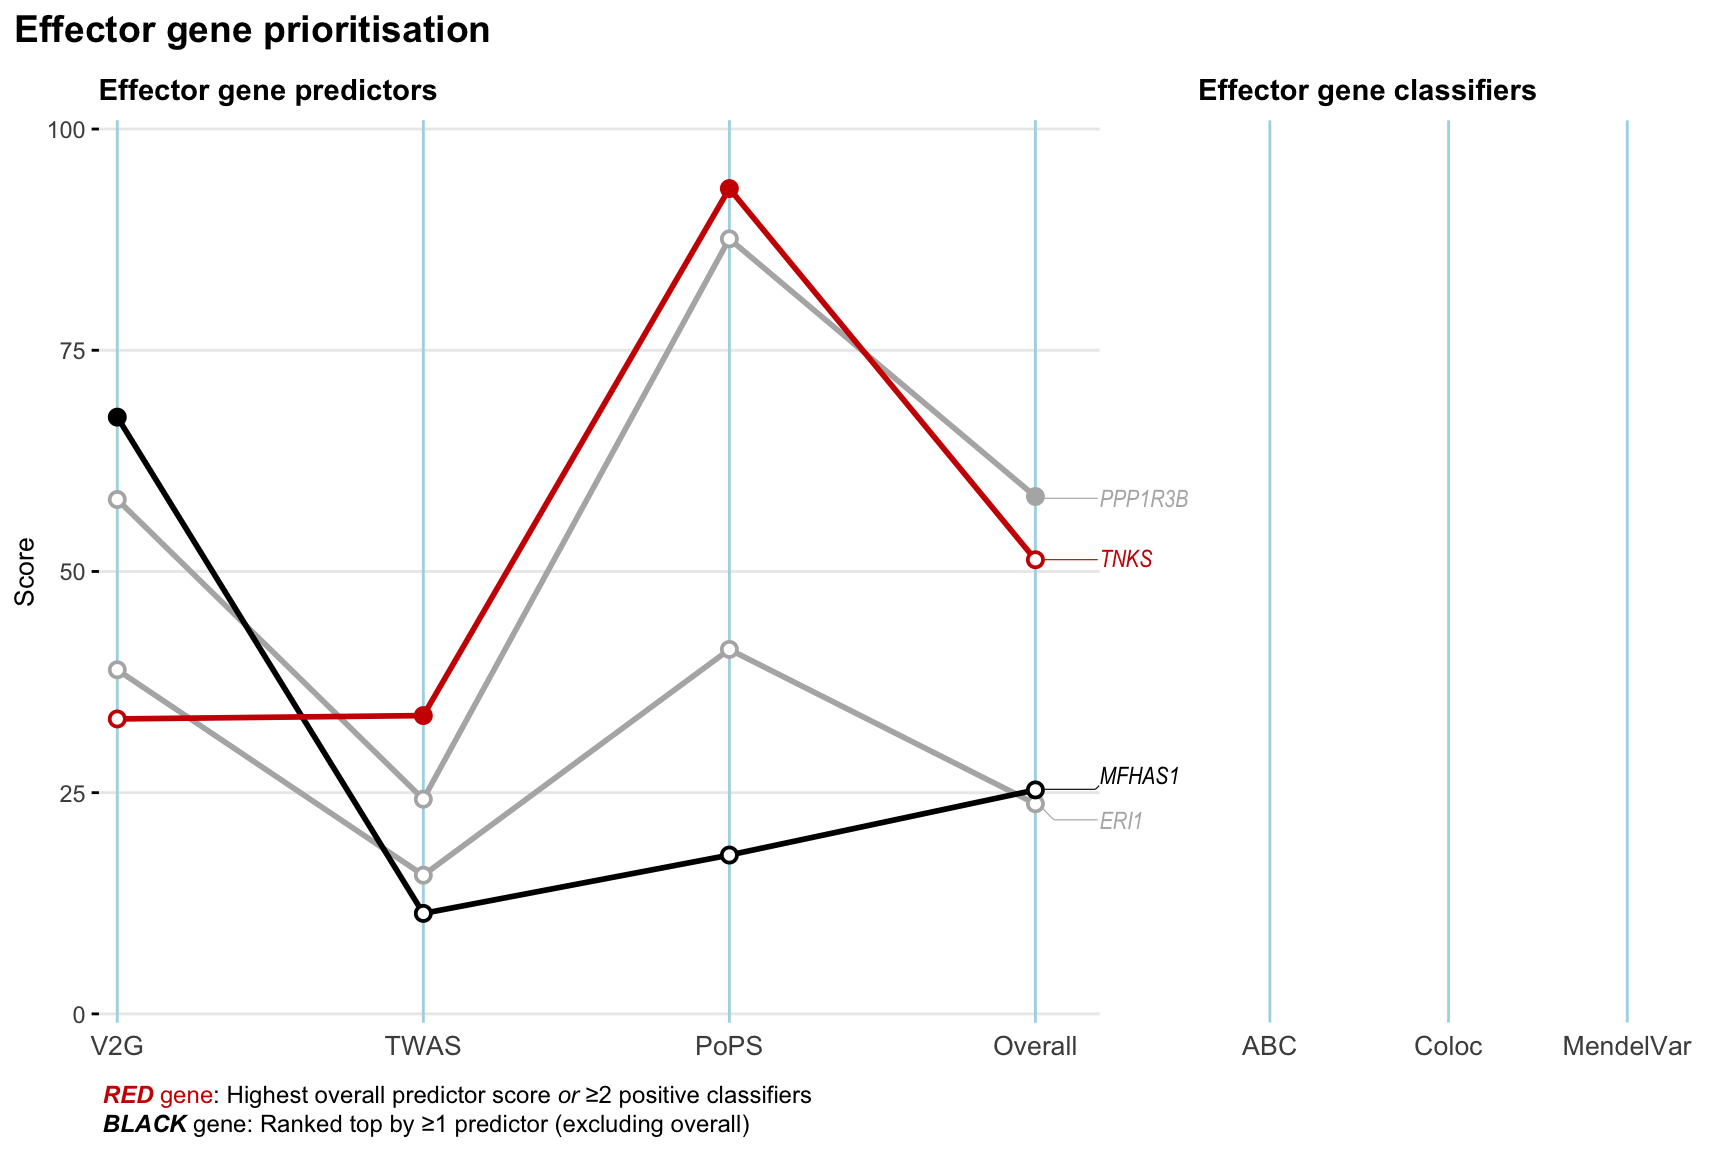
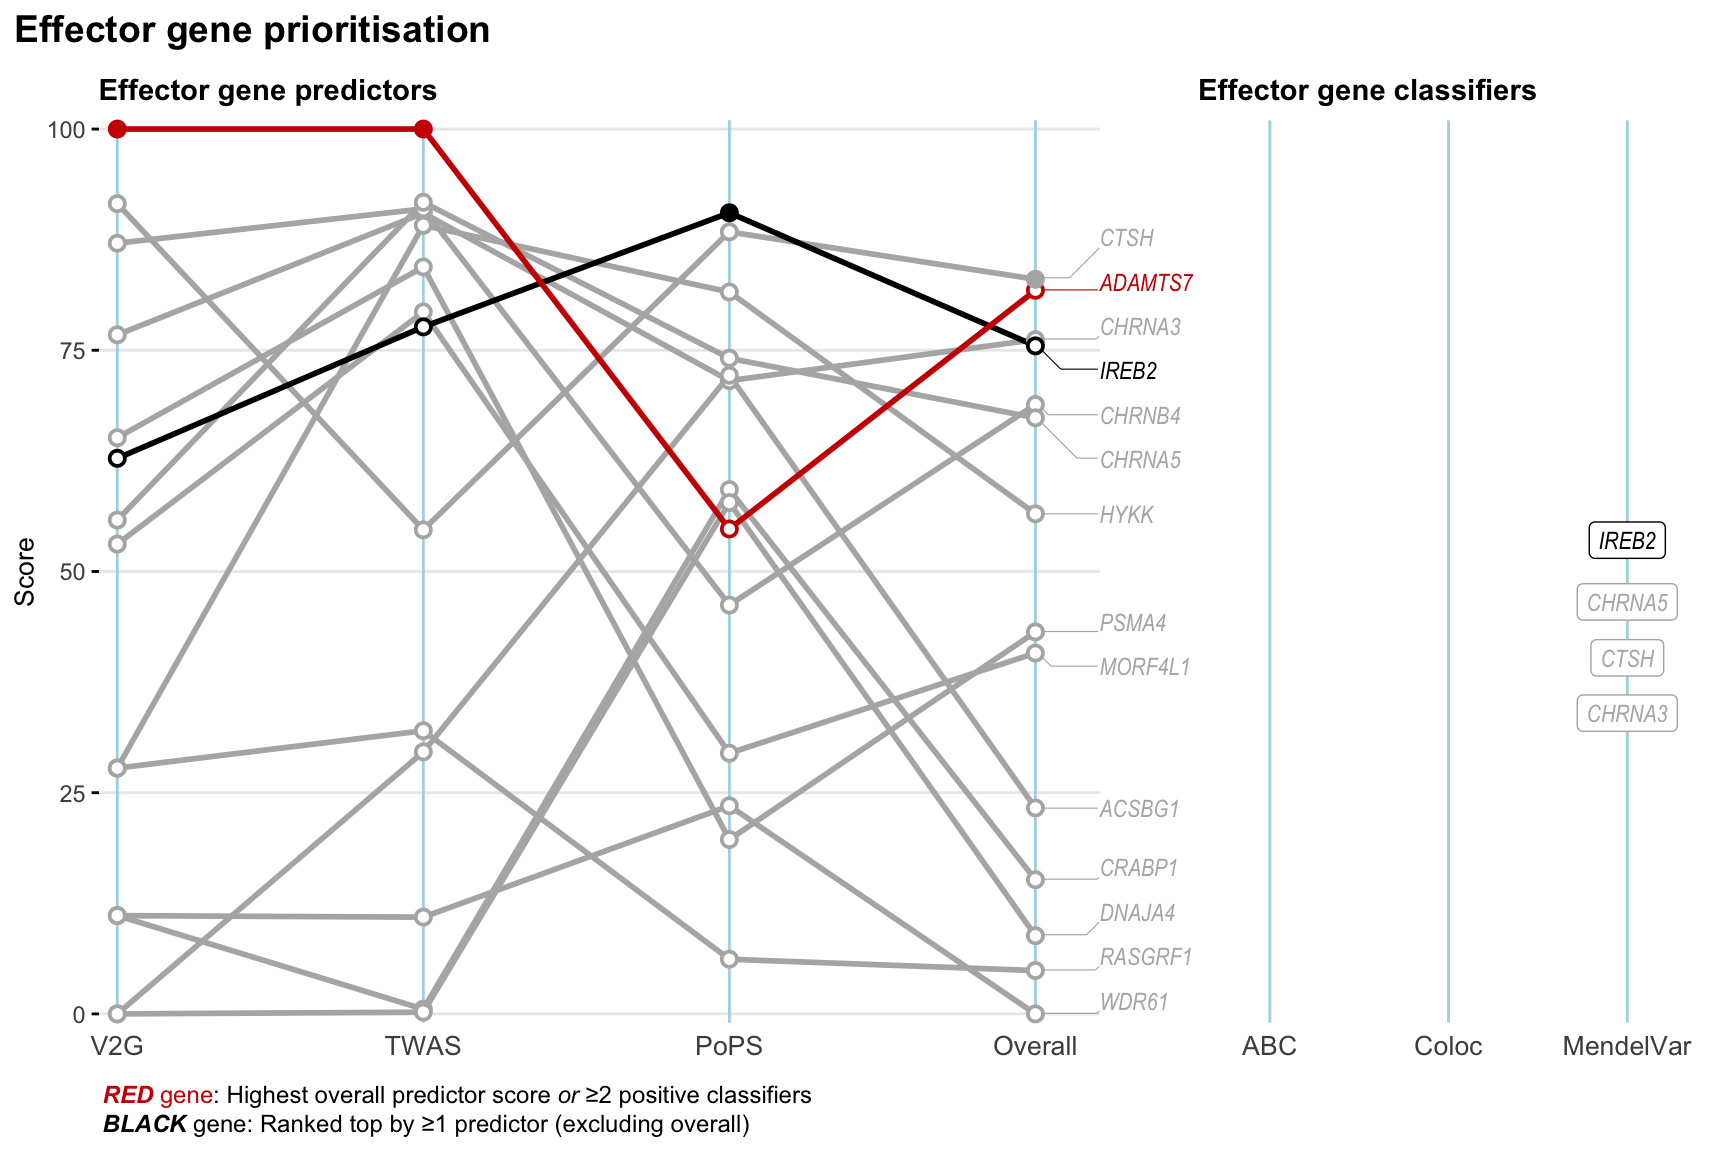
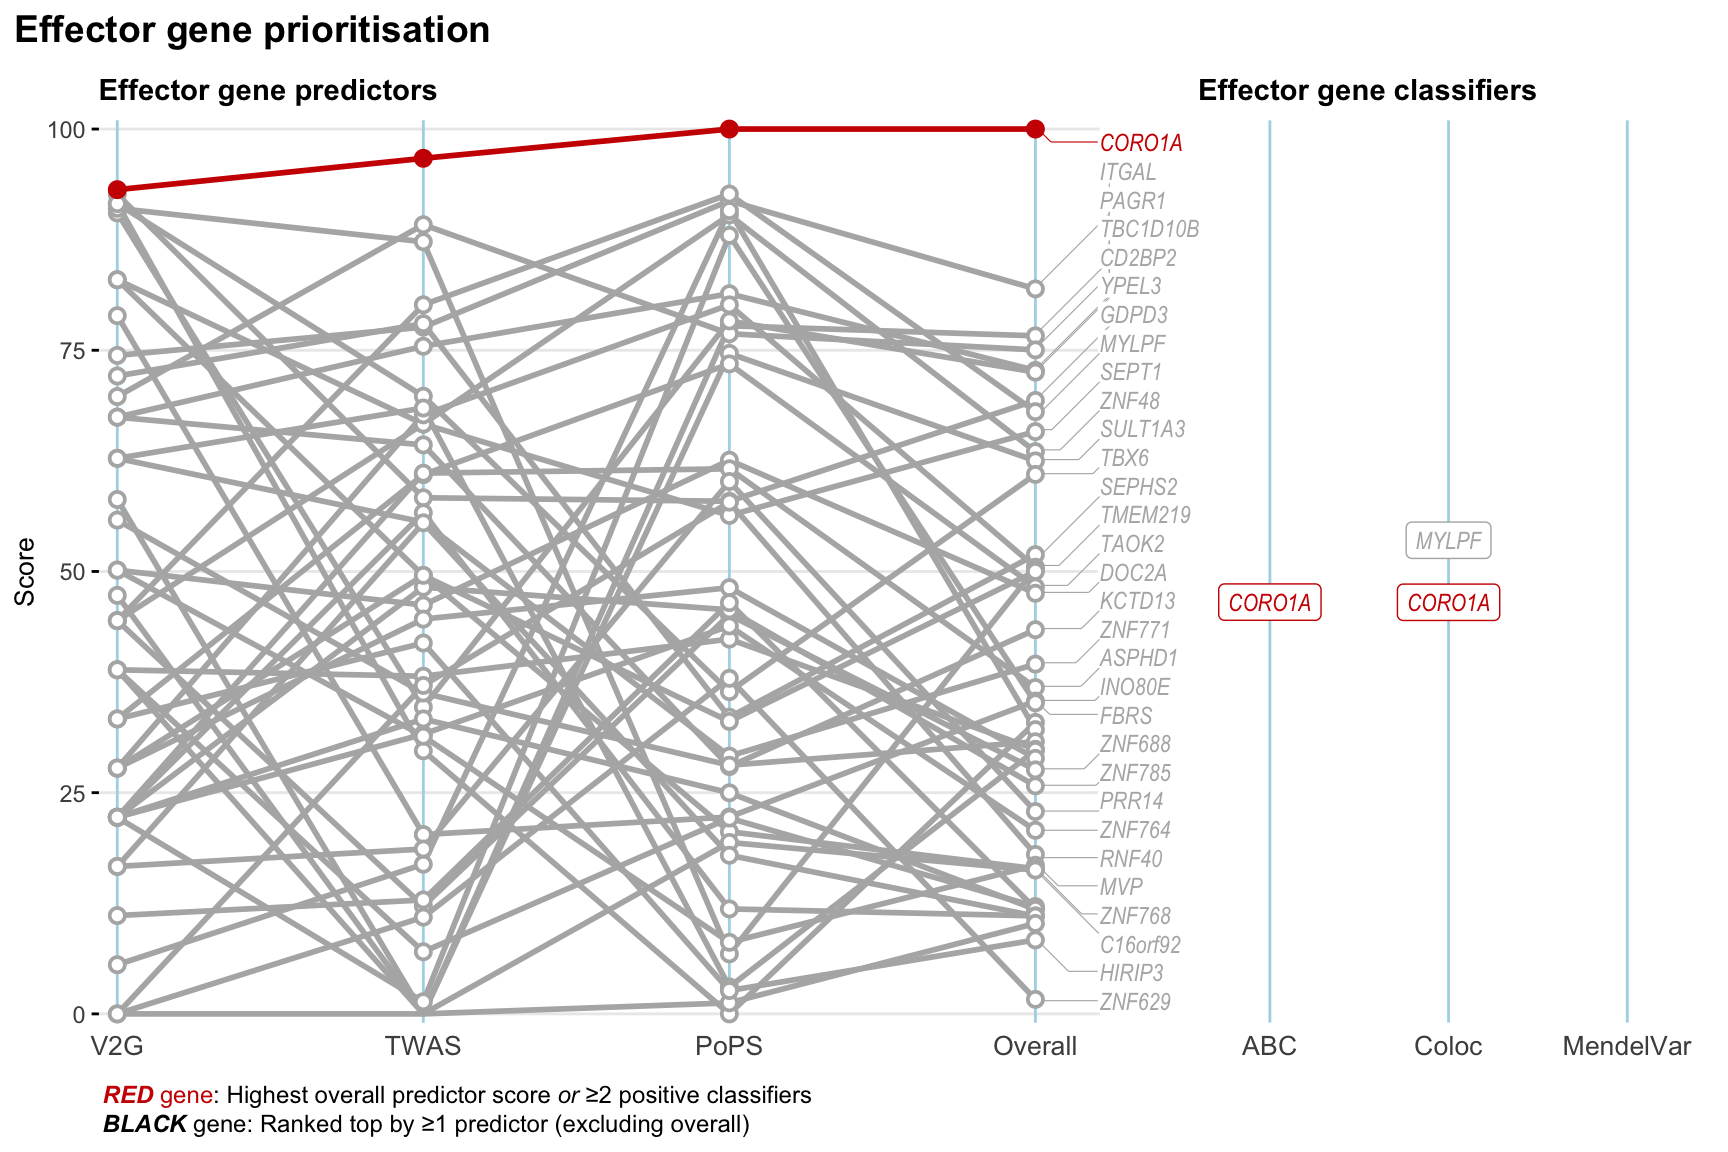
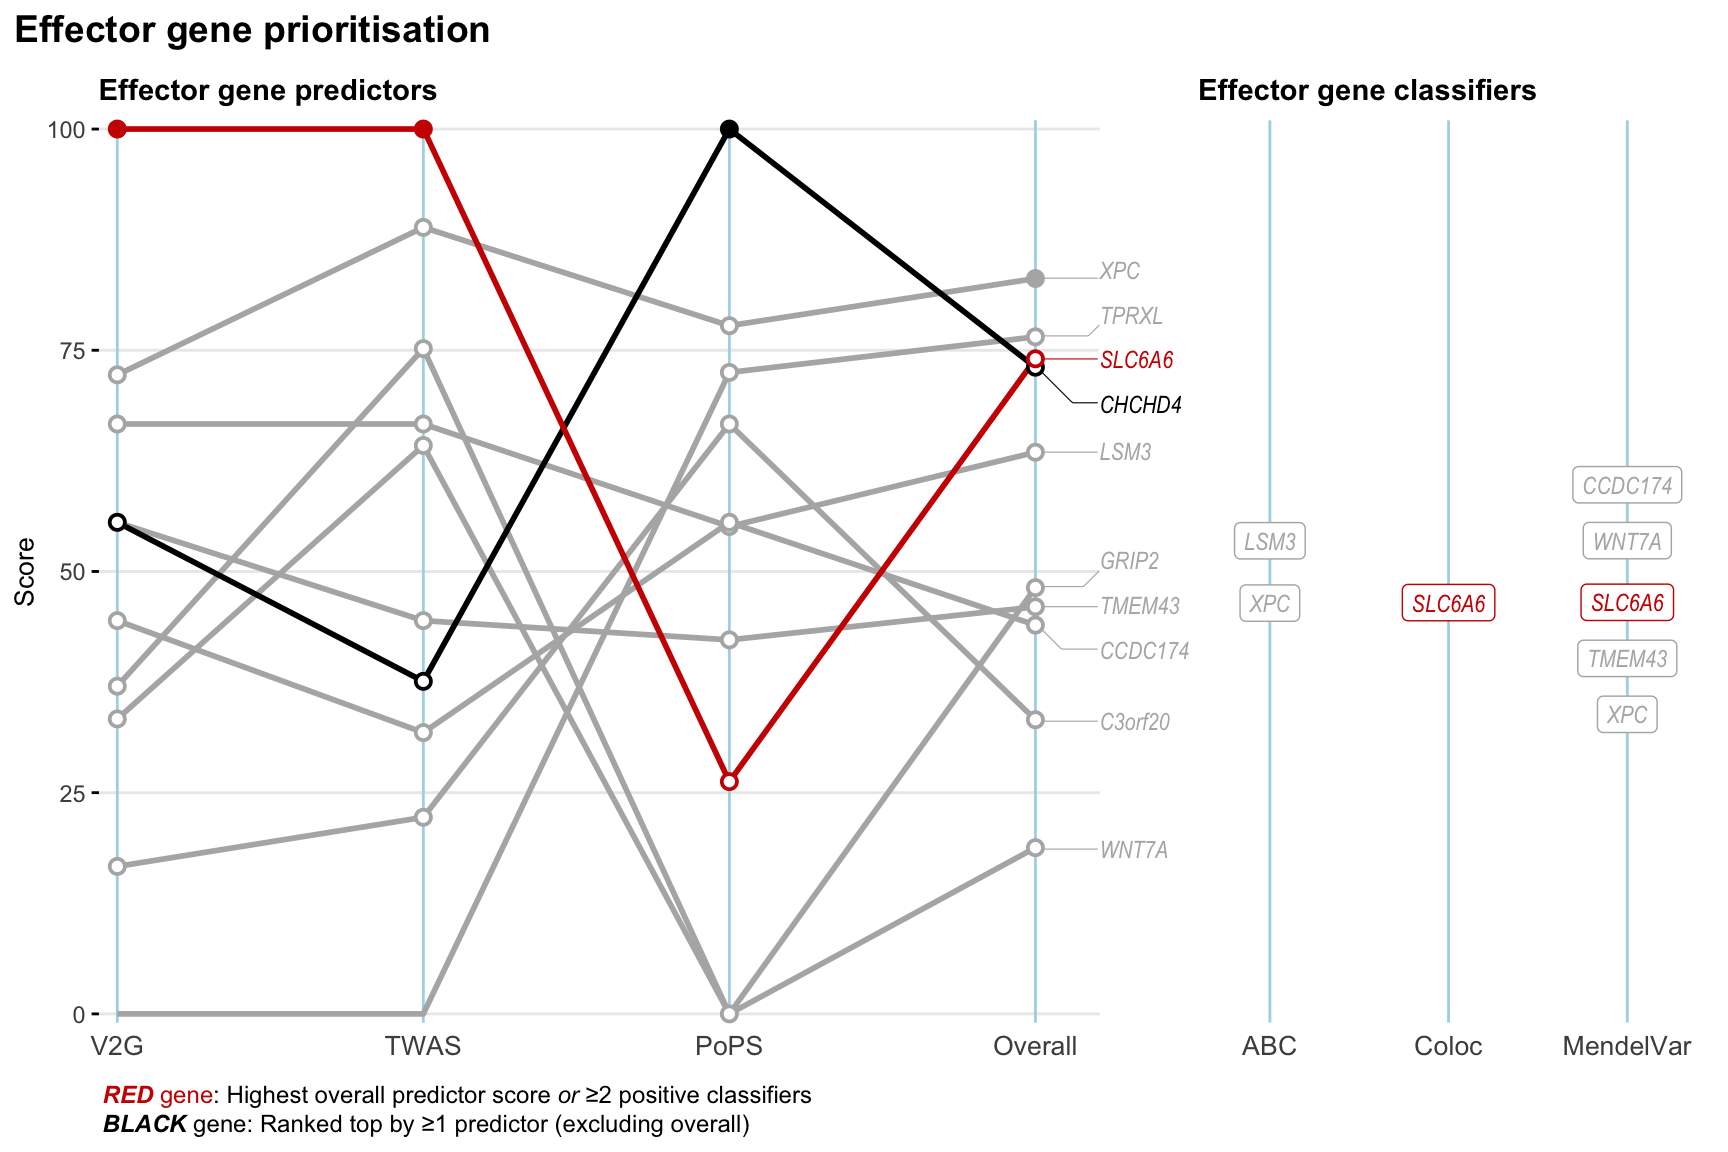
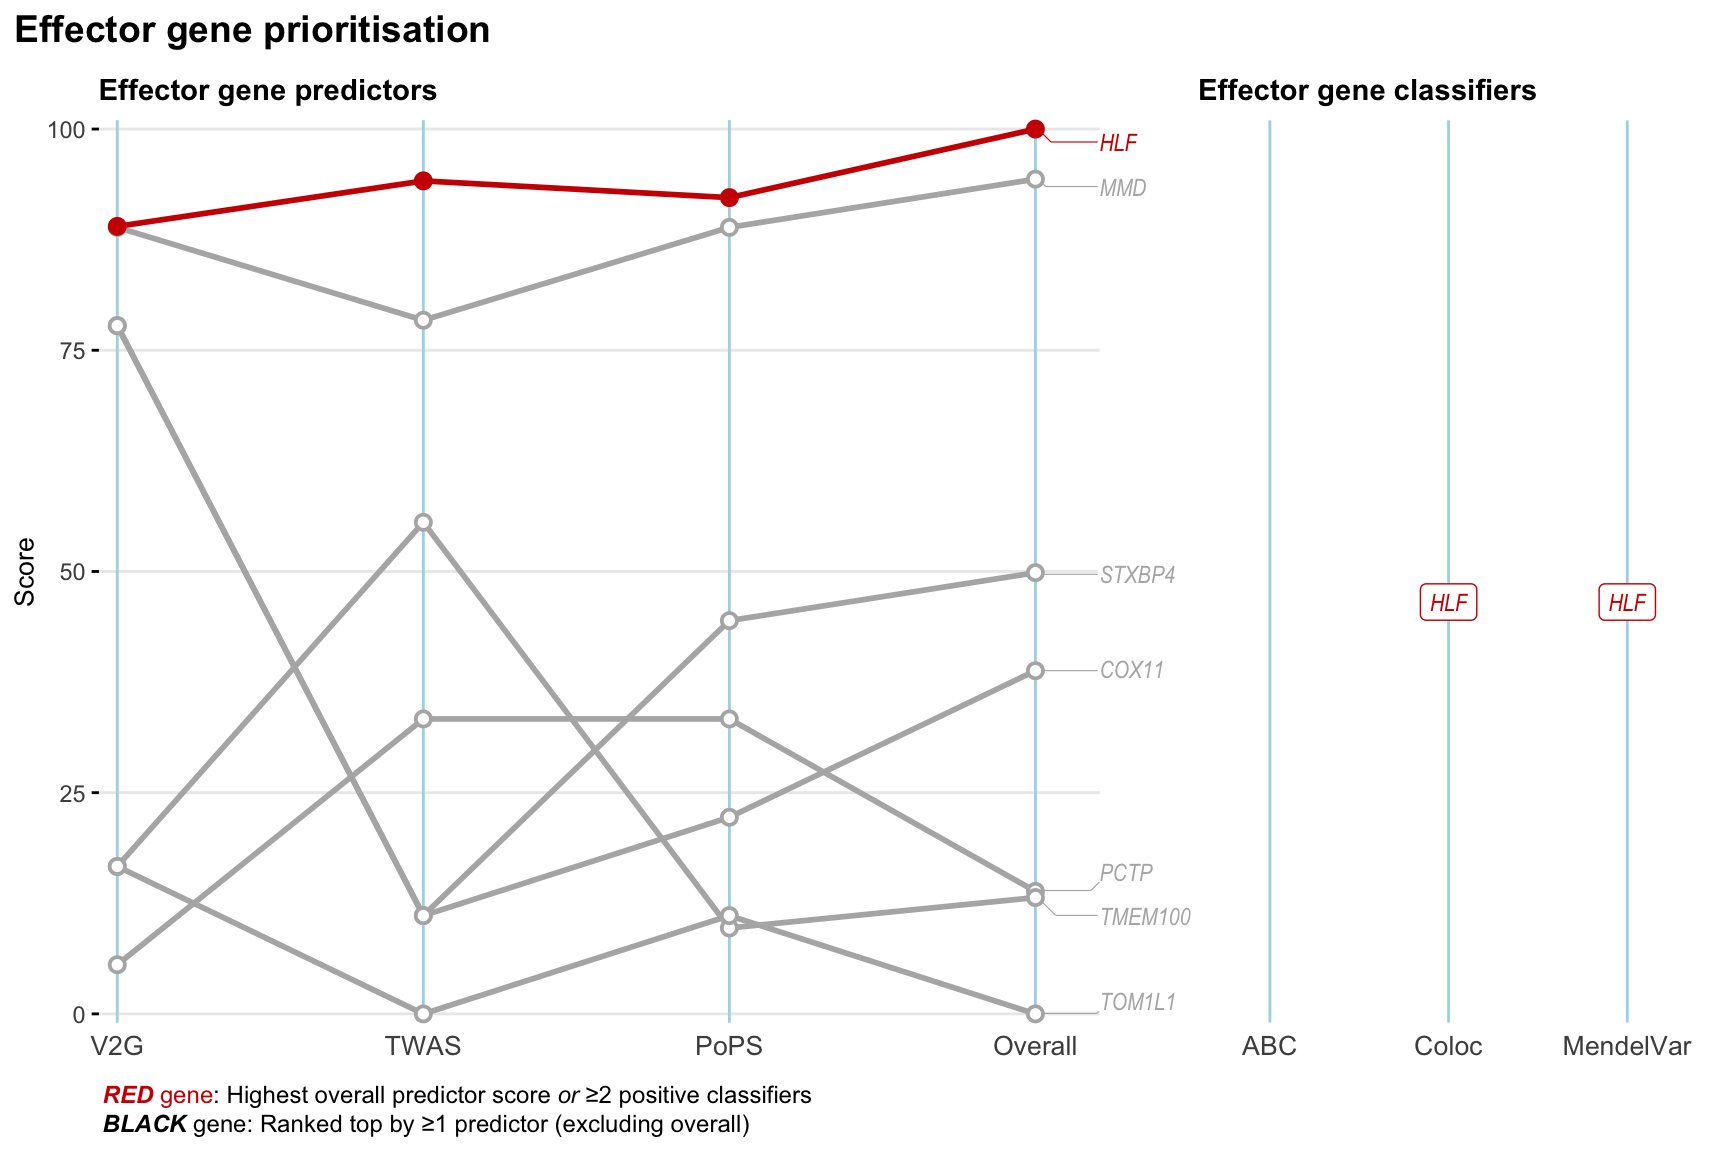
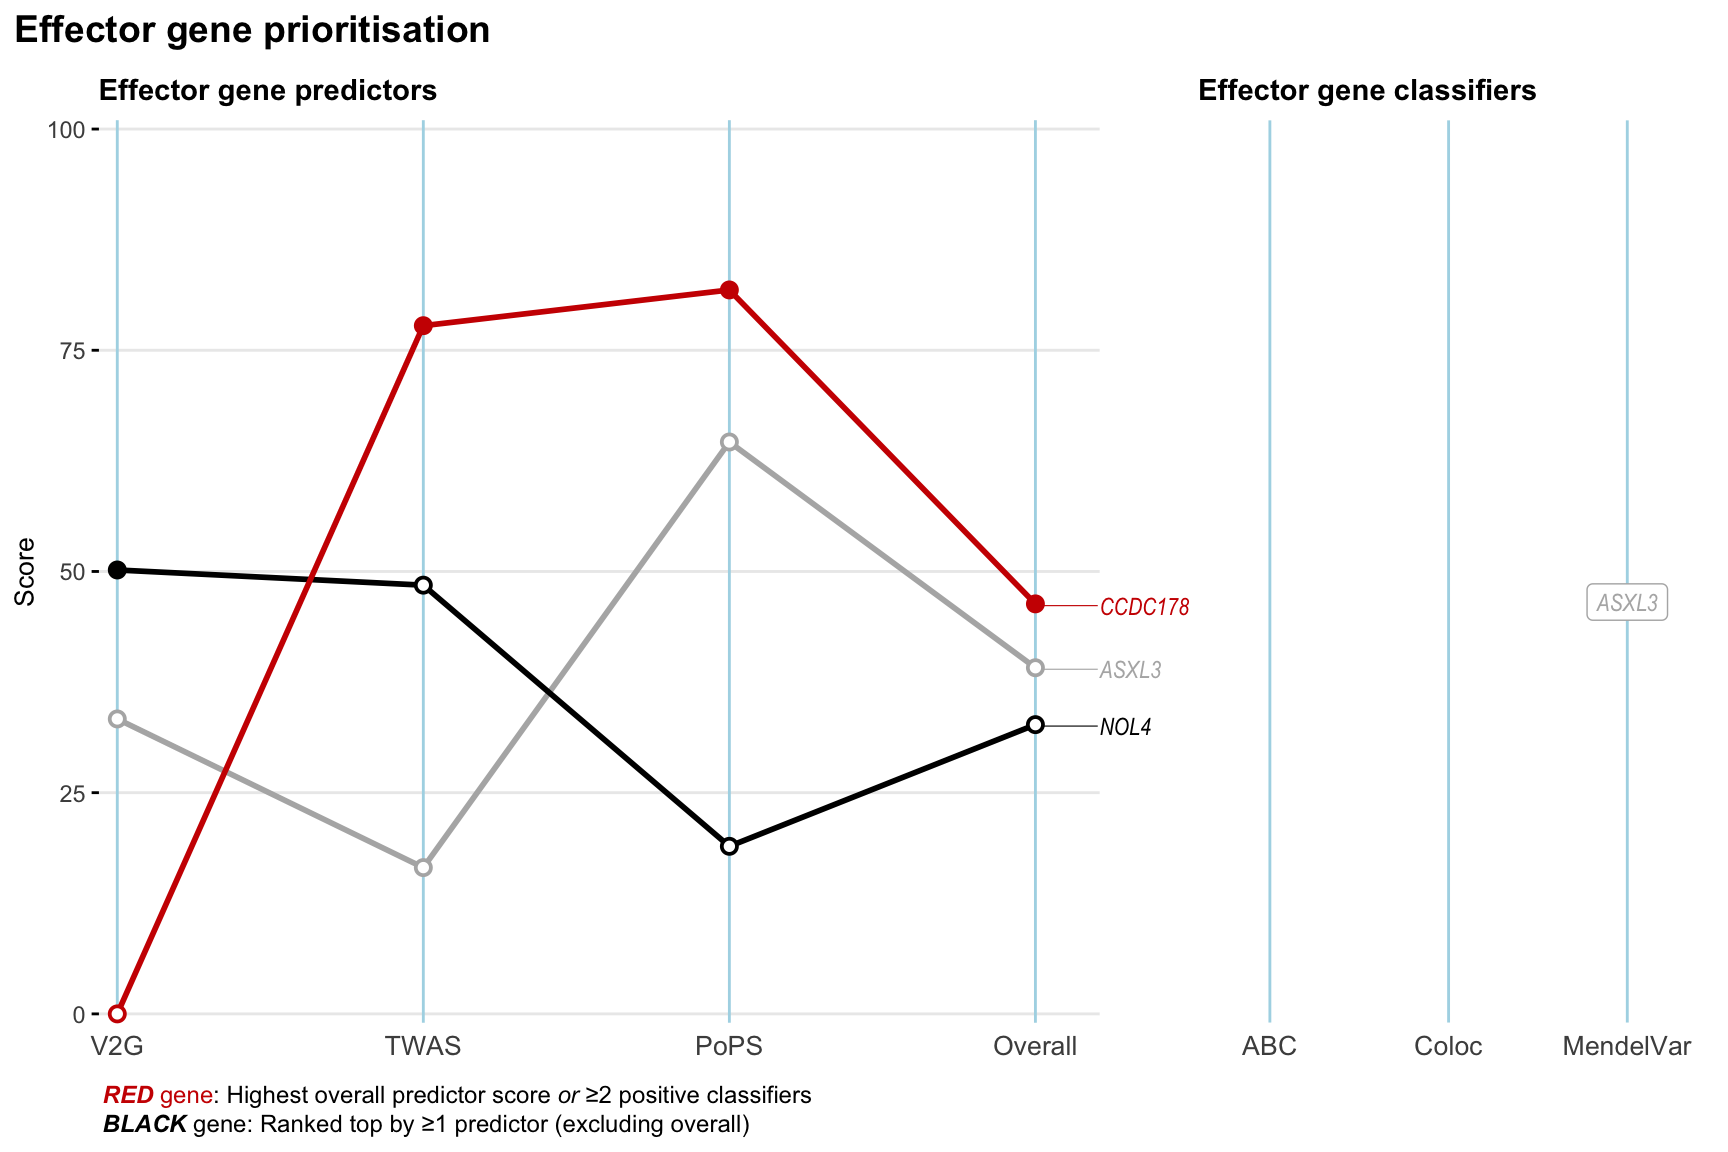
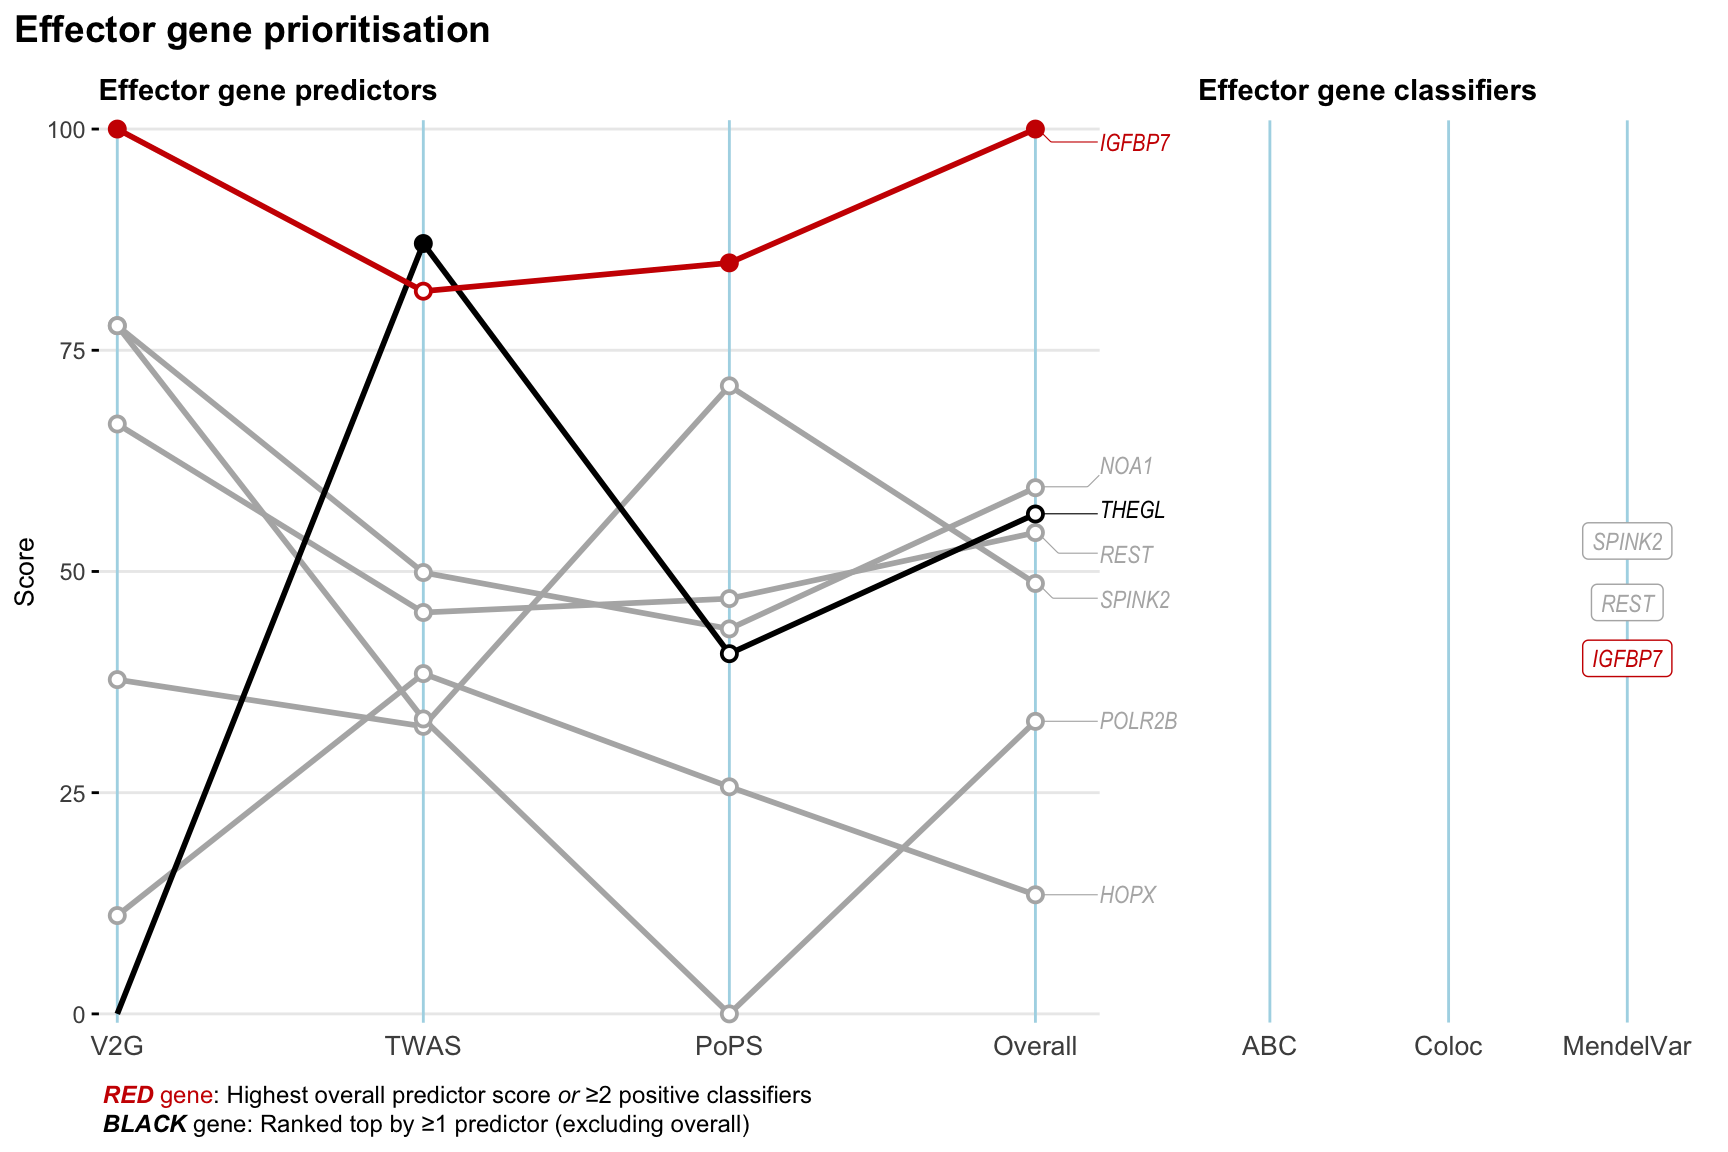
Gene prioritisation
The left-side of the panel represents gene-level scaled predictor score for the following predictors:
- V2G: the highest OpenTargets variant-to-gene score for lead variants and their proxy (LD \(R^2\) > 0.8) and/or variants in the 95% credible sets
- TWAS: \(P\)-value for association between predicted gene expression level and risk of HF estimated from multi-tissue transcriptome association analysis implemented in MulTiXcan
- PoPS: Polygenic Priority Score
- Overall: weighted mean of PoPS, V2G, TWAS with weight ratio 2:2:1
and an indicator whether a gene have positive (True) value for the following classifers:
- ABC: Activity-by-contact measure for enhancer-gene activity of overlapping lead variants and their proxies or finemapped variants within the locus
- Coloc: Posterior probability of shared causal variants > 0.8 (colocalisation) between HF phenotype and gene expression in tissues with lowest TWAS \(P\)-value
- MendelVar: Gene is associated with at least one Mendelian disorders at \(P_{enrichment-adjusted}\) < 0.01 based on MendelVar analysis
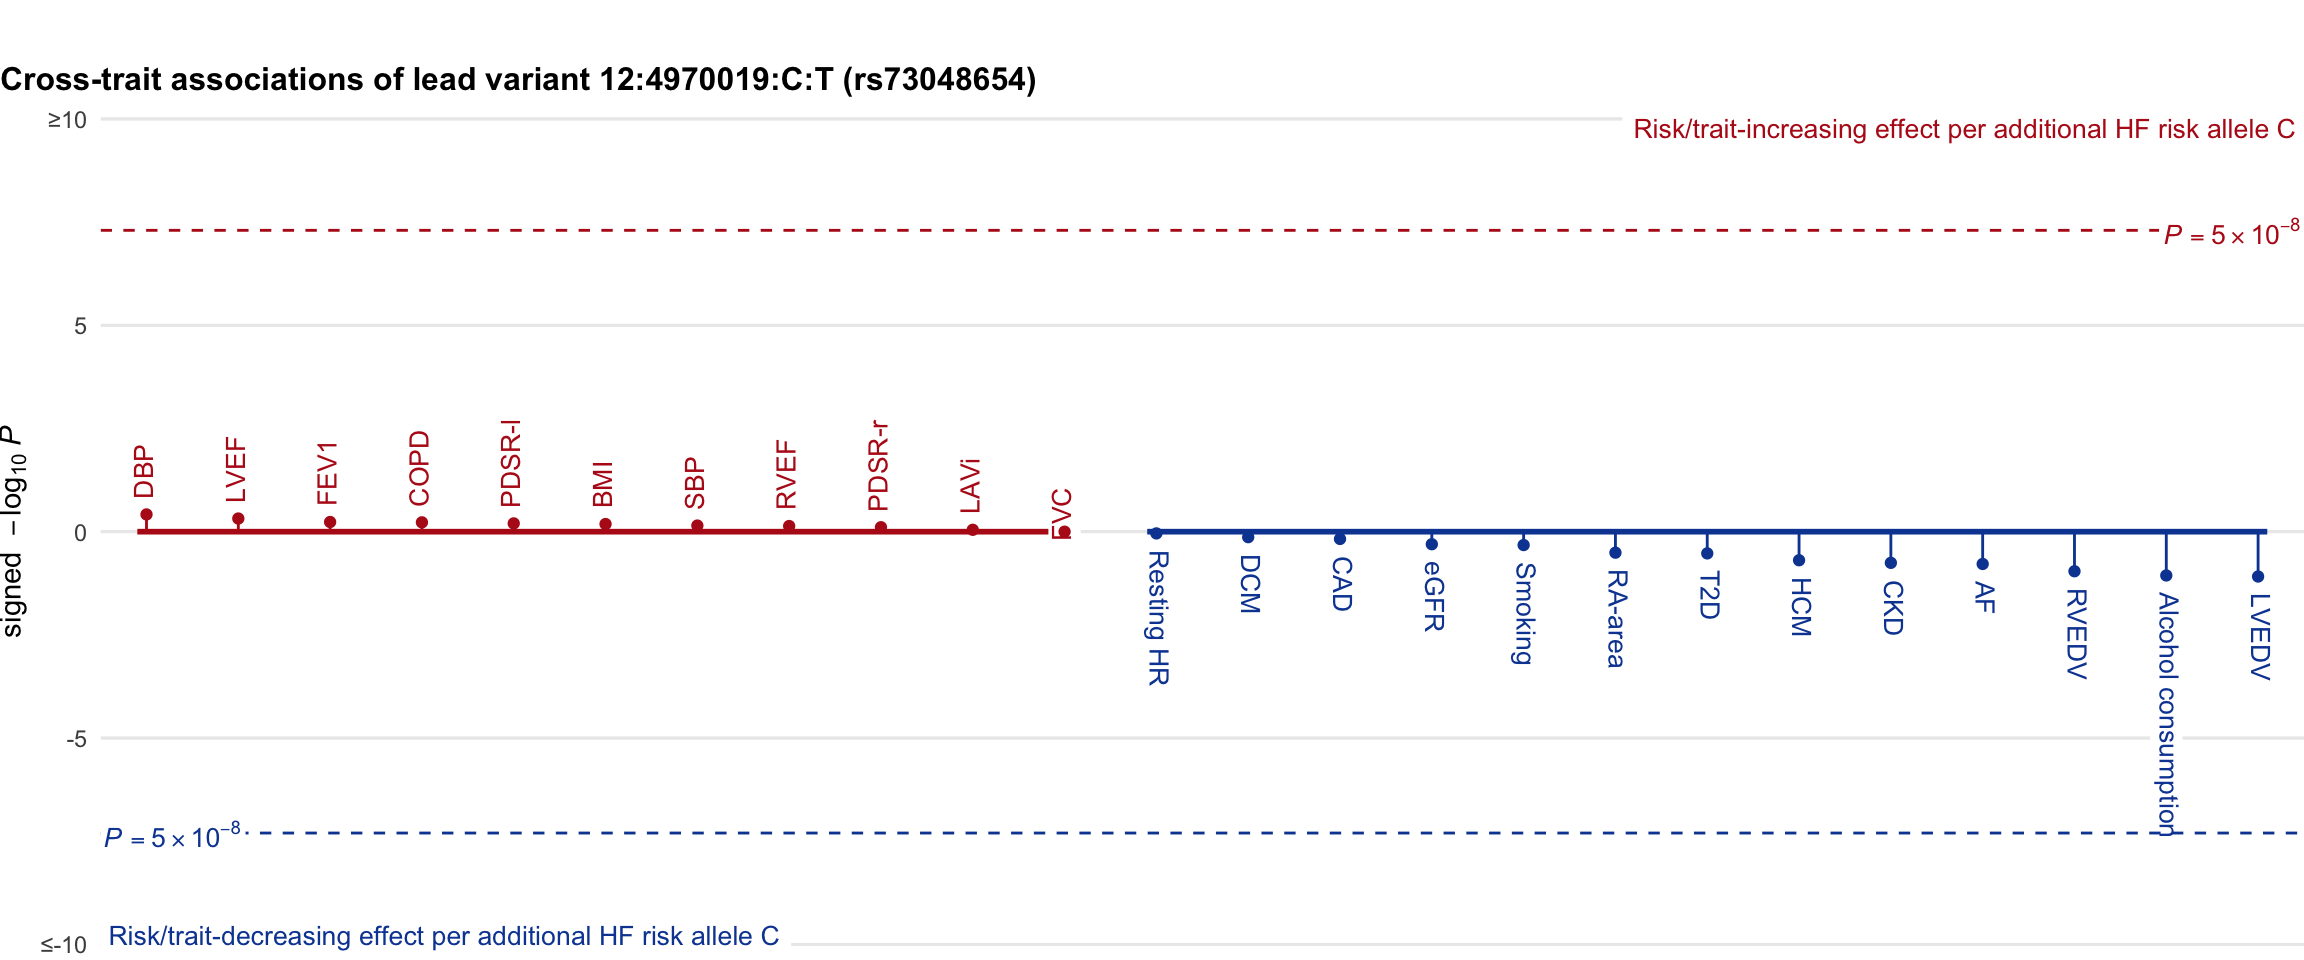
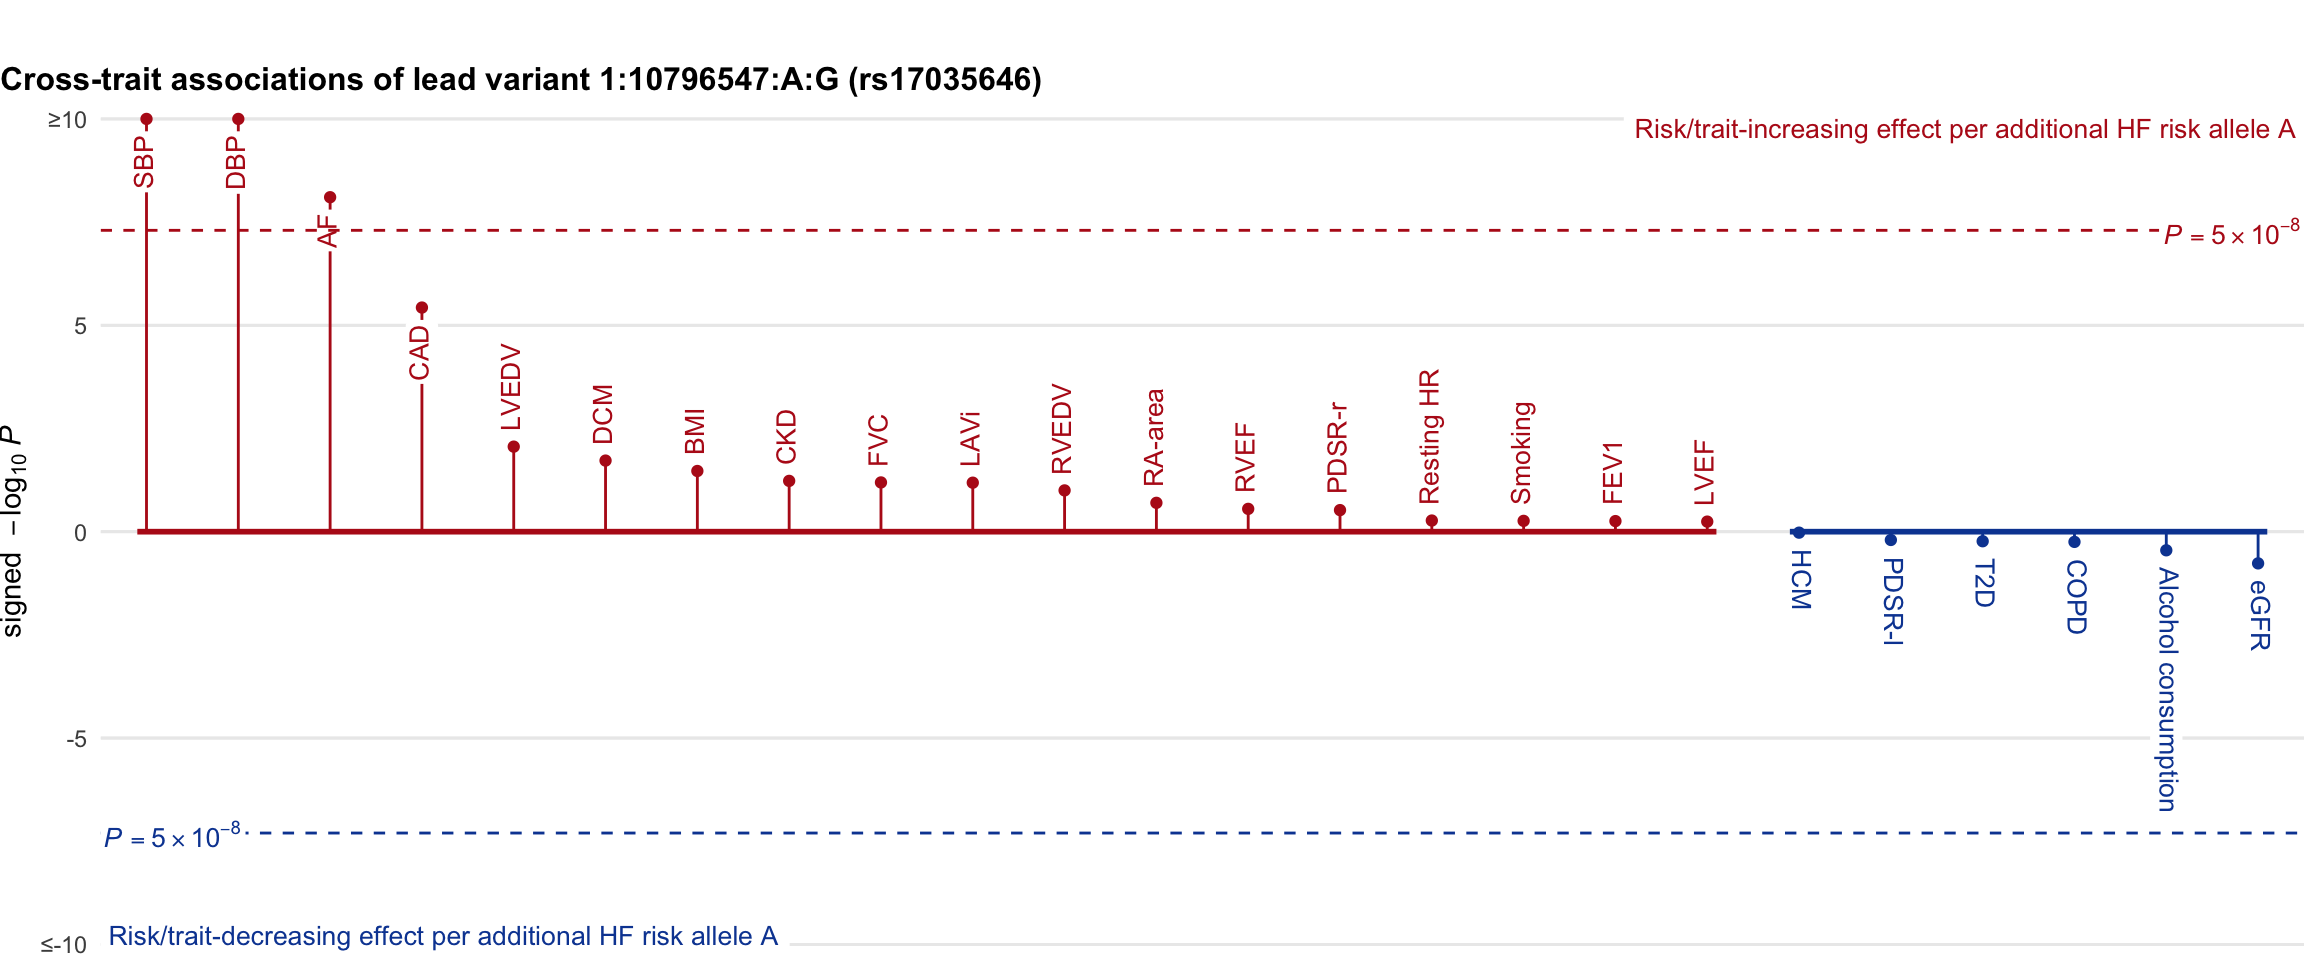
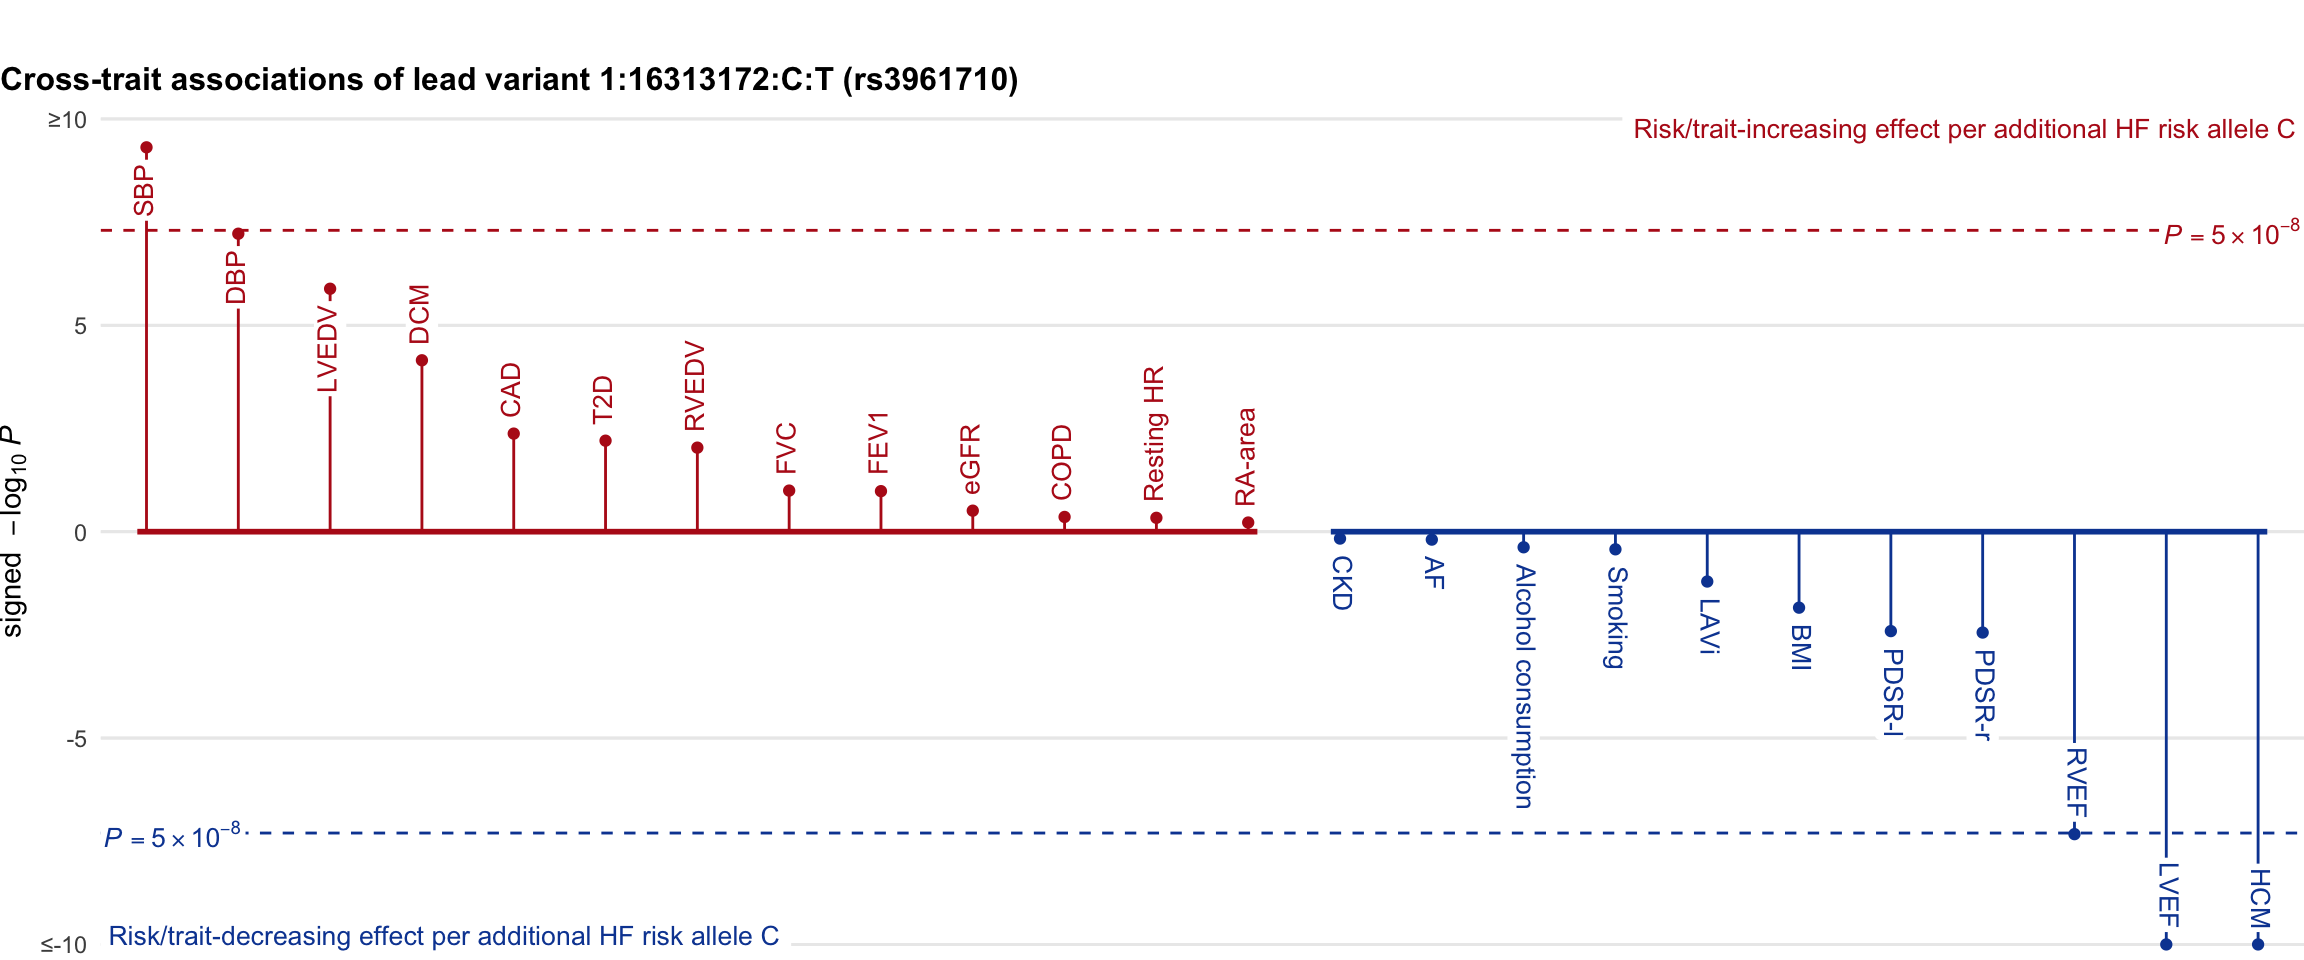
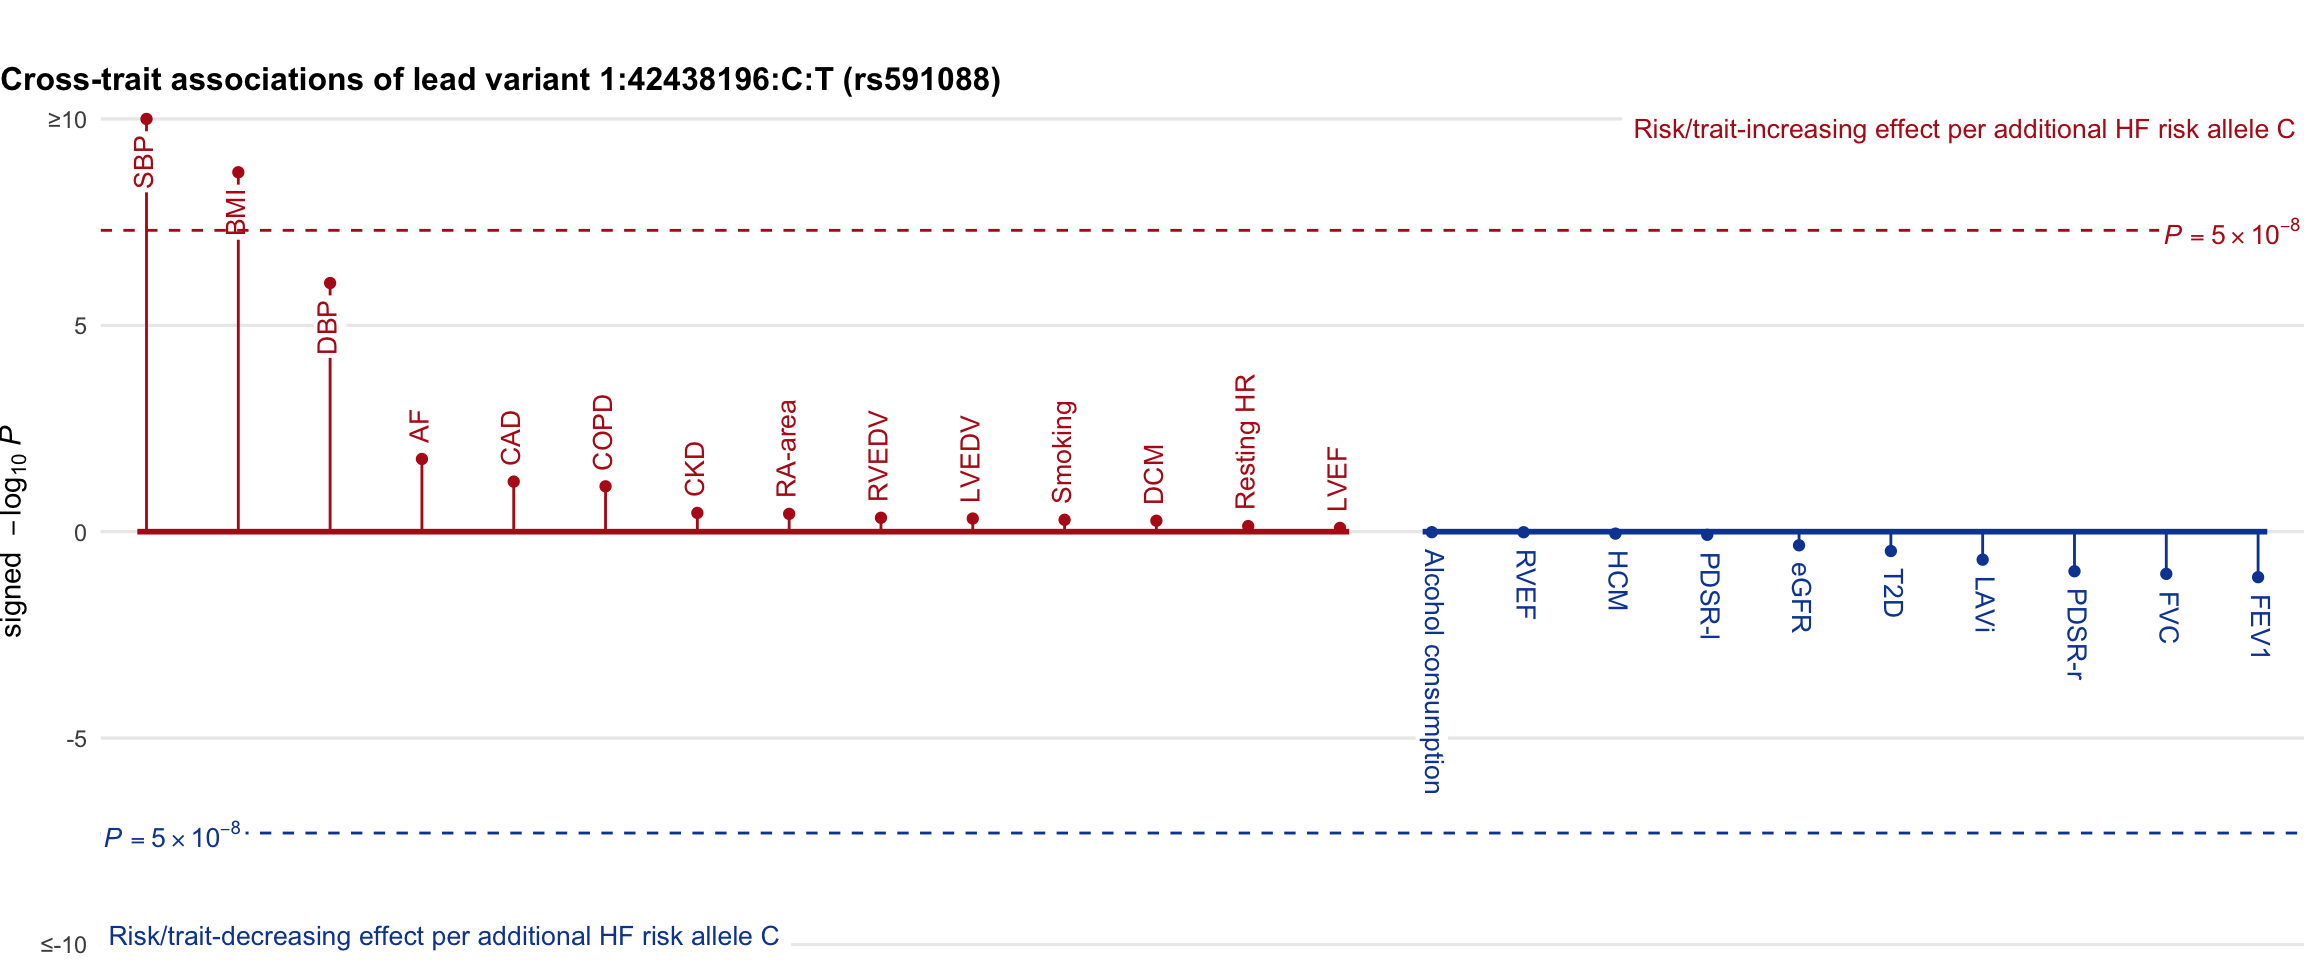
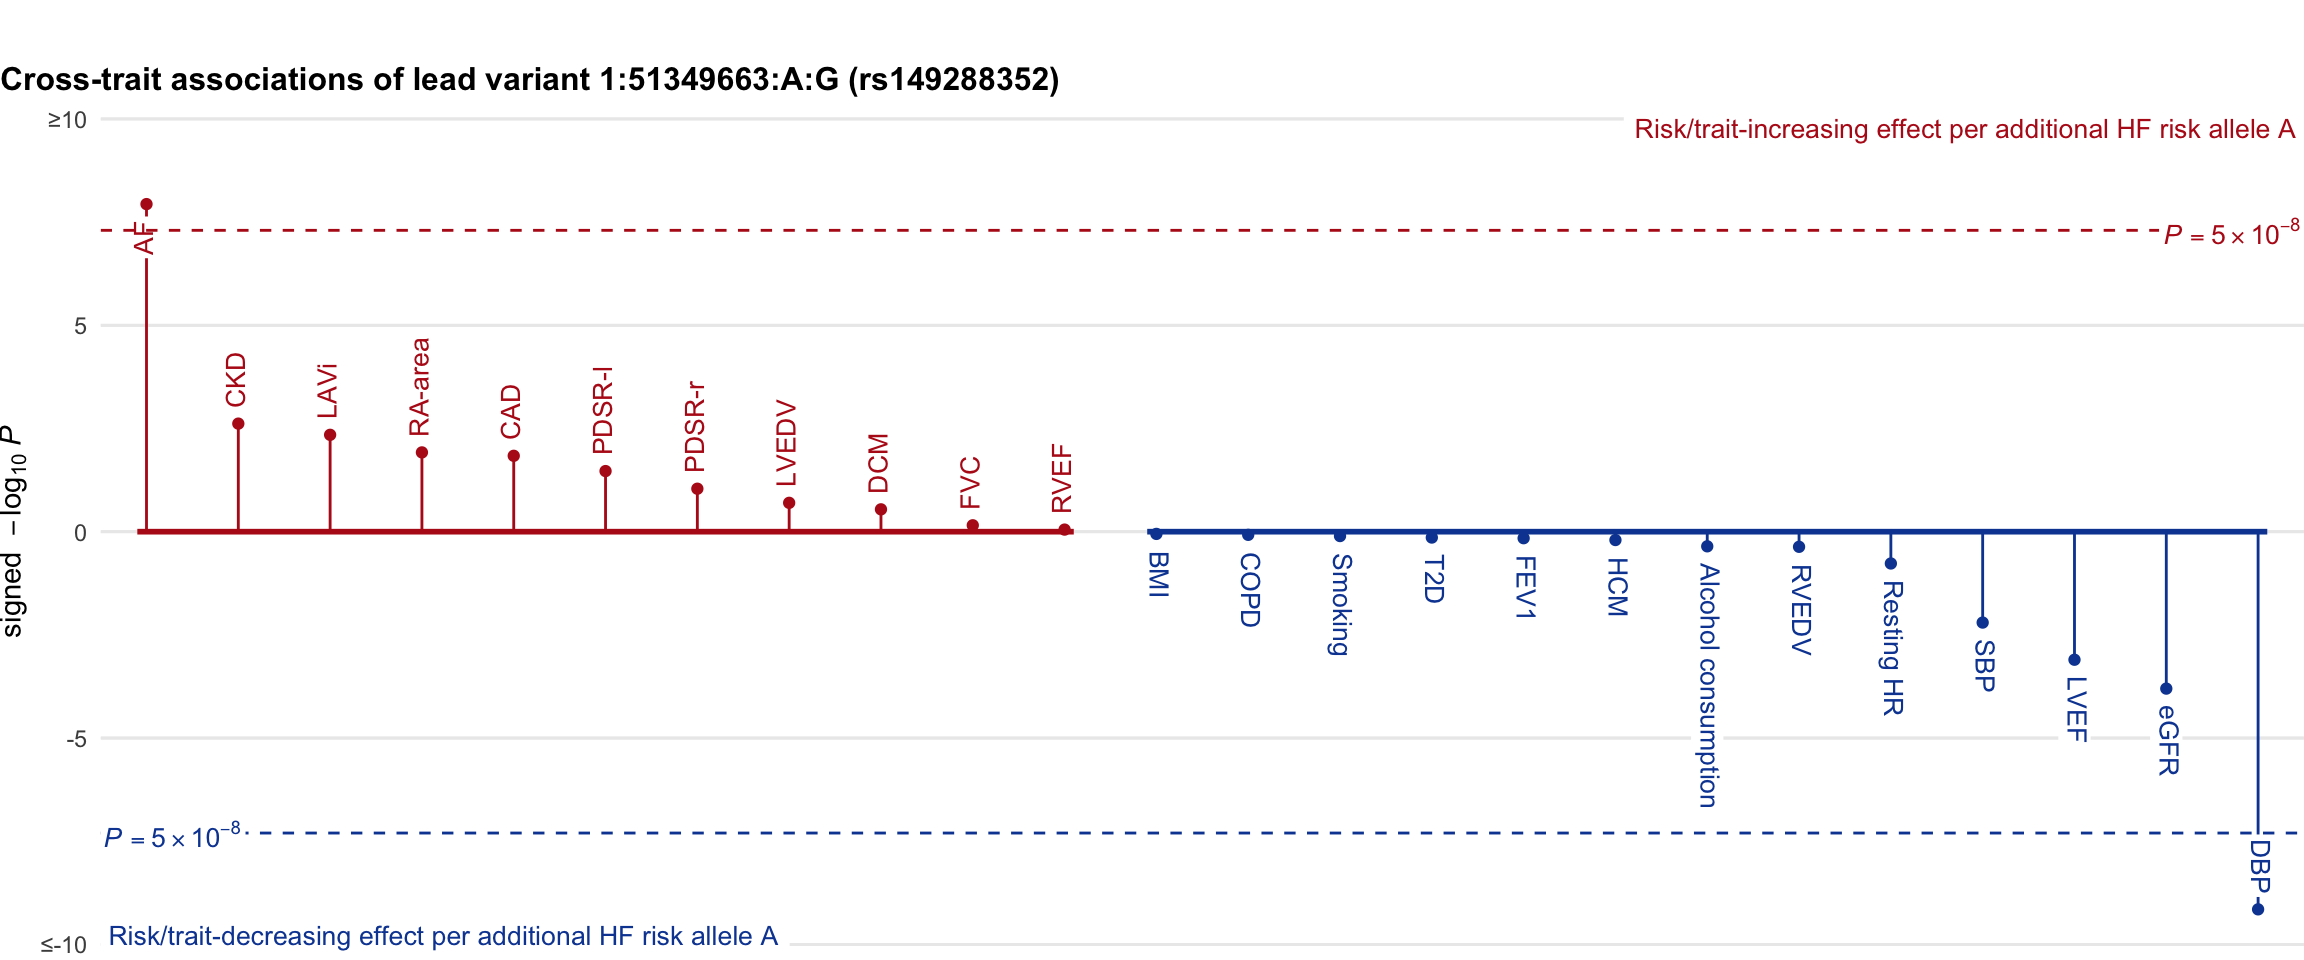
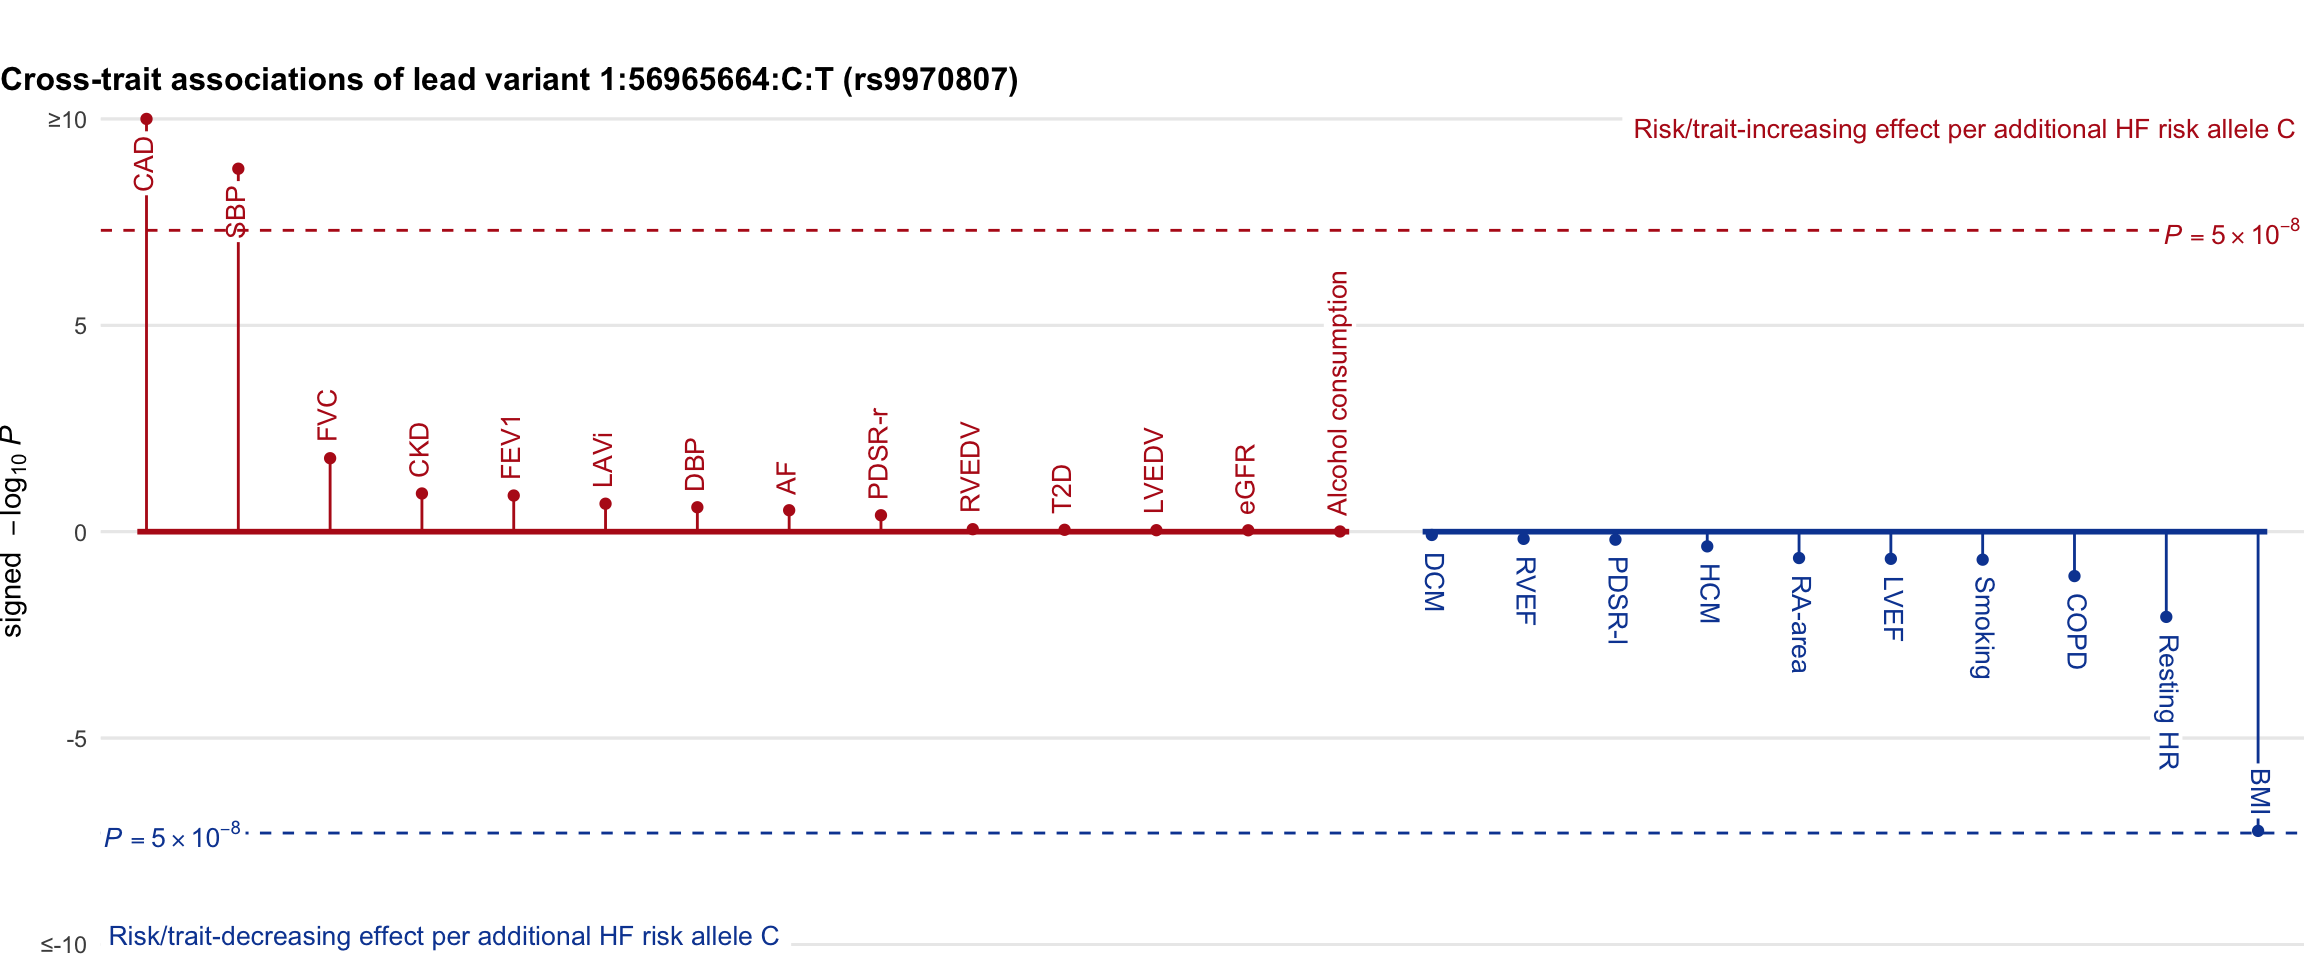
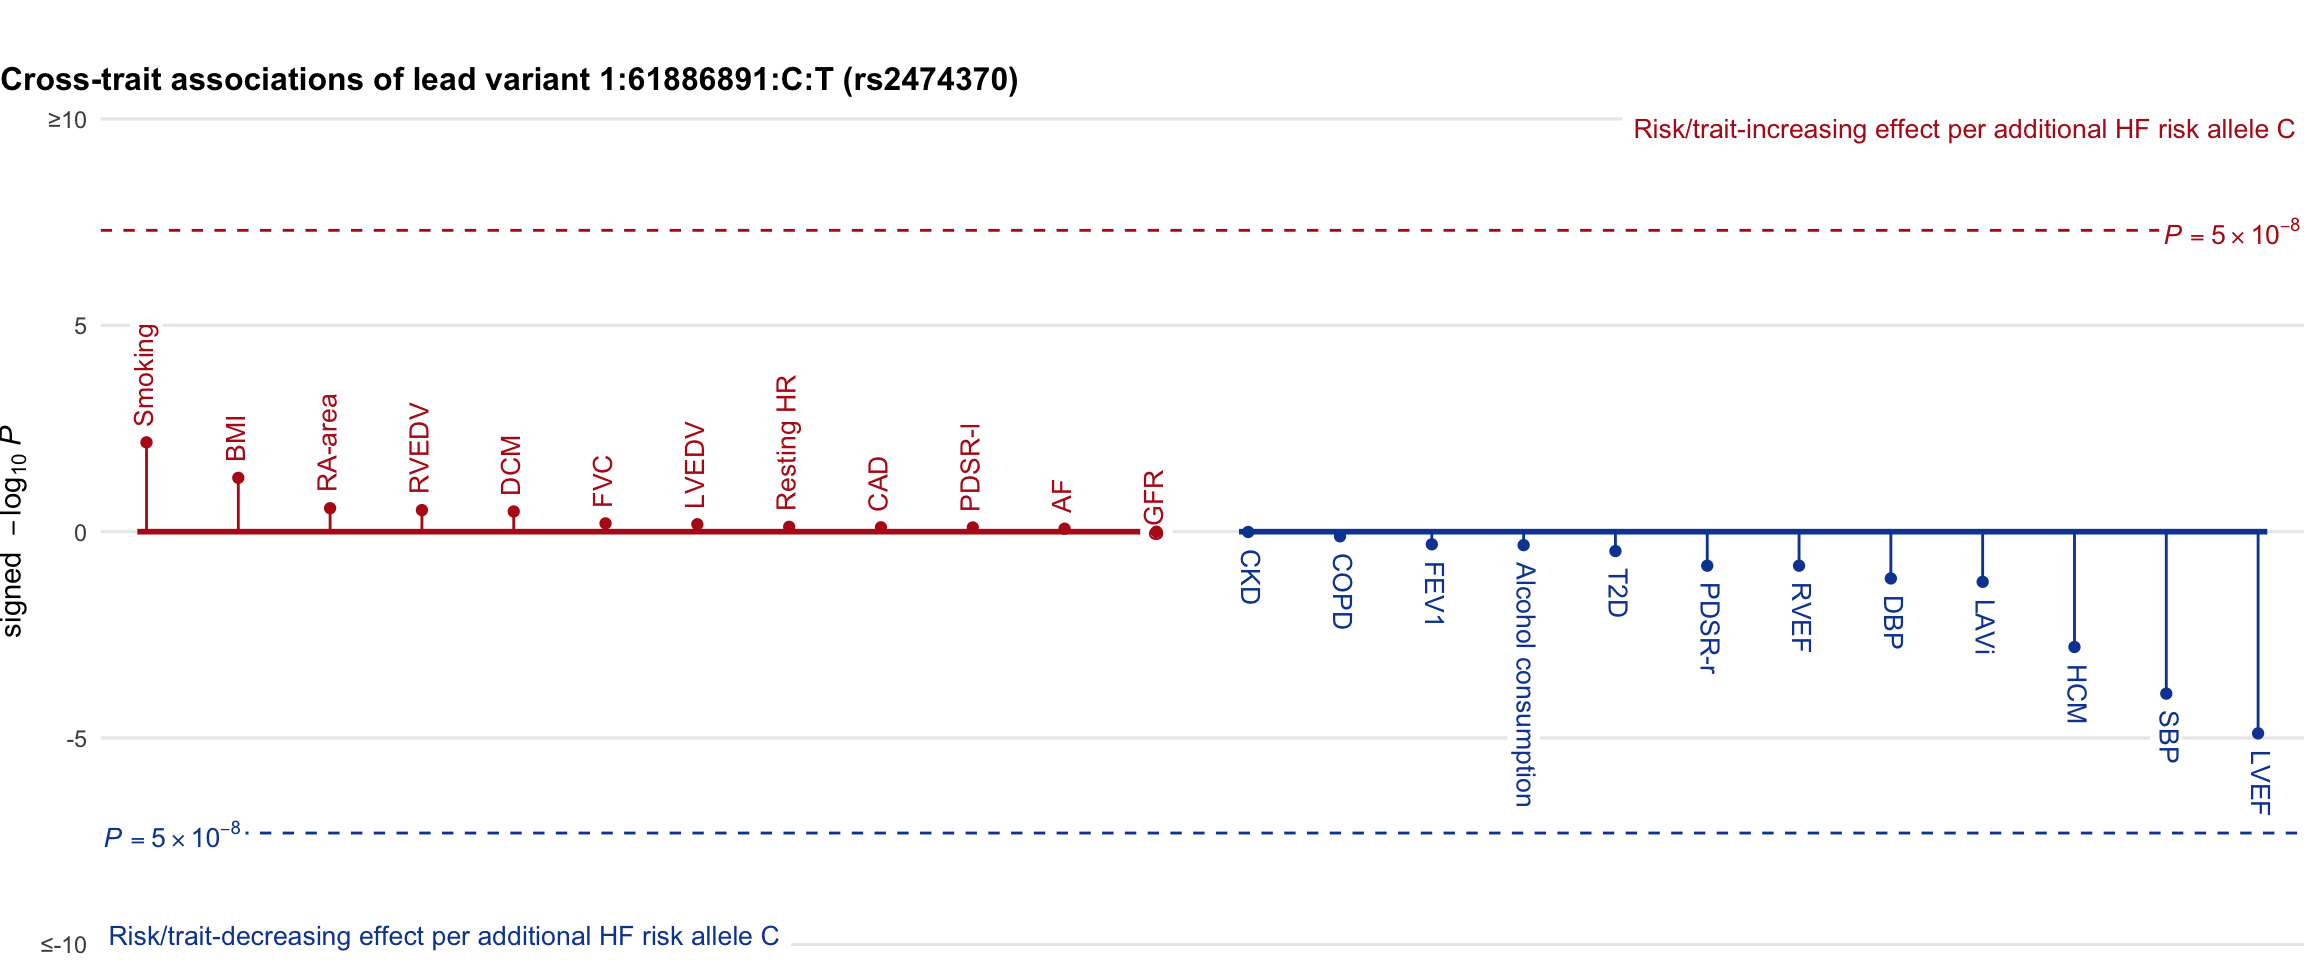
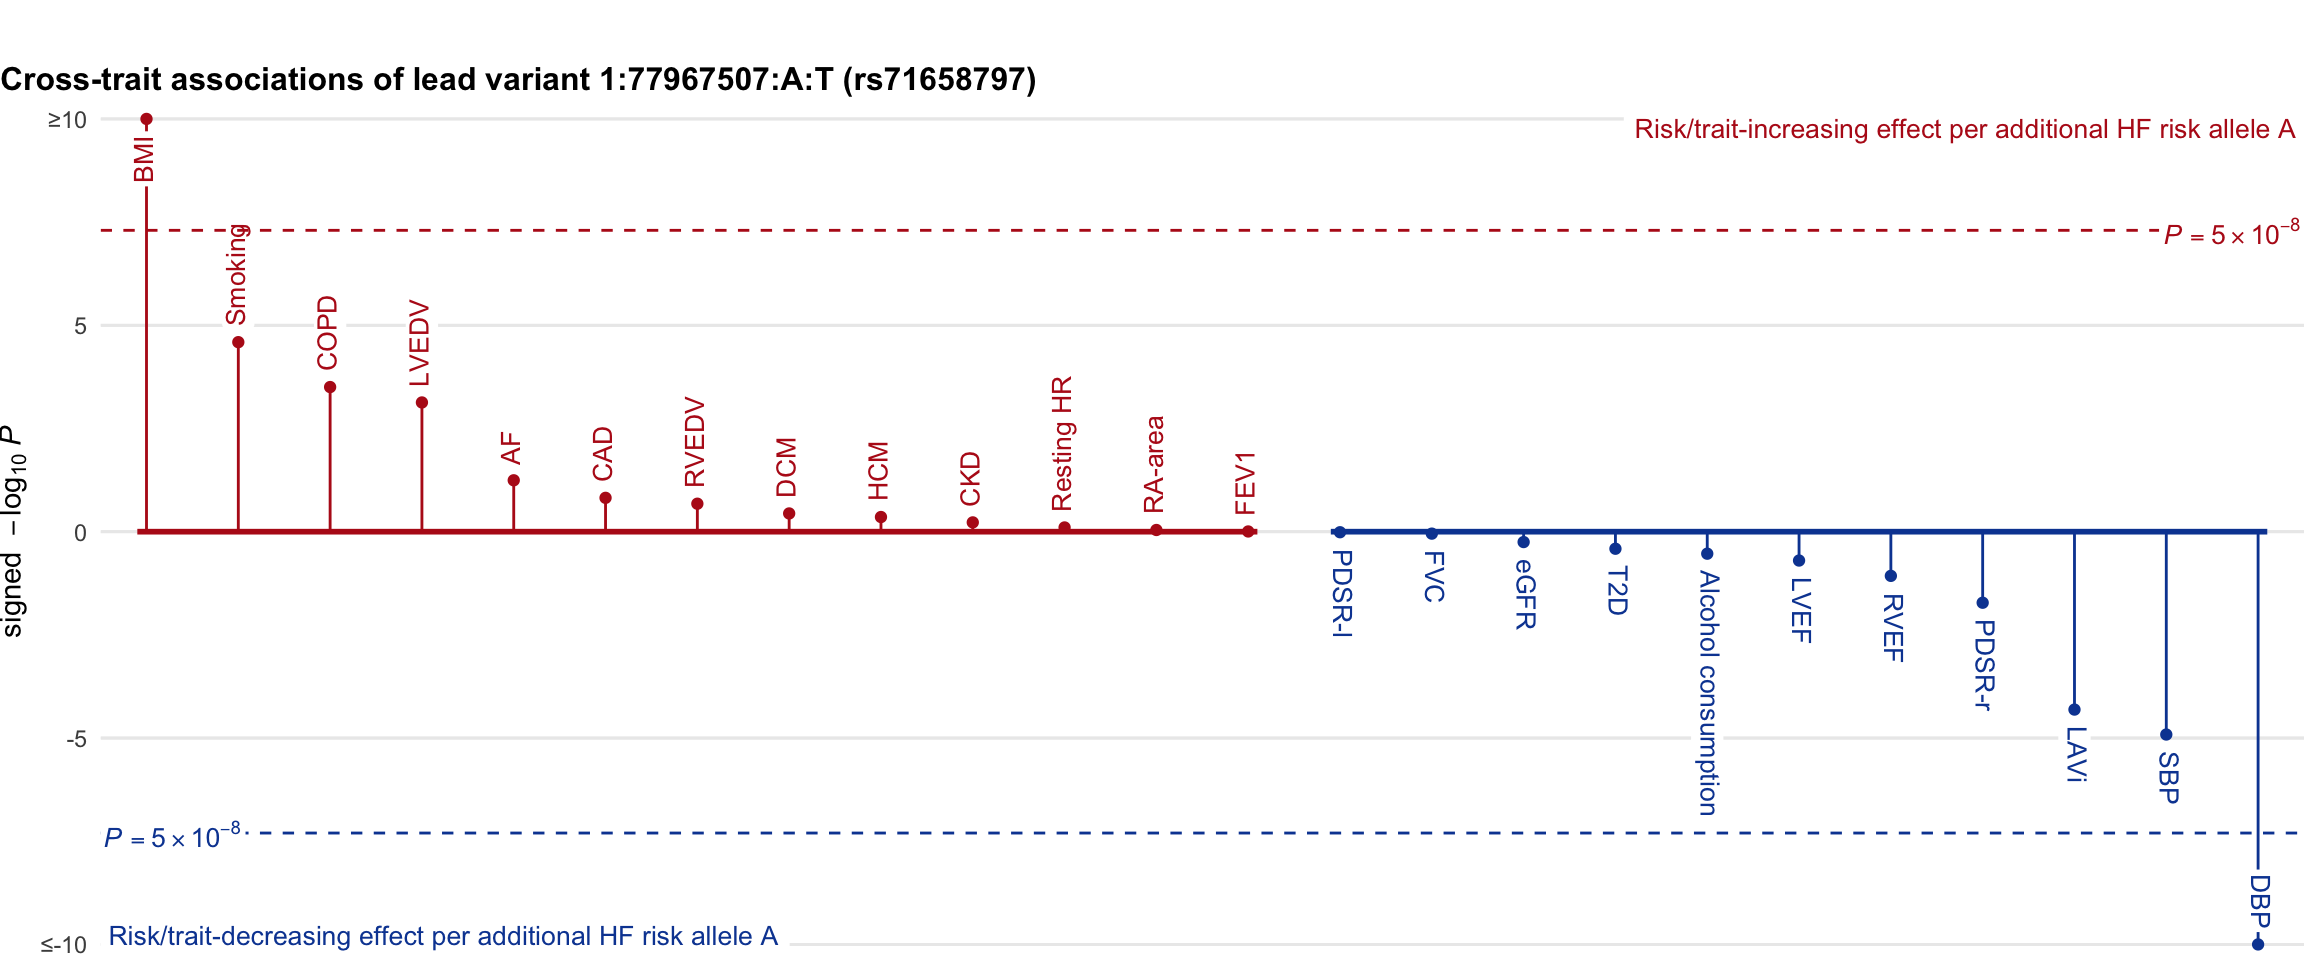
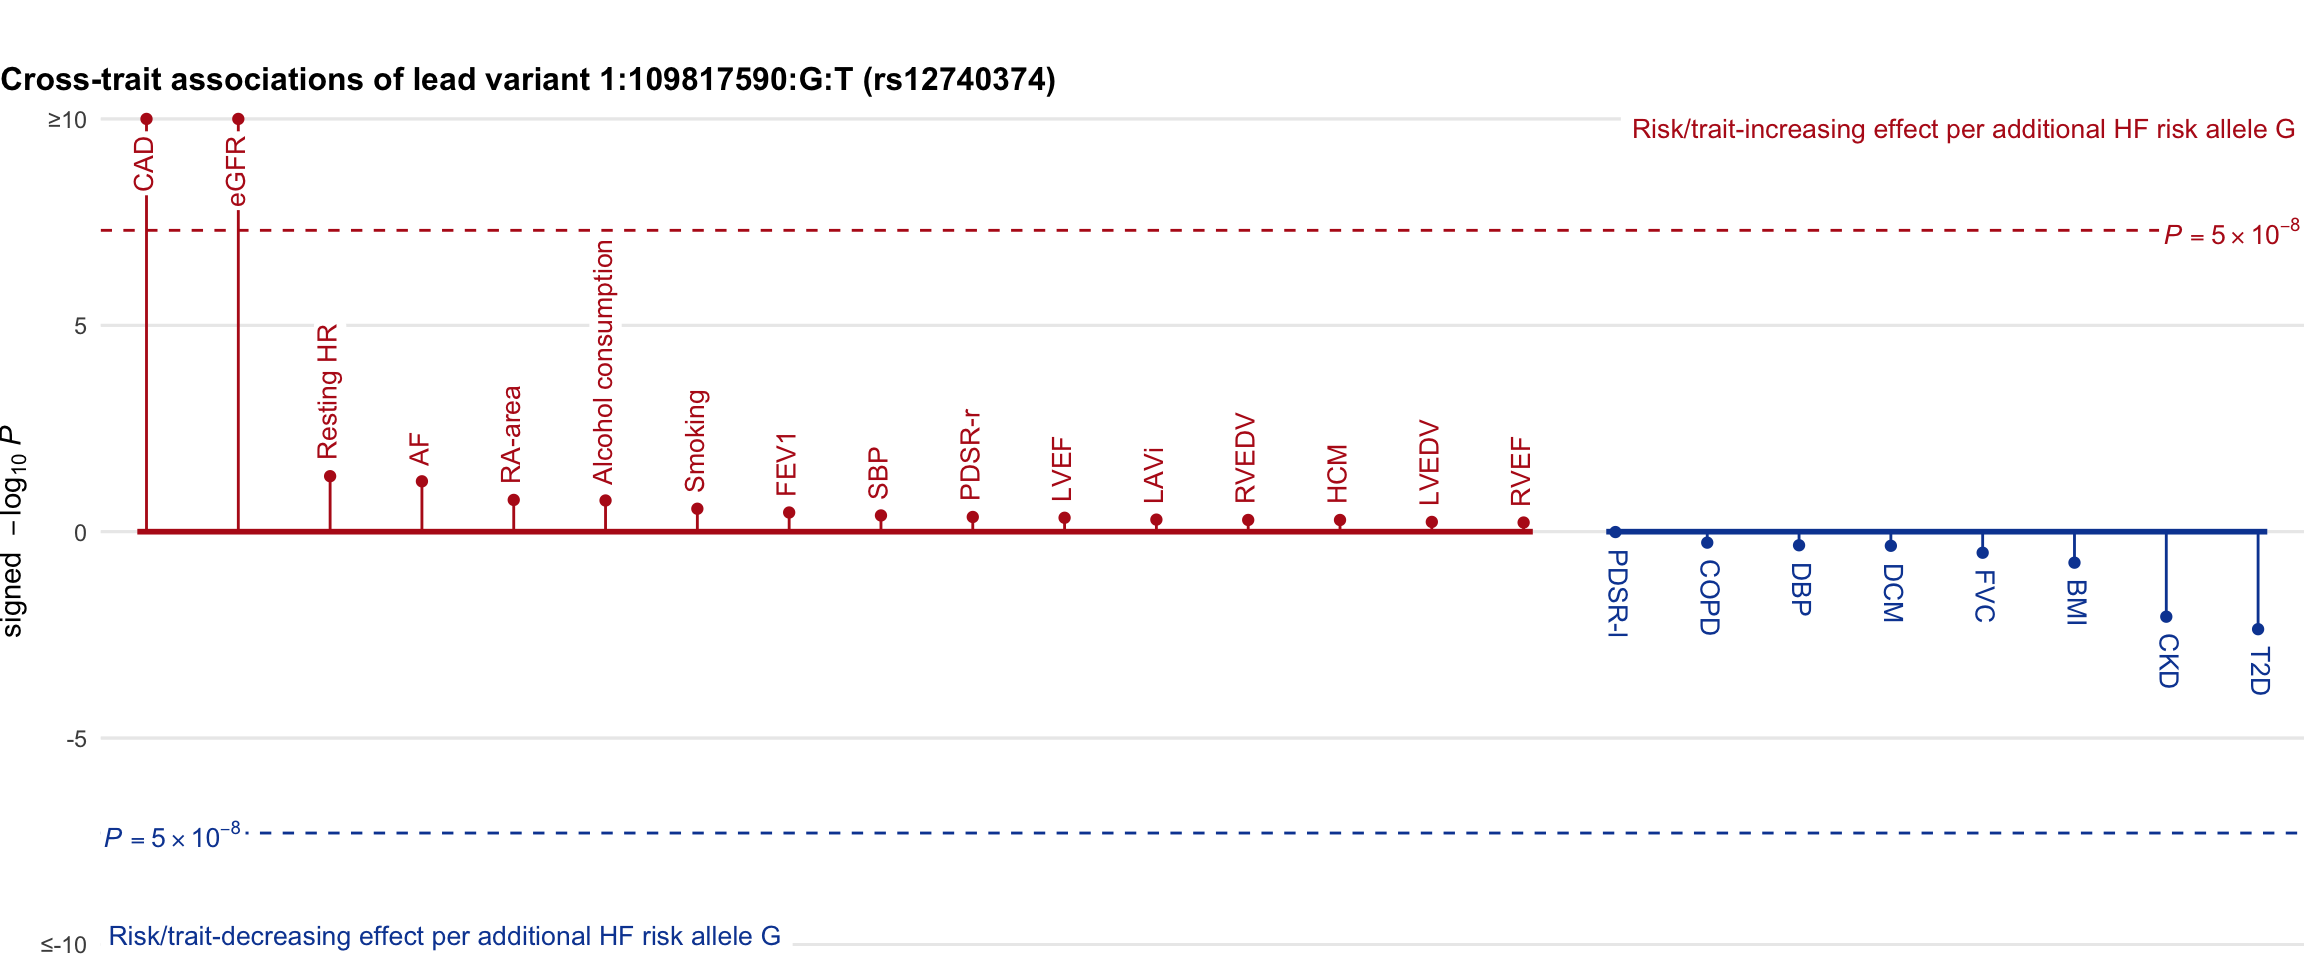
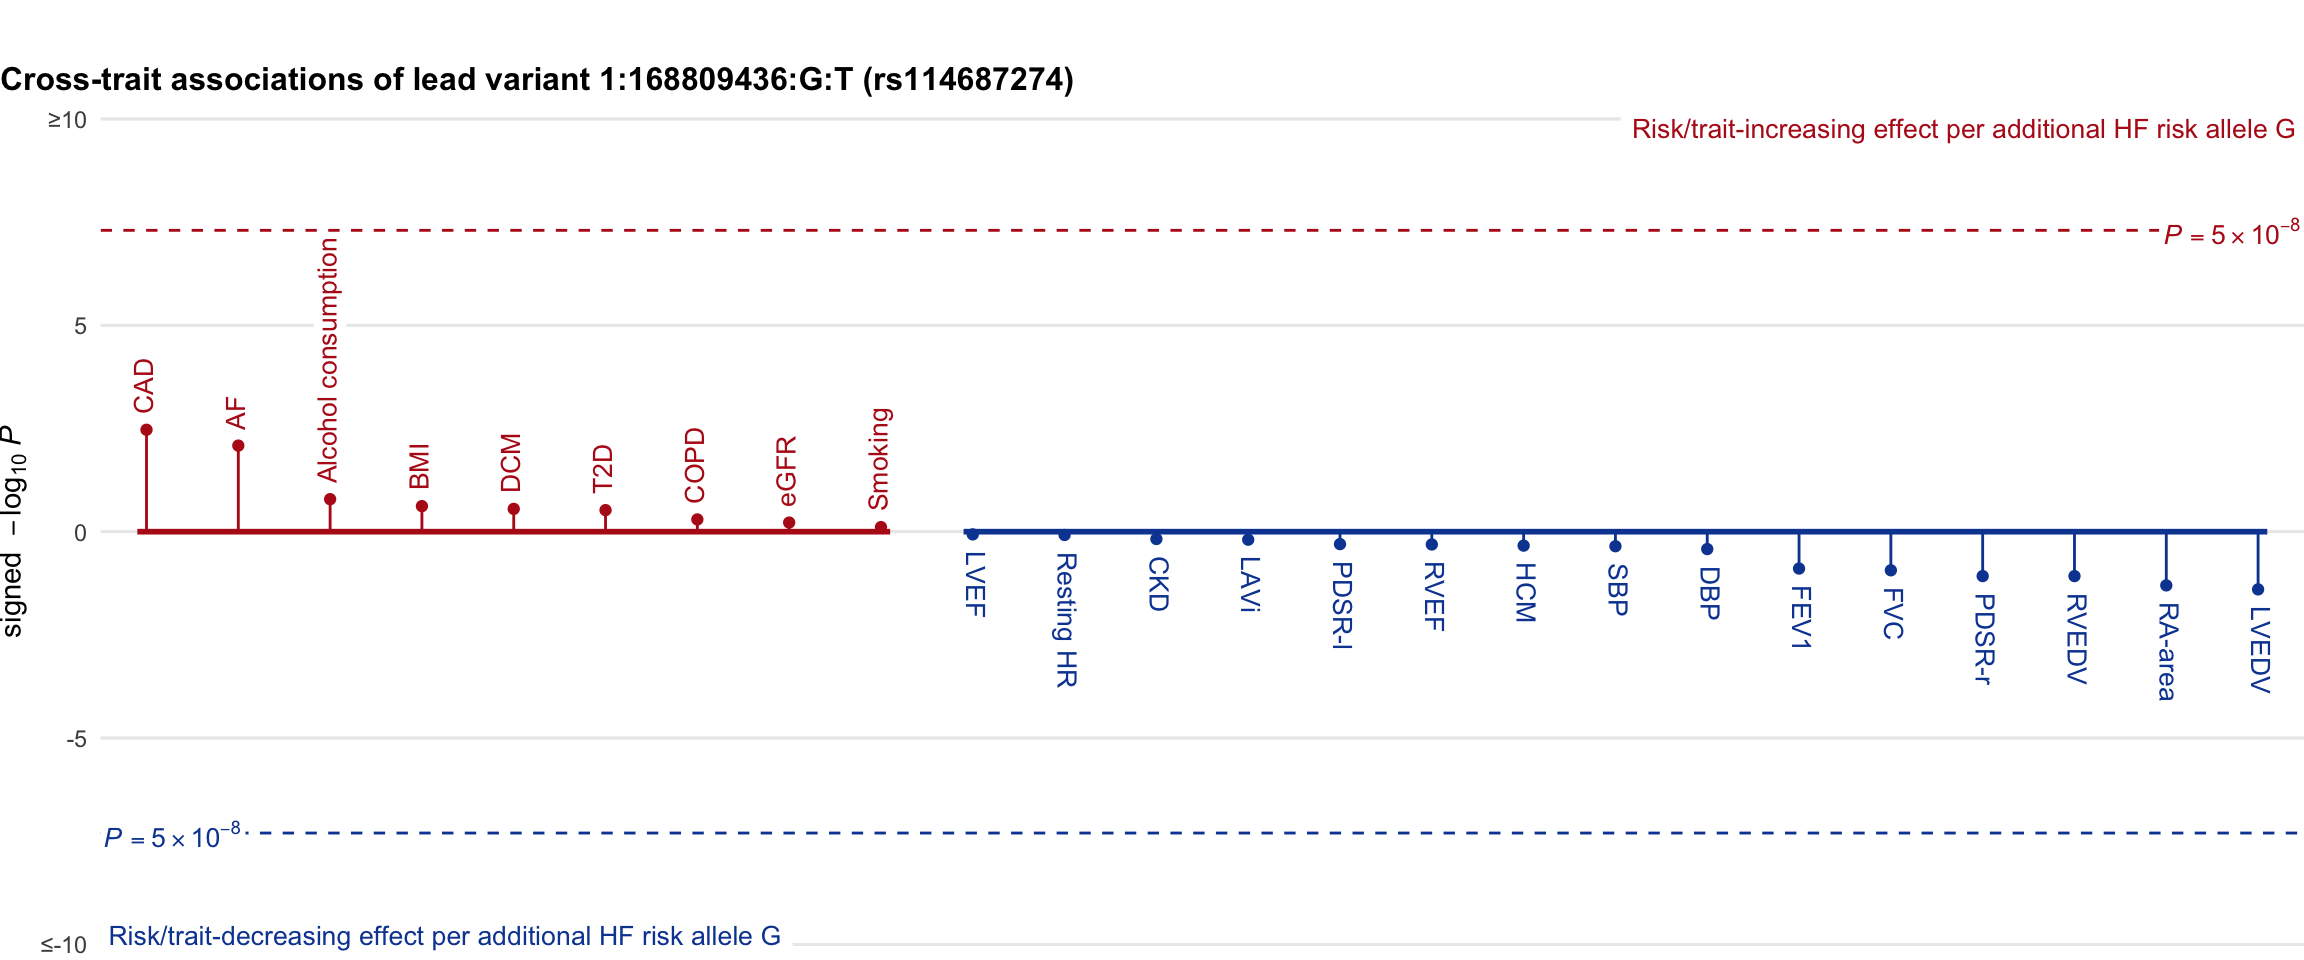
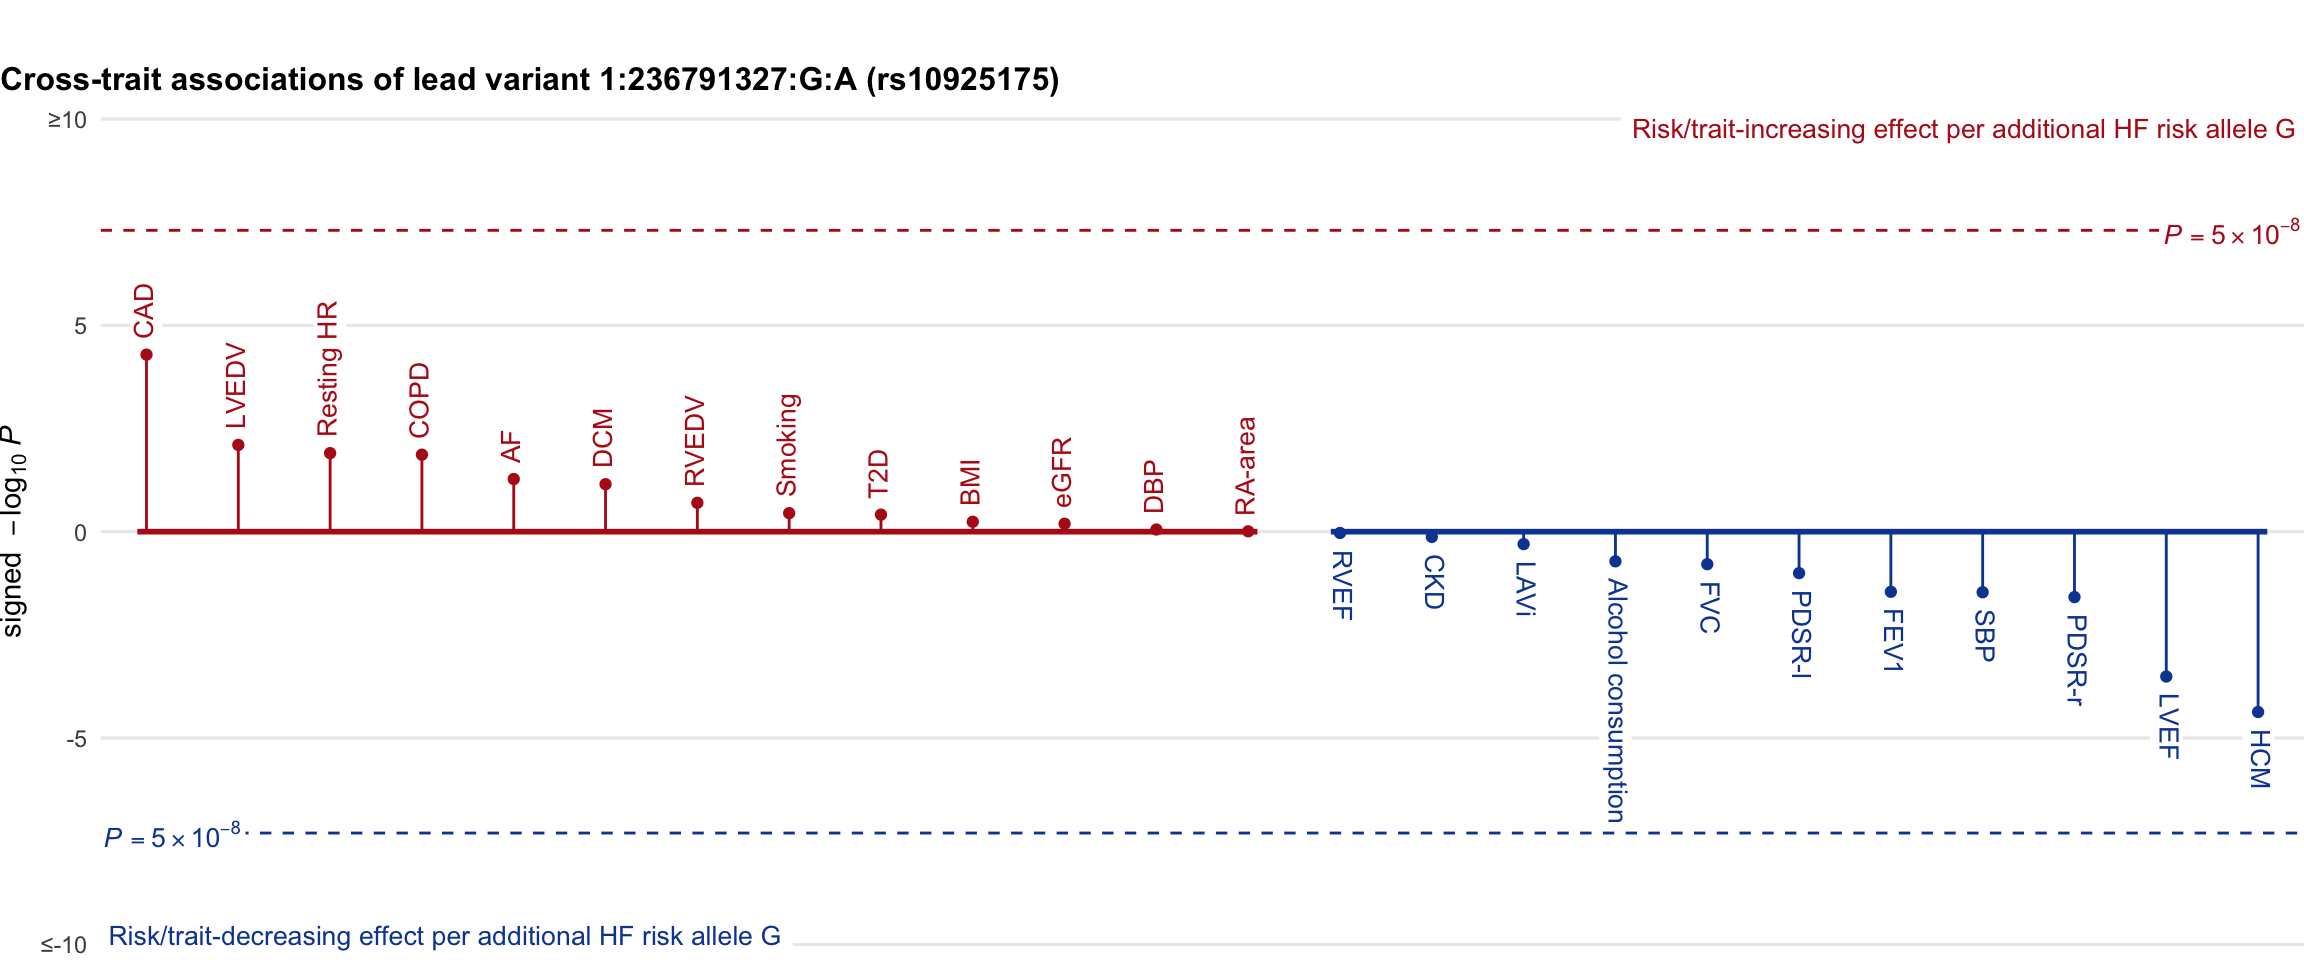
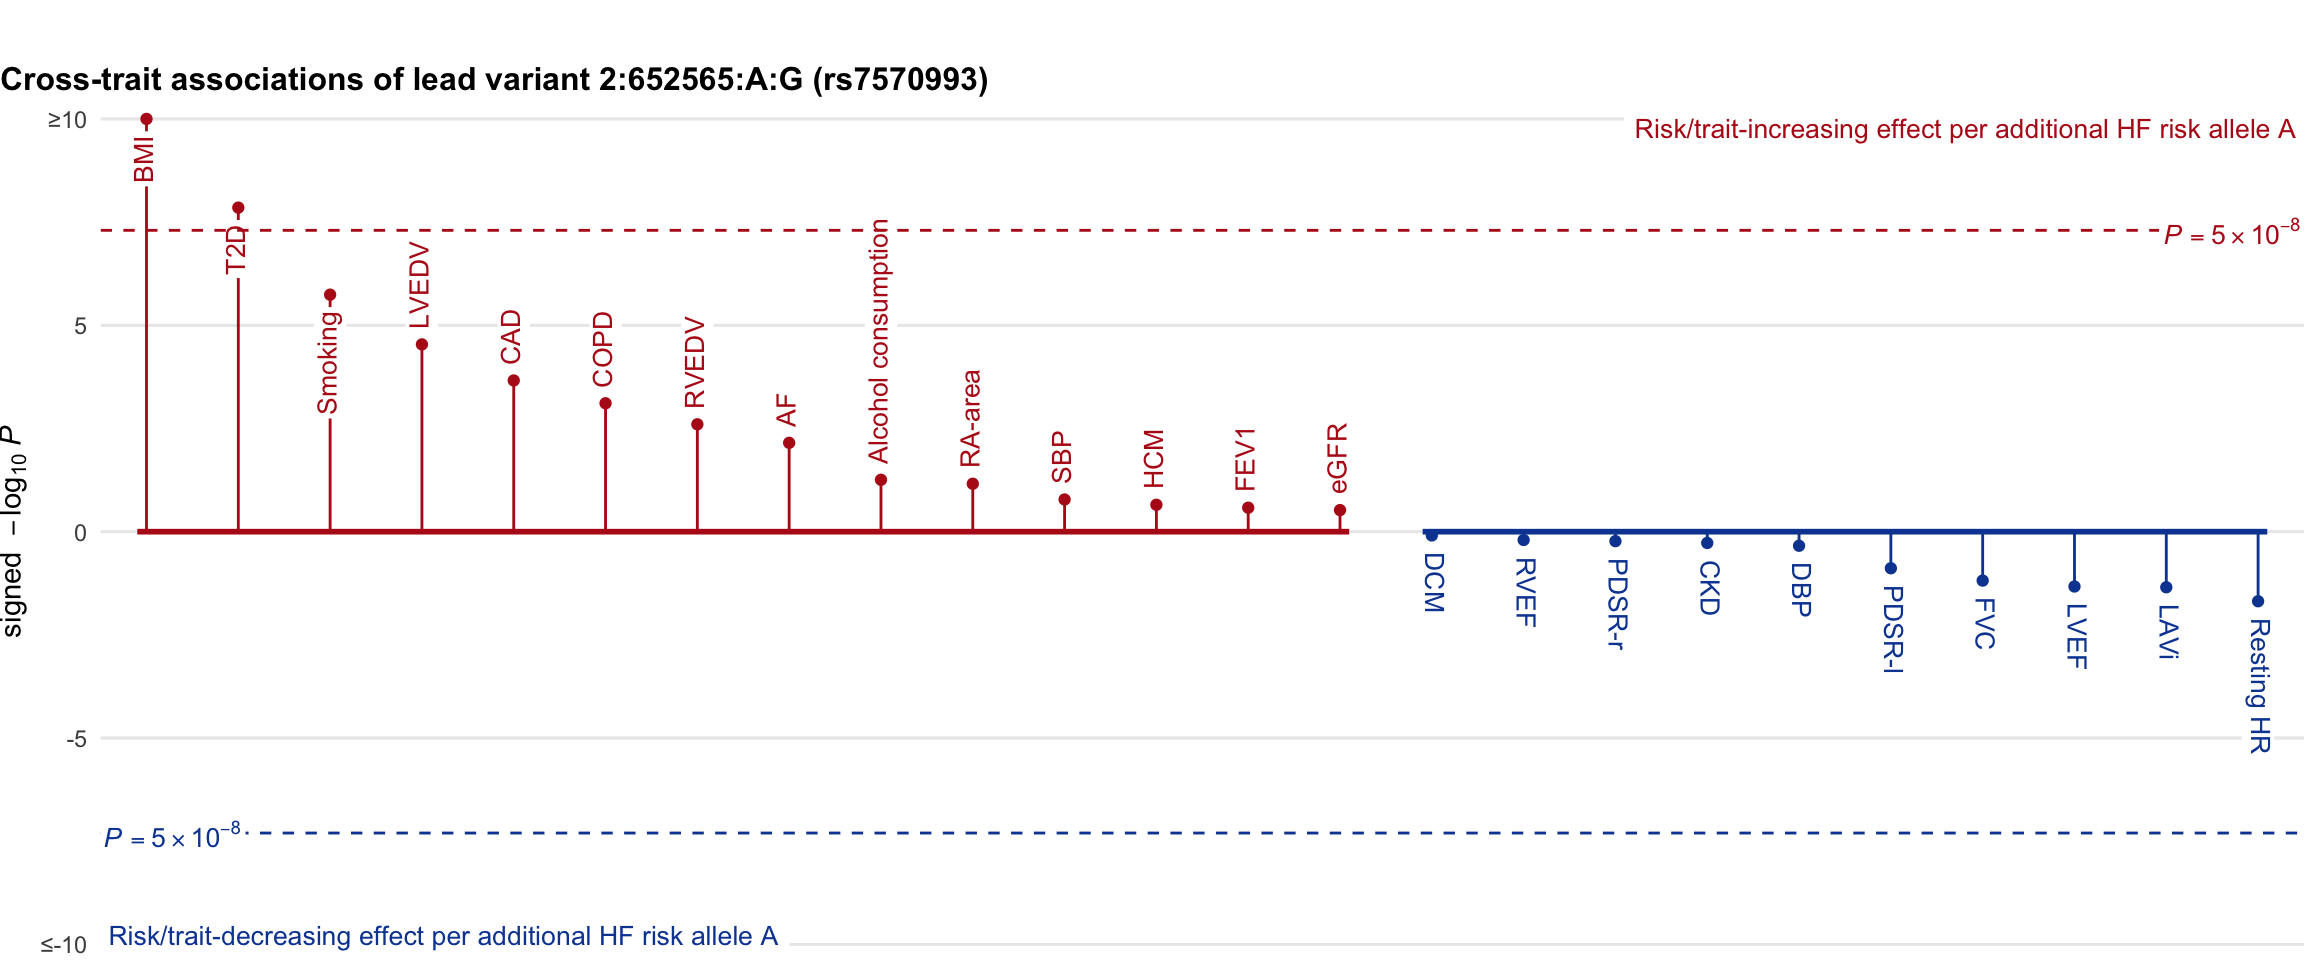
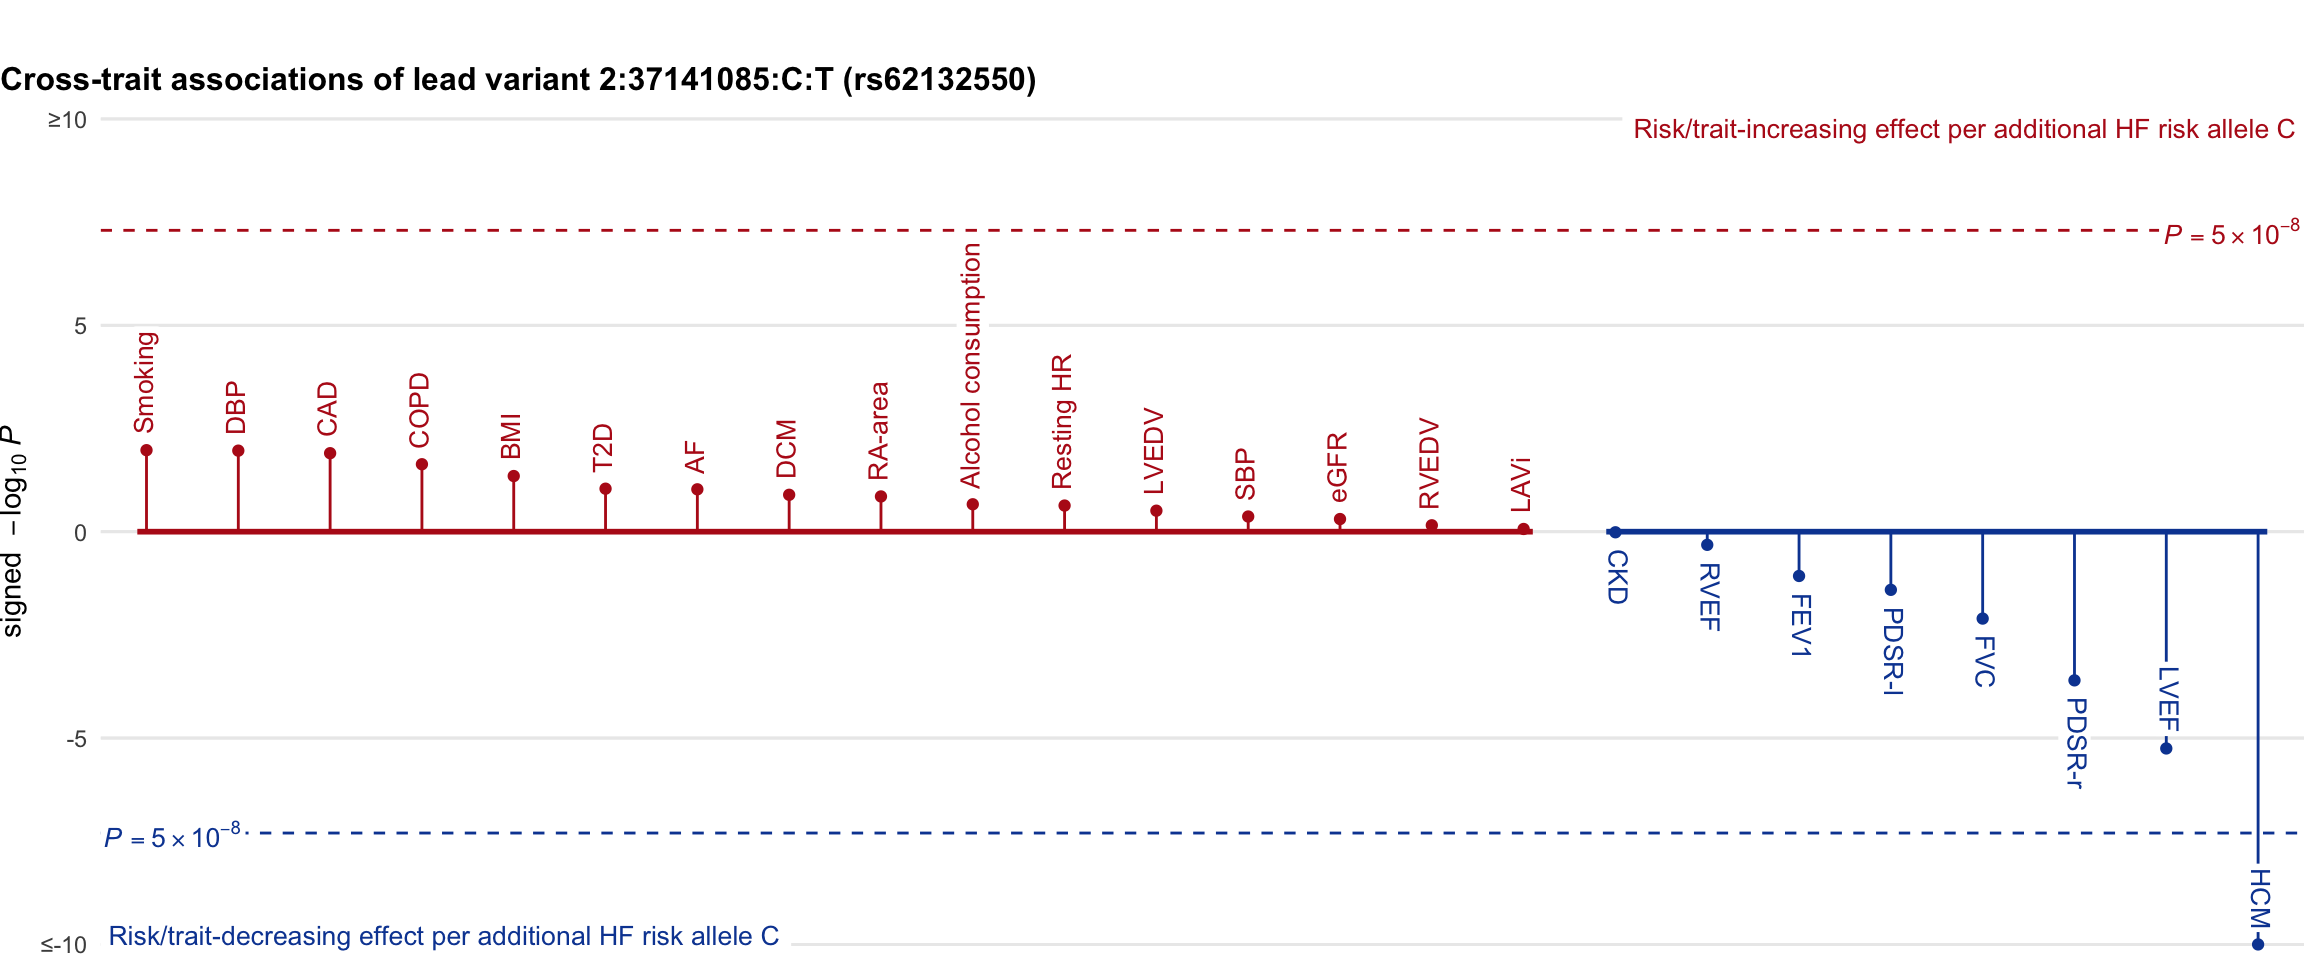
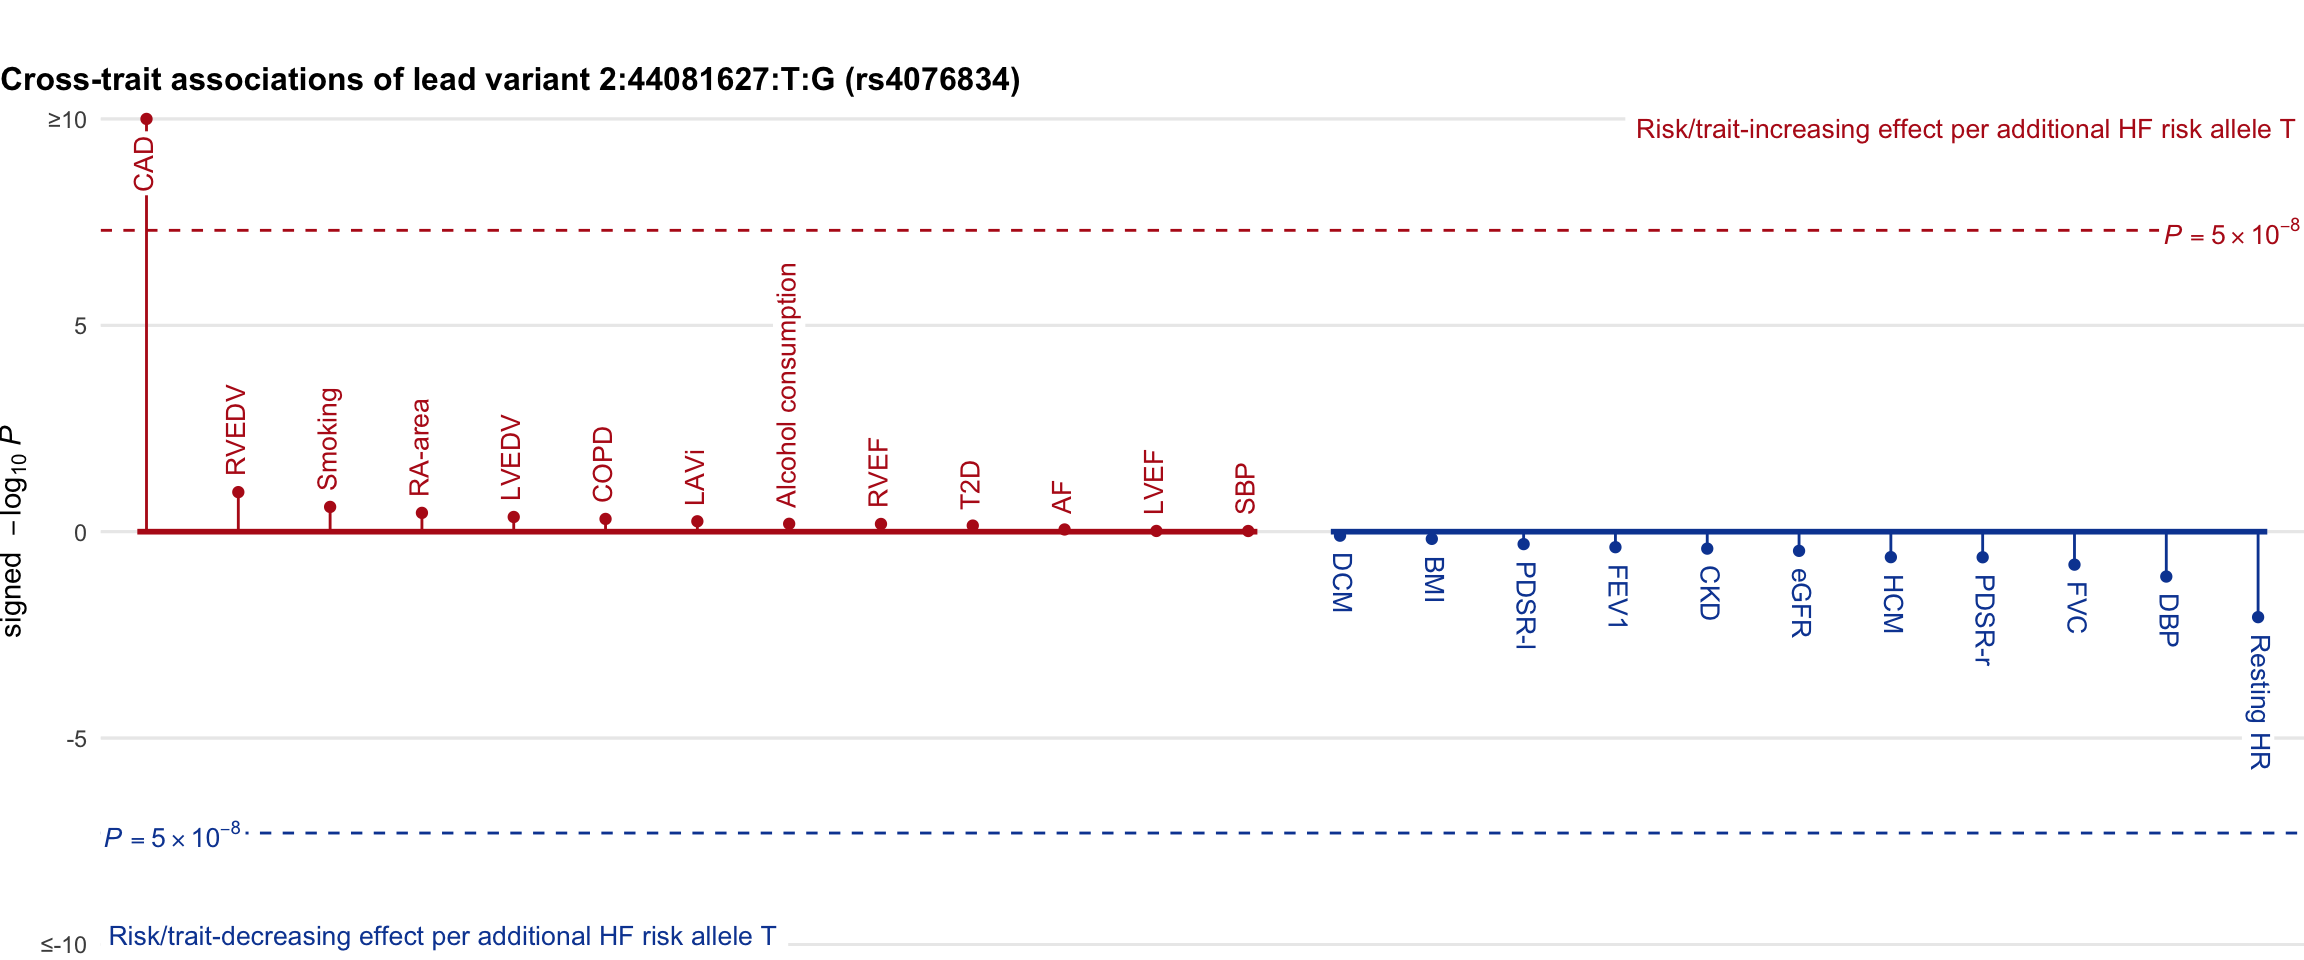
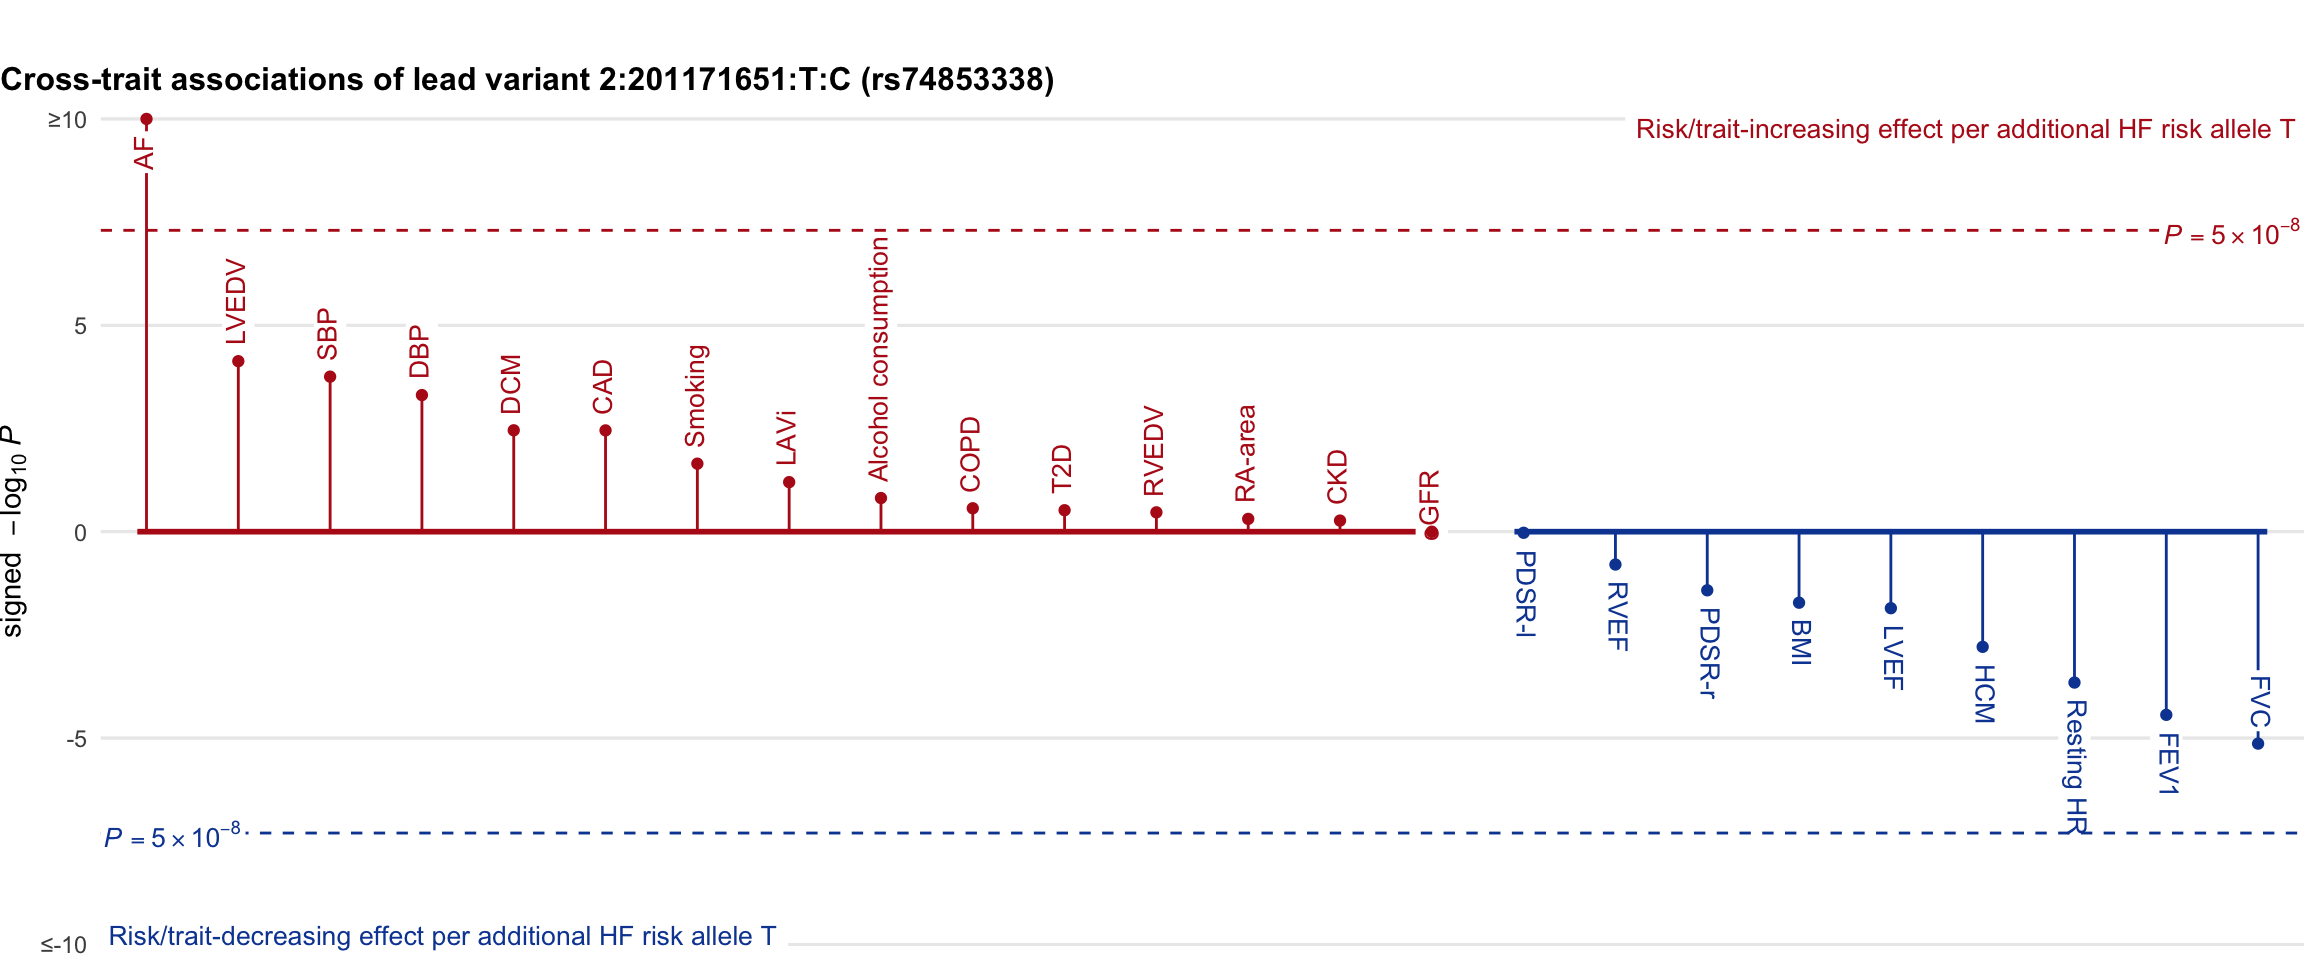
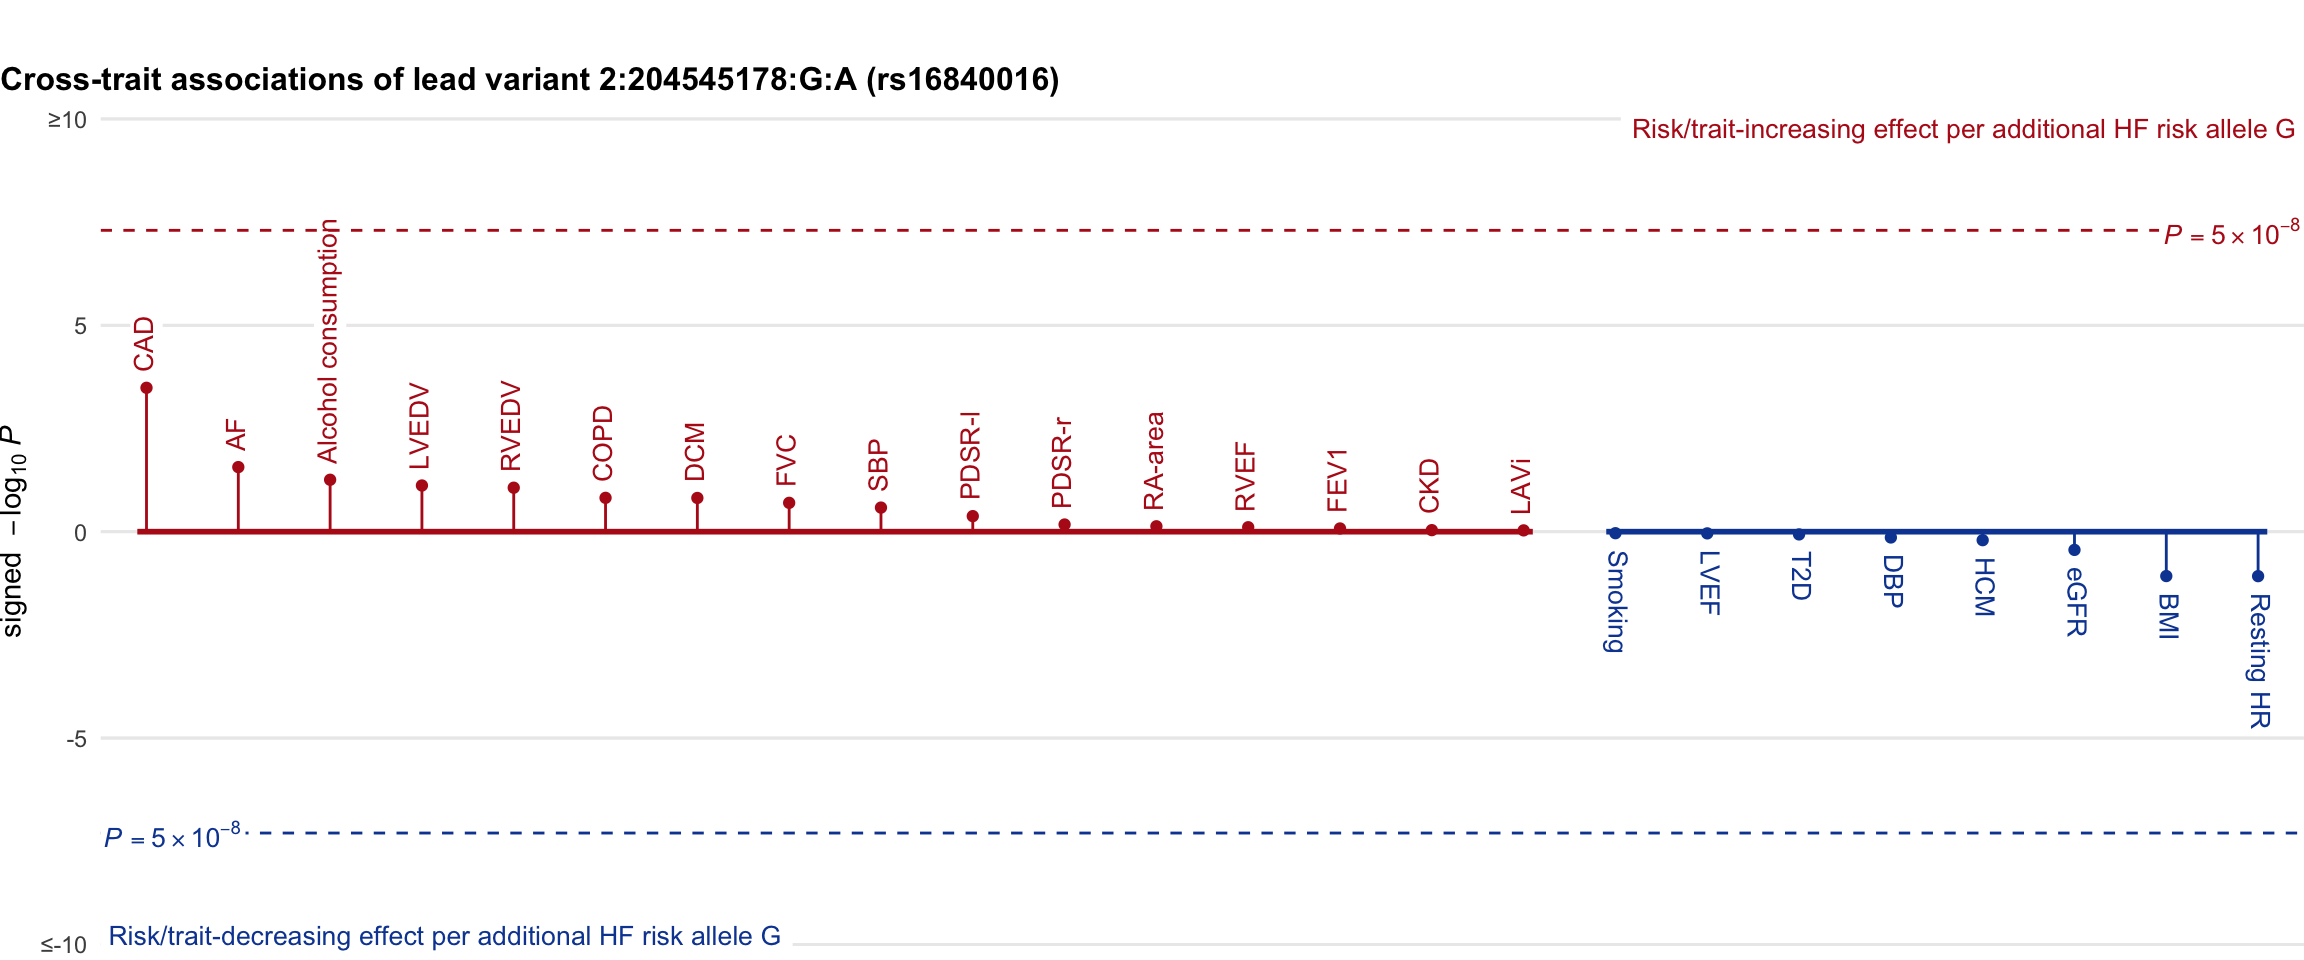
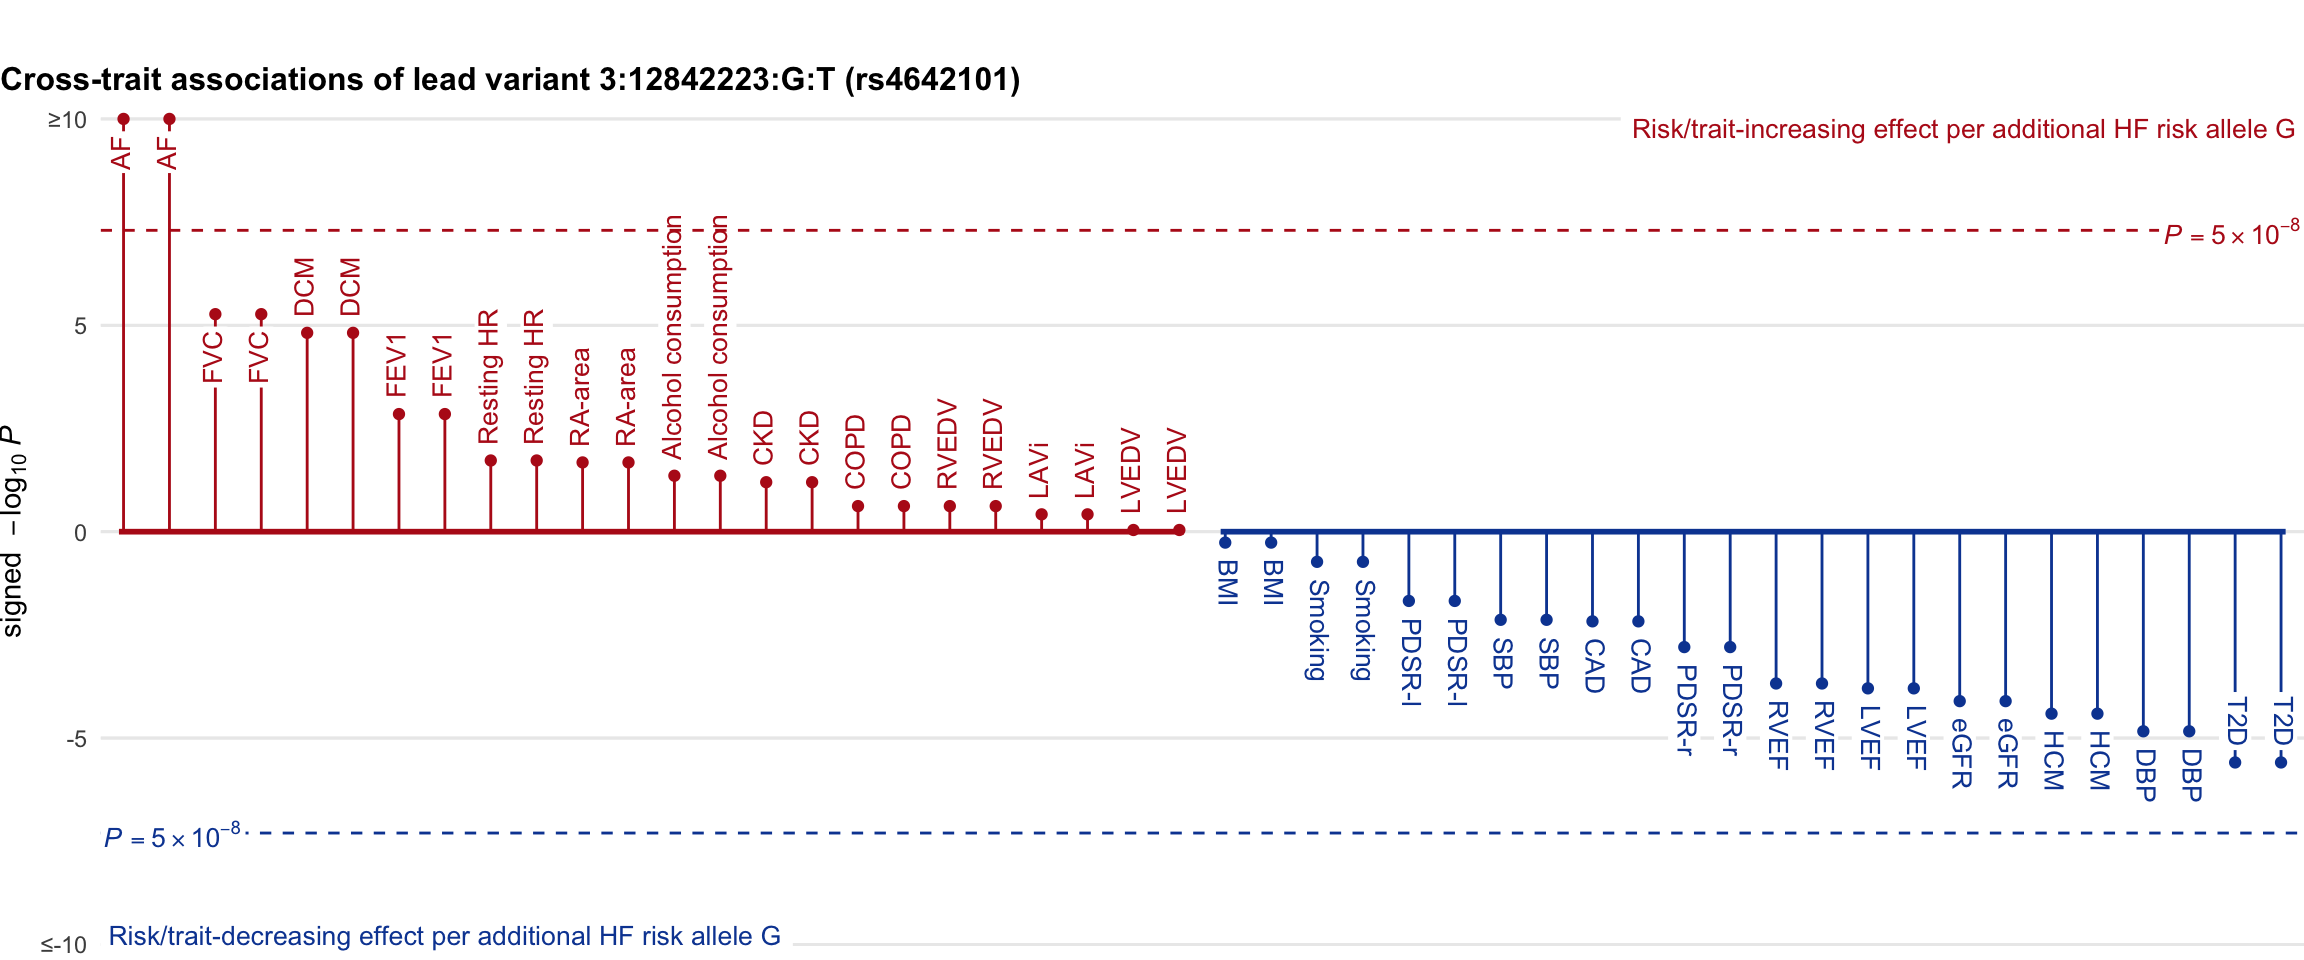
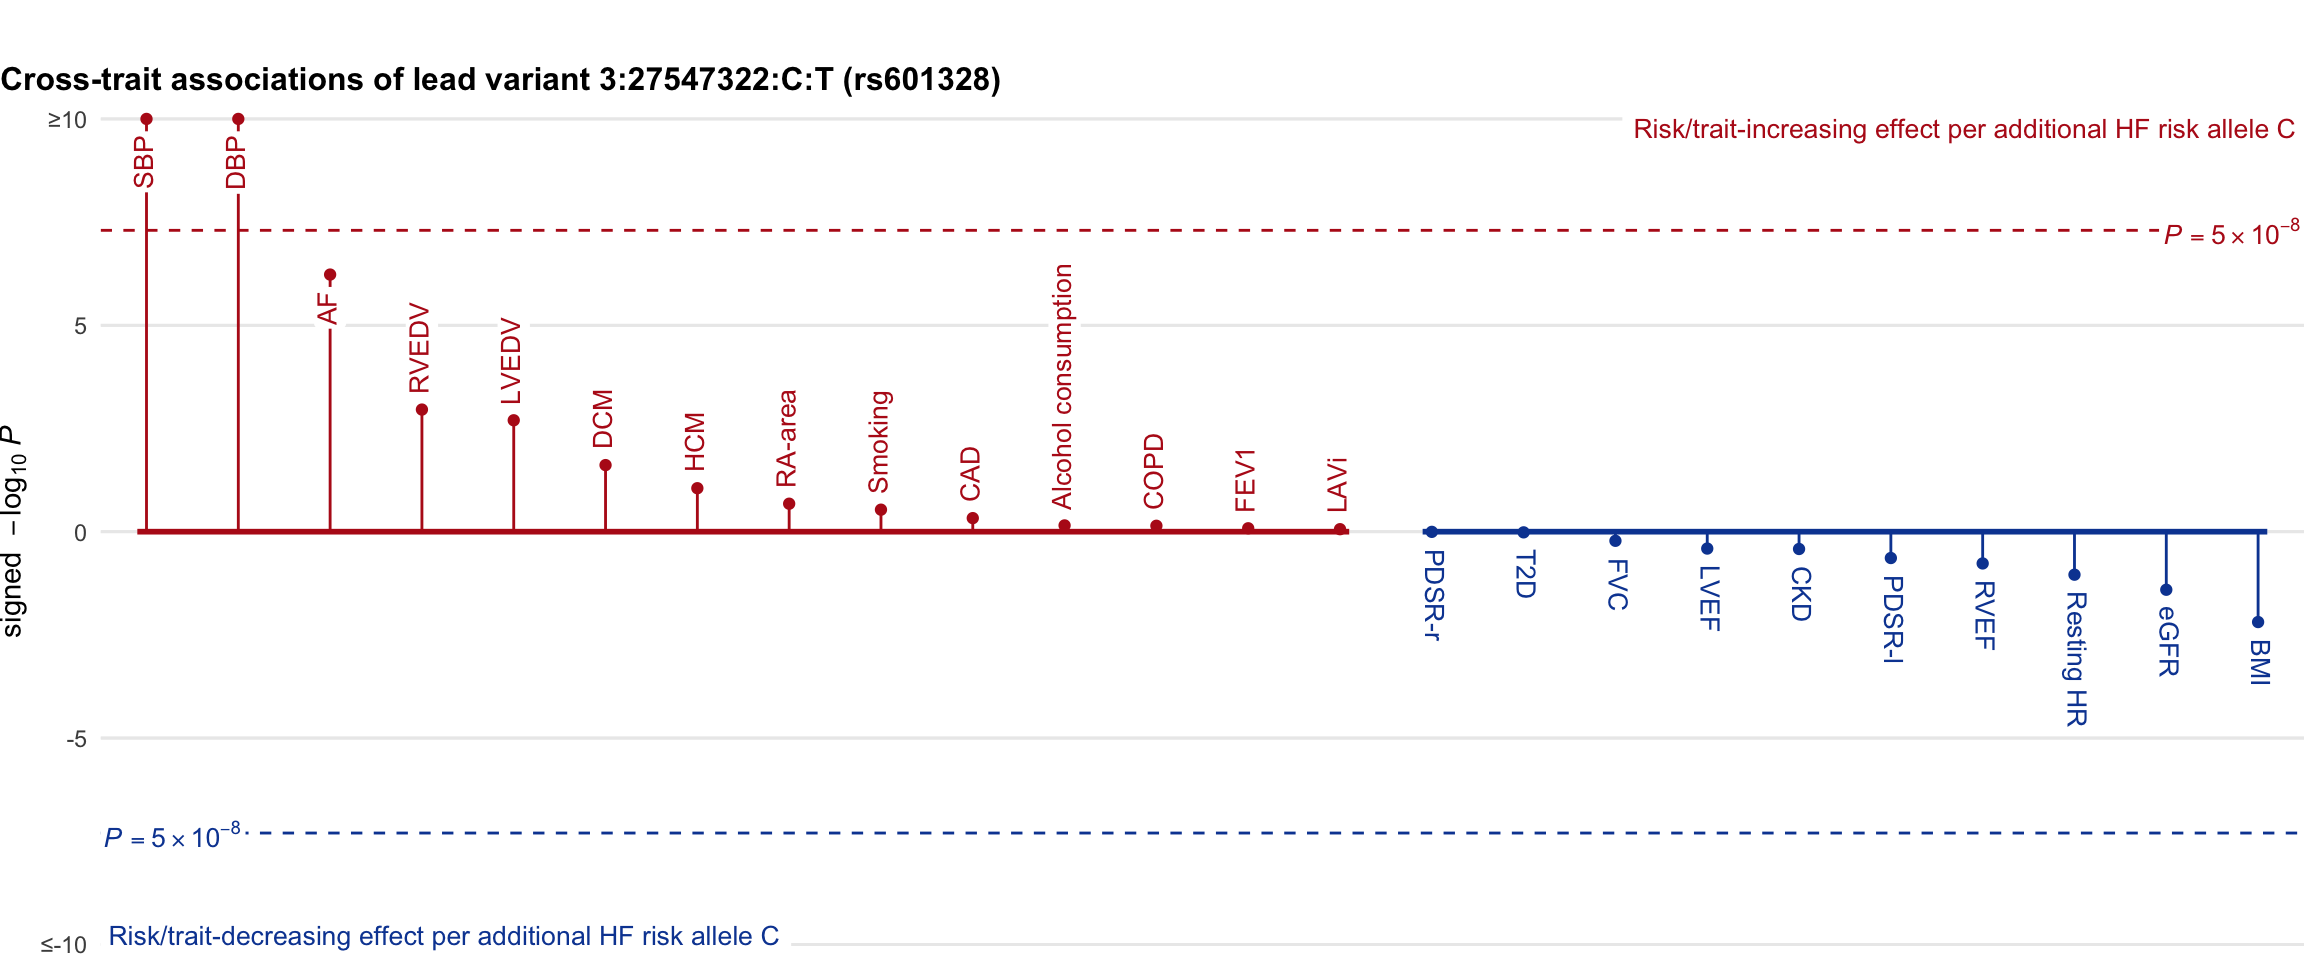
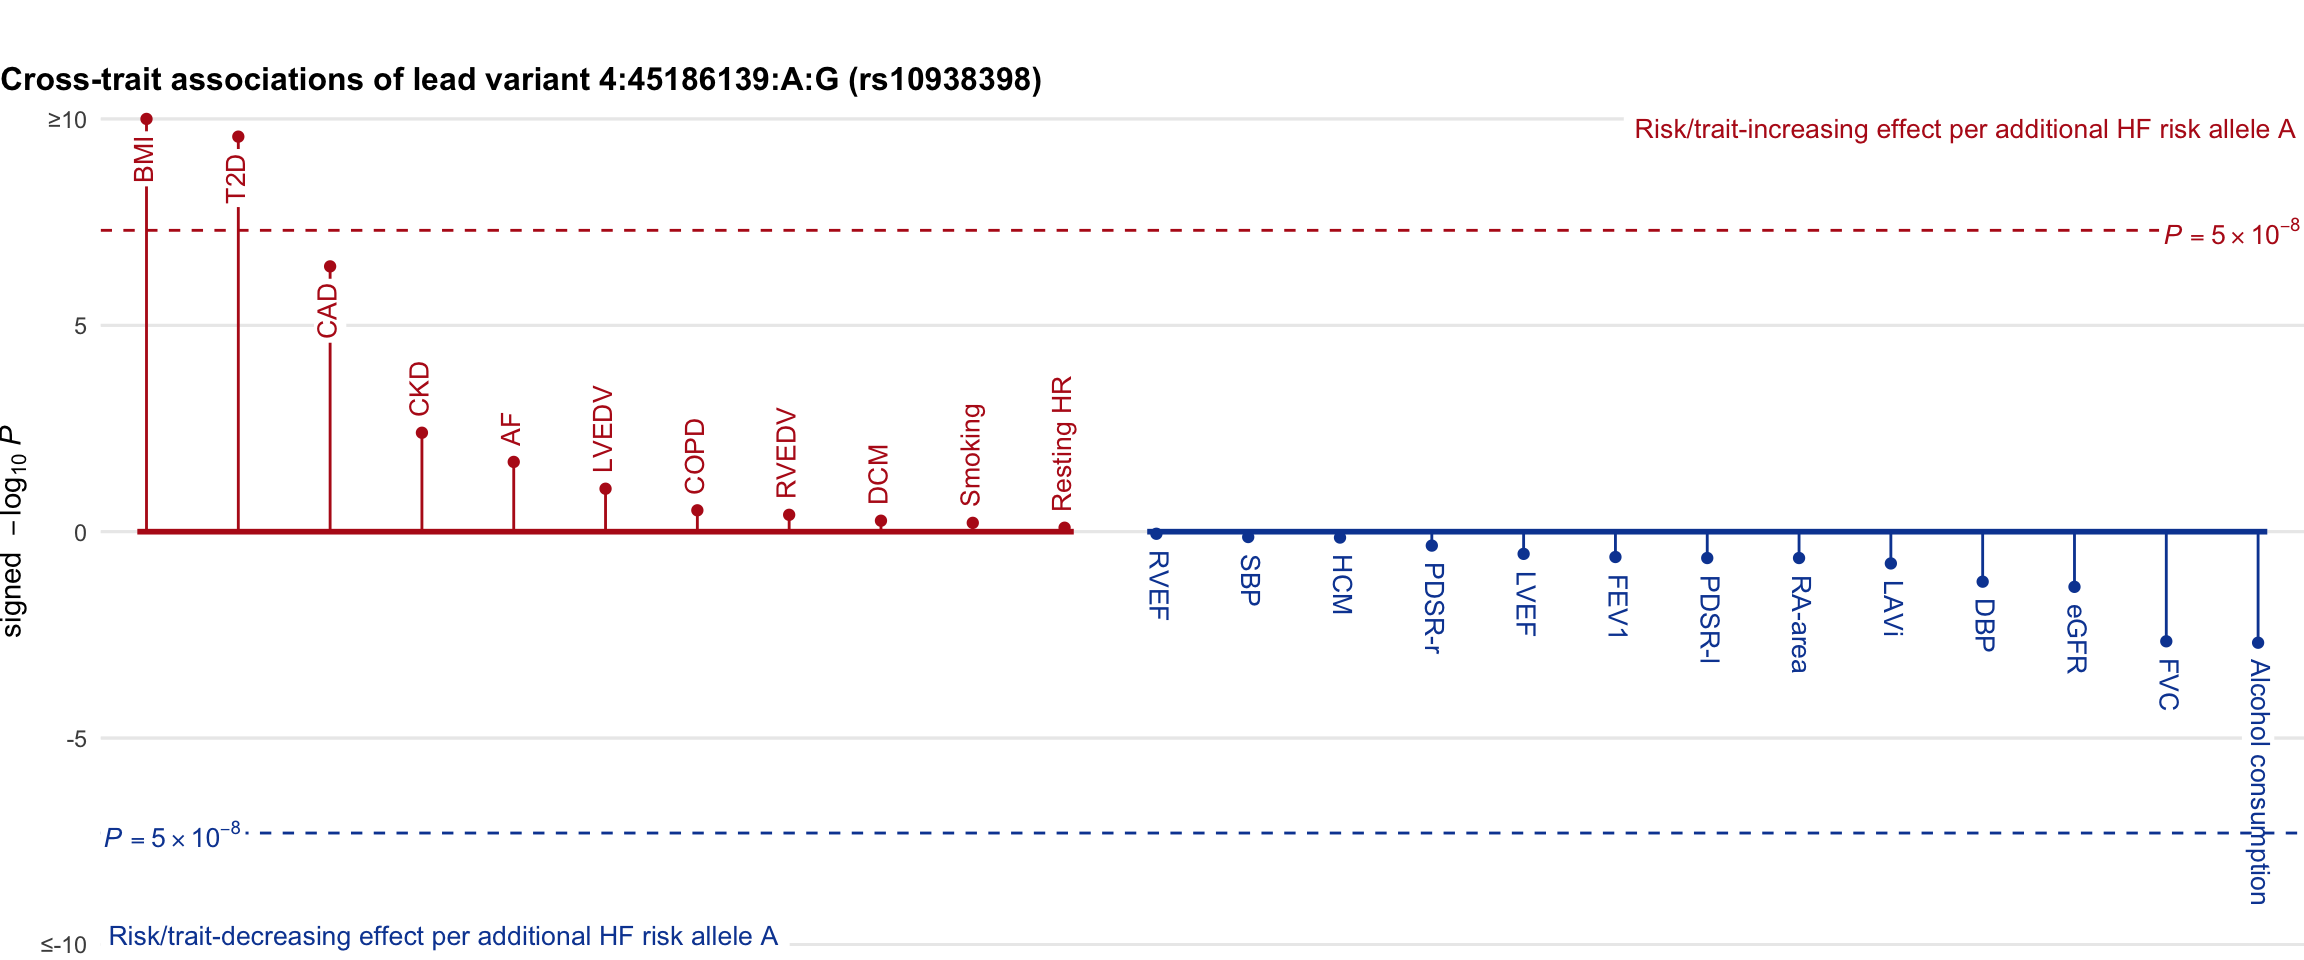
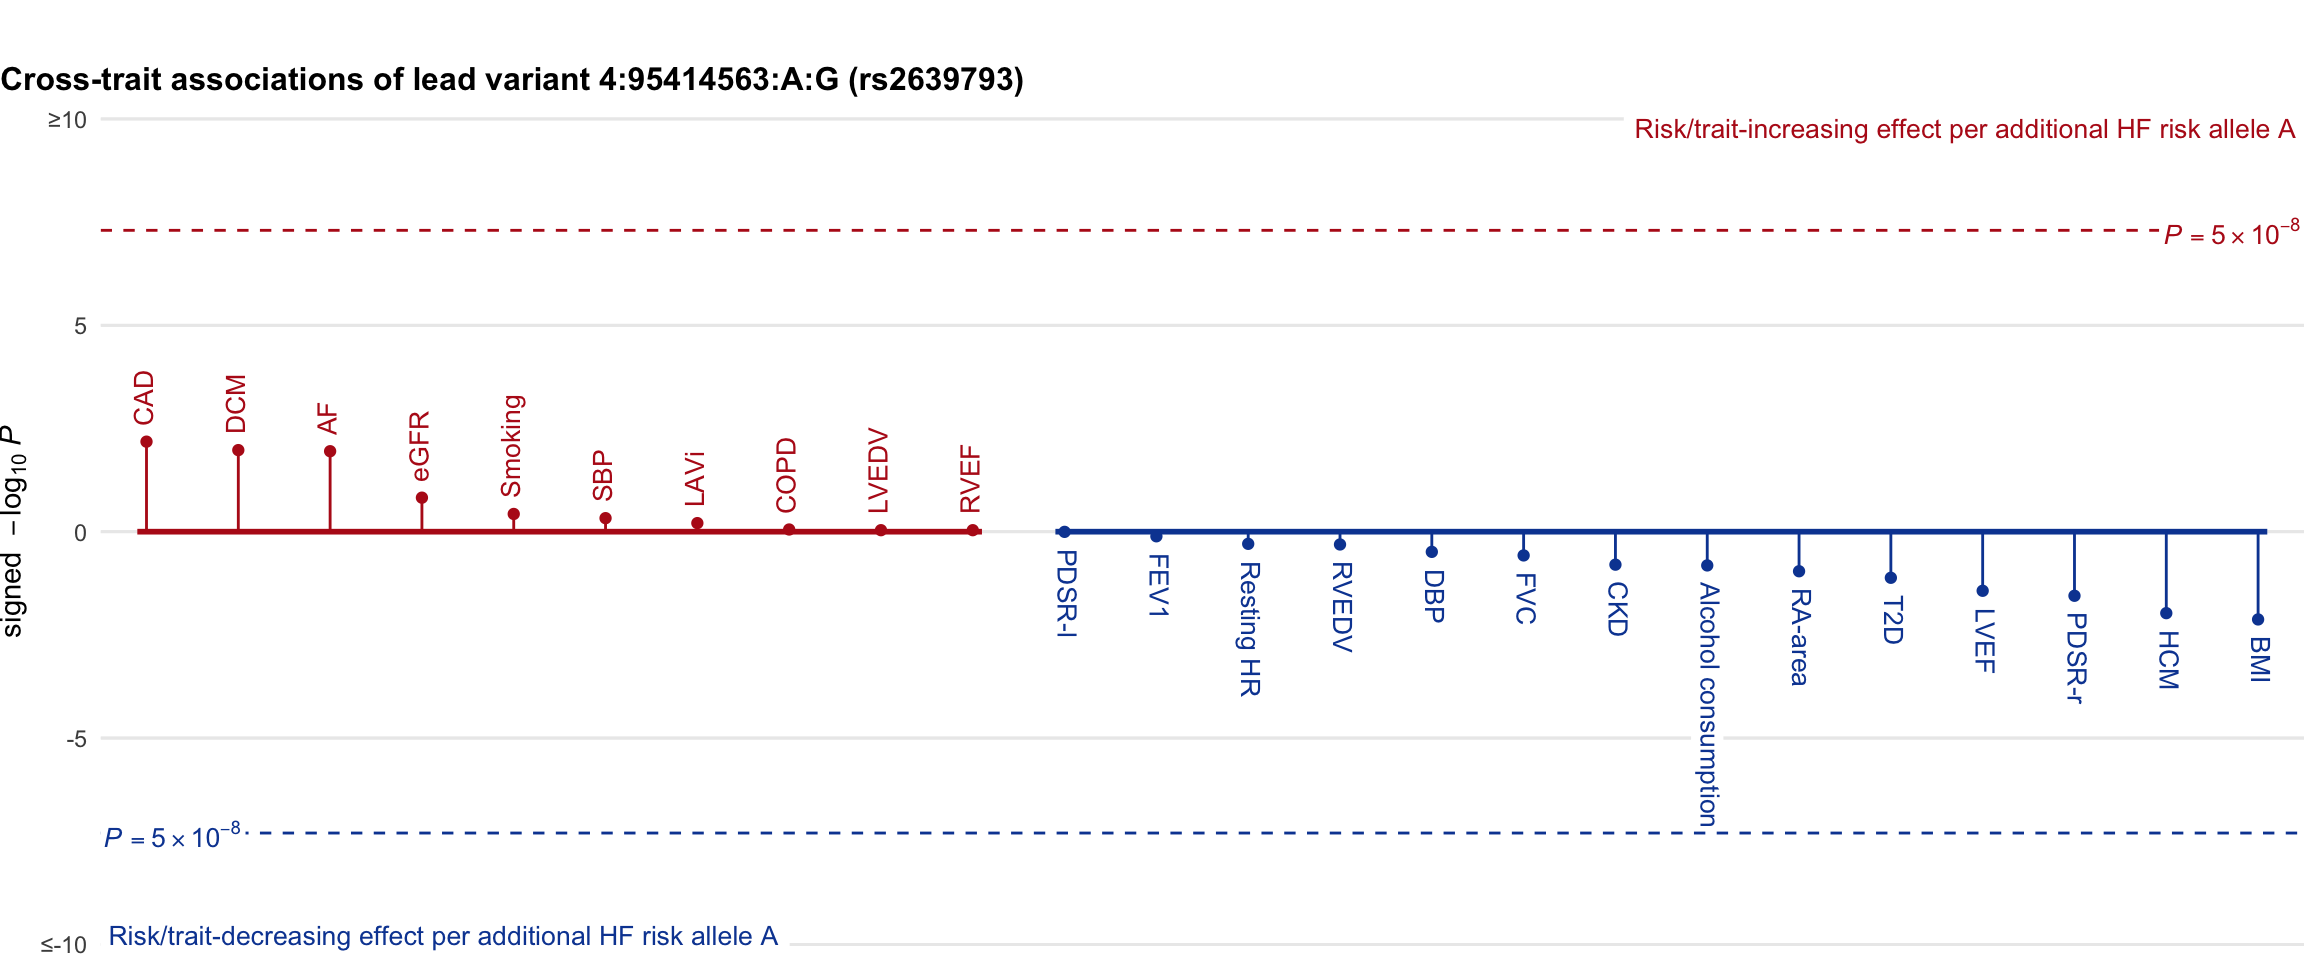
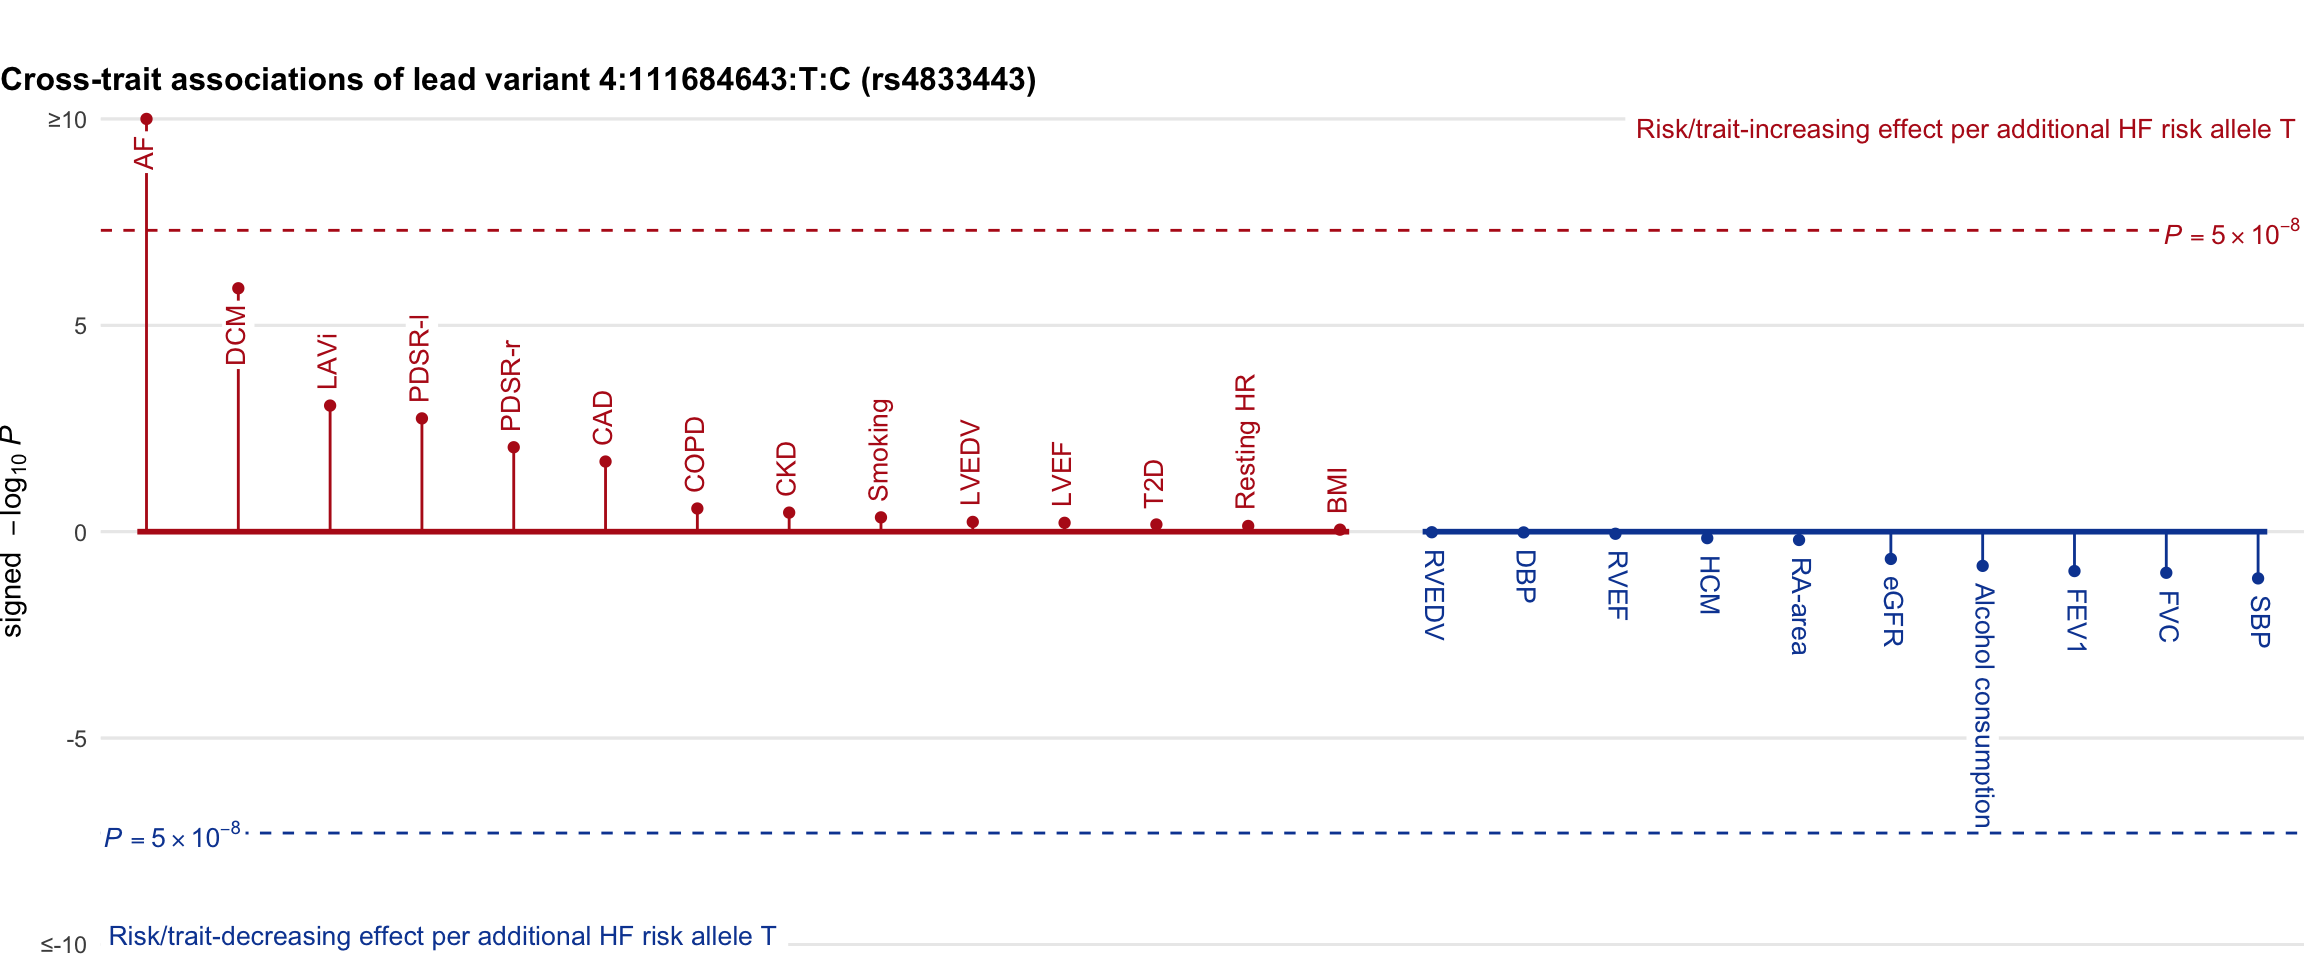
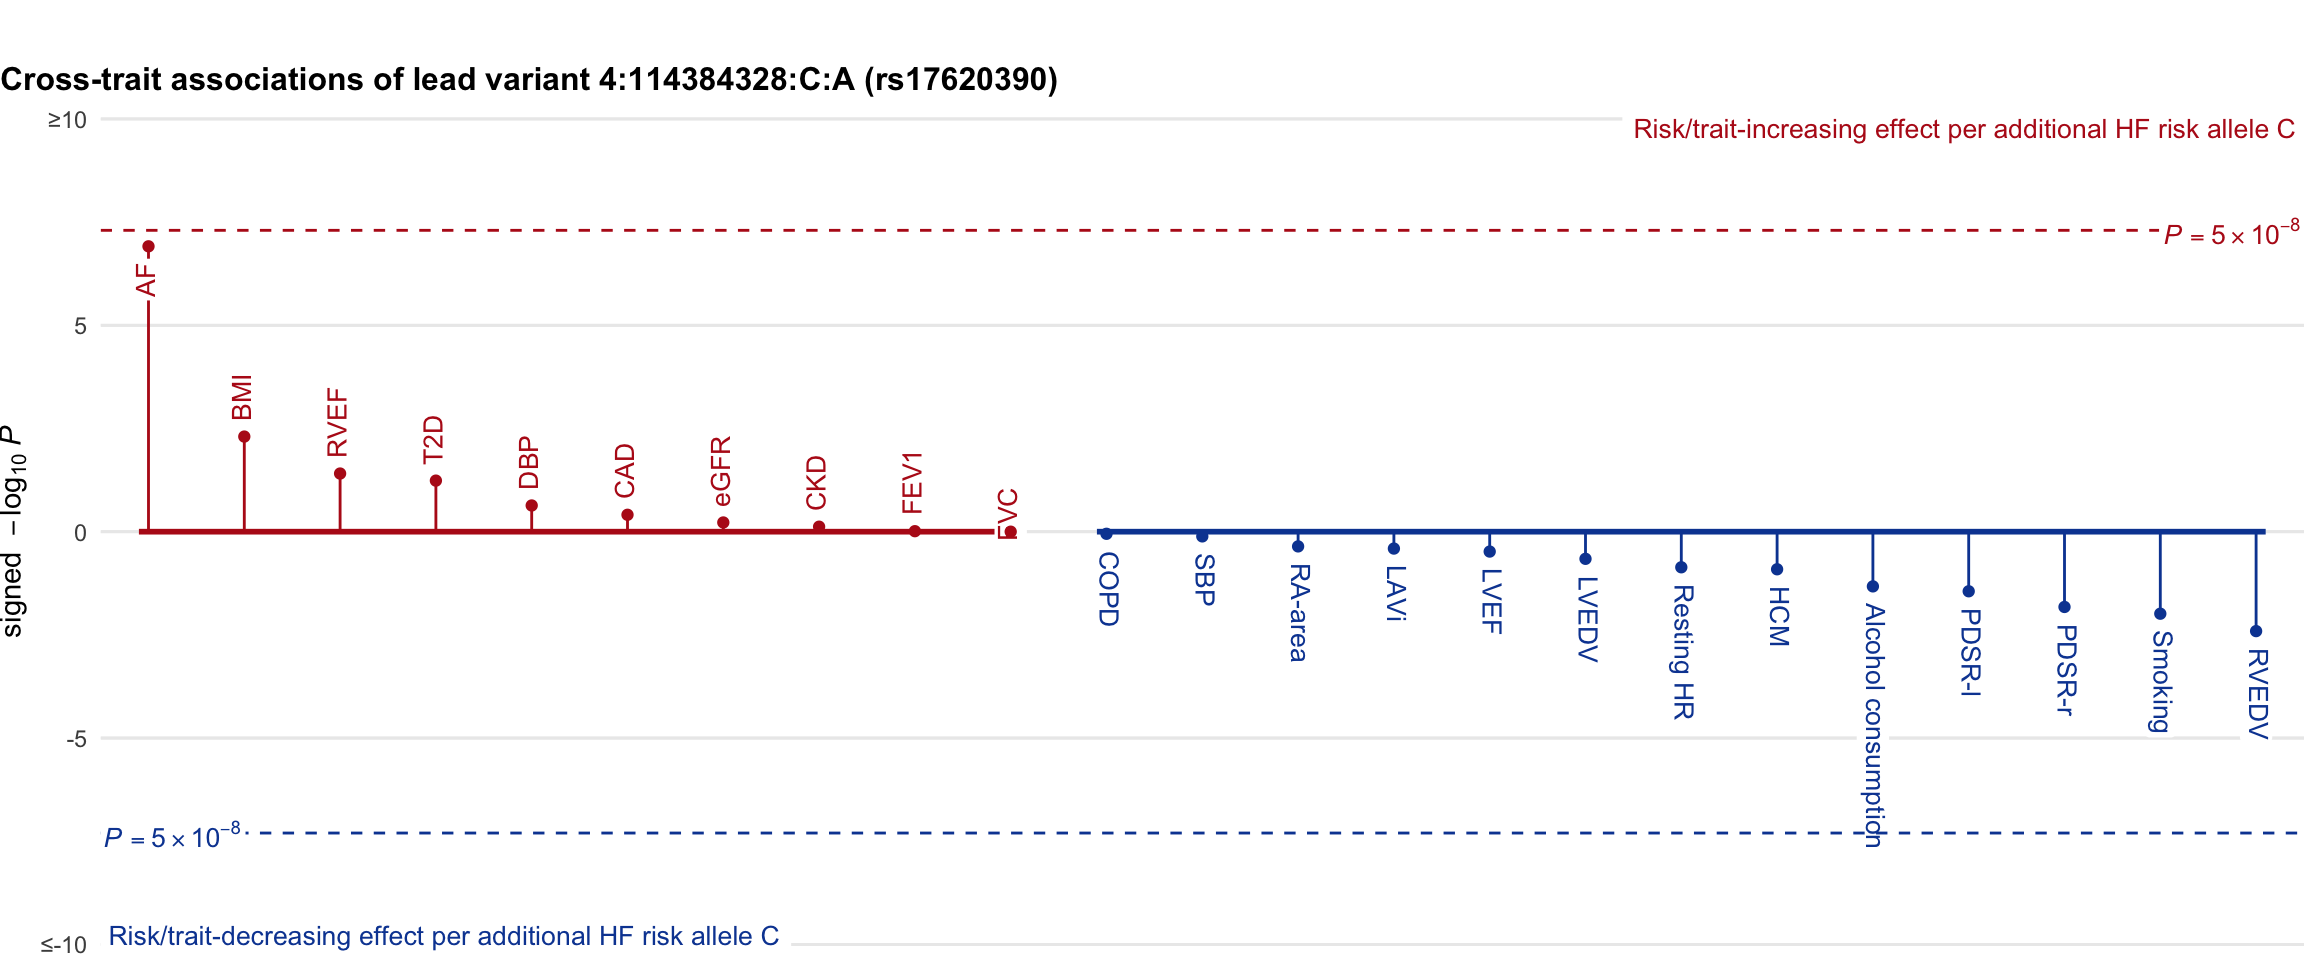
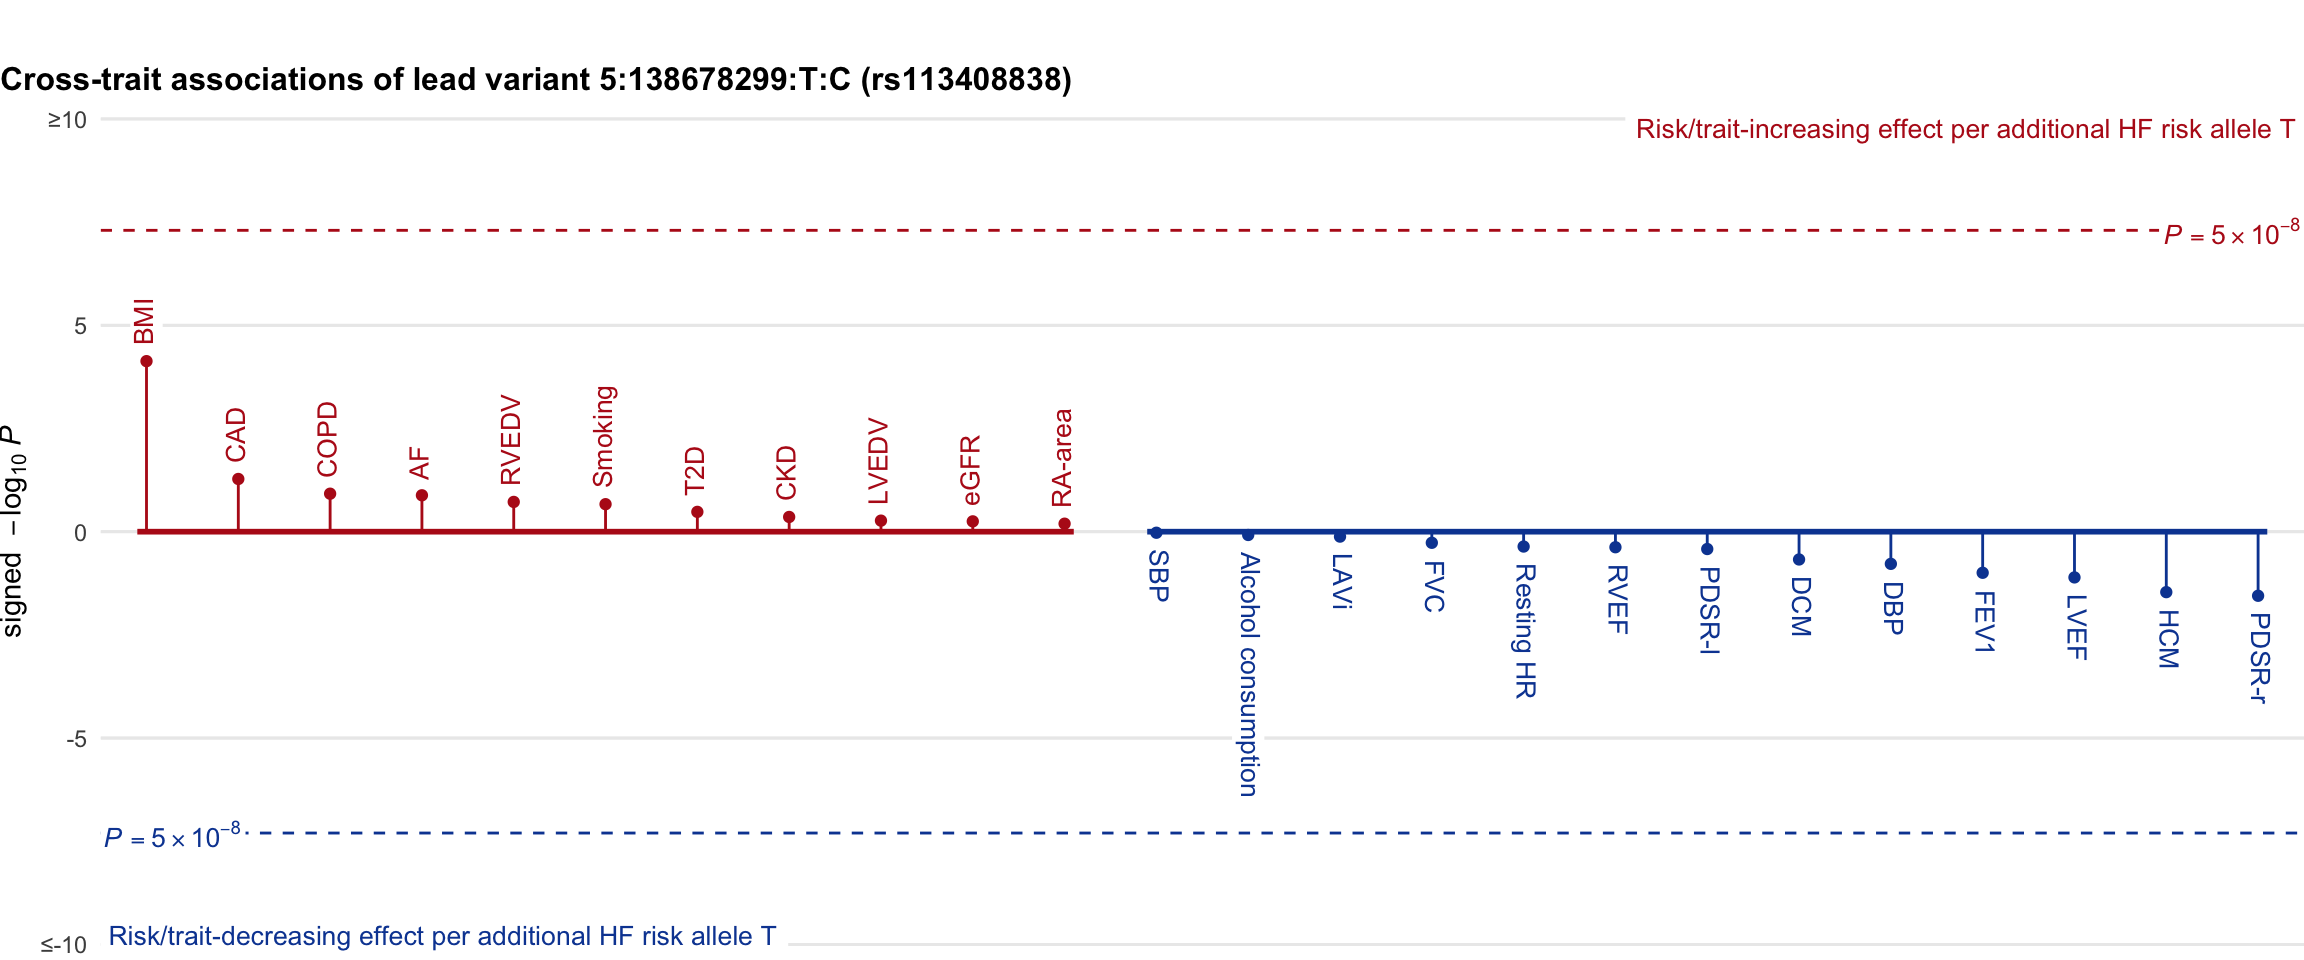
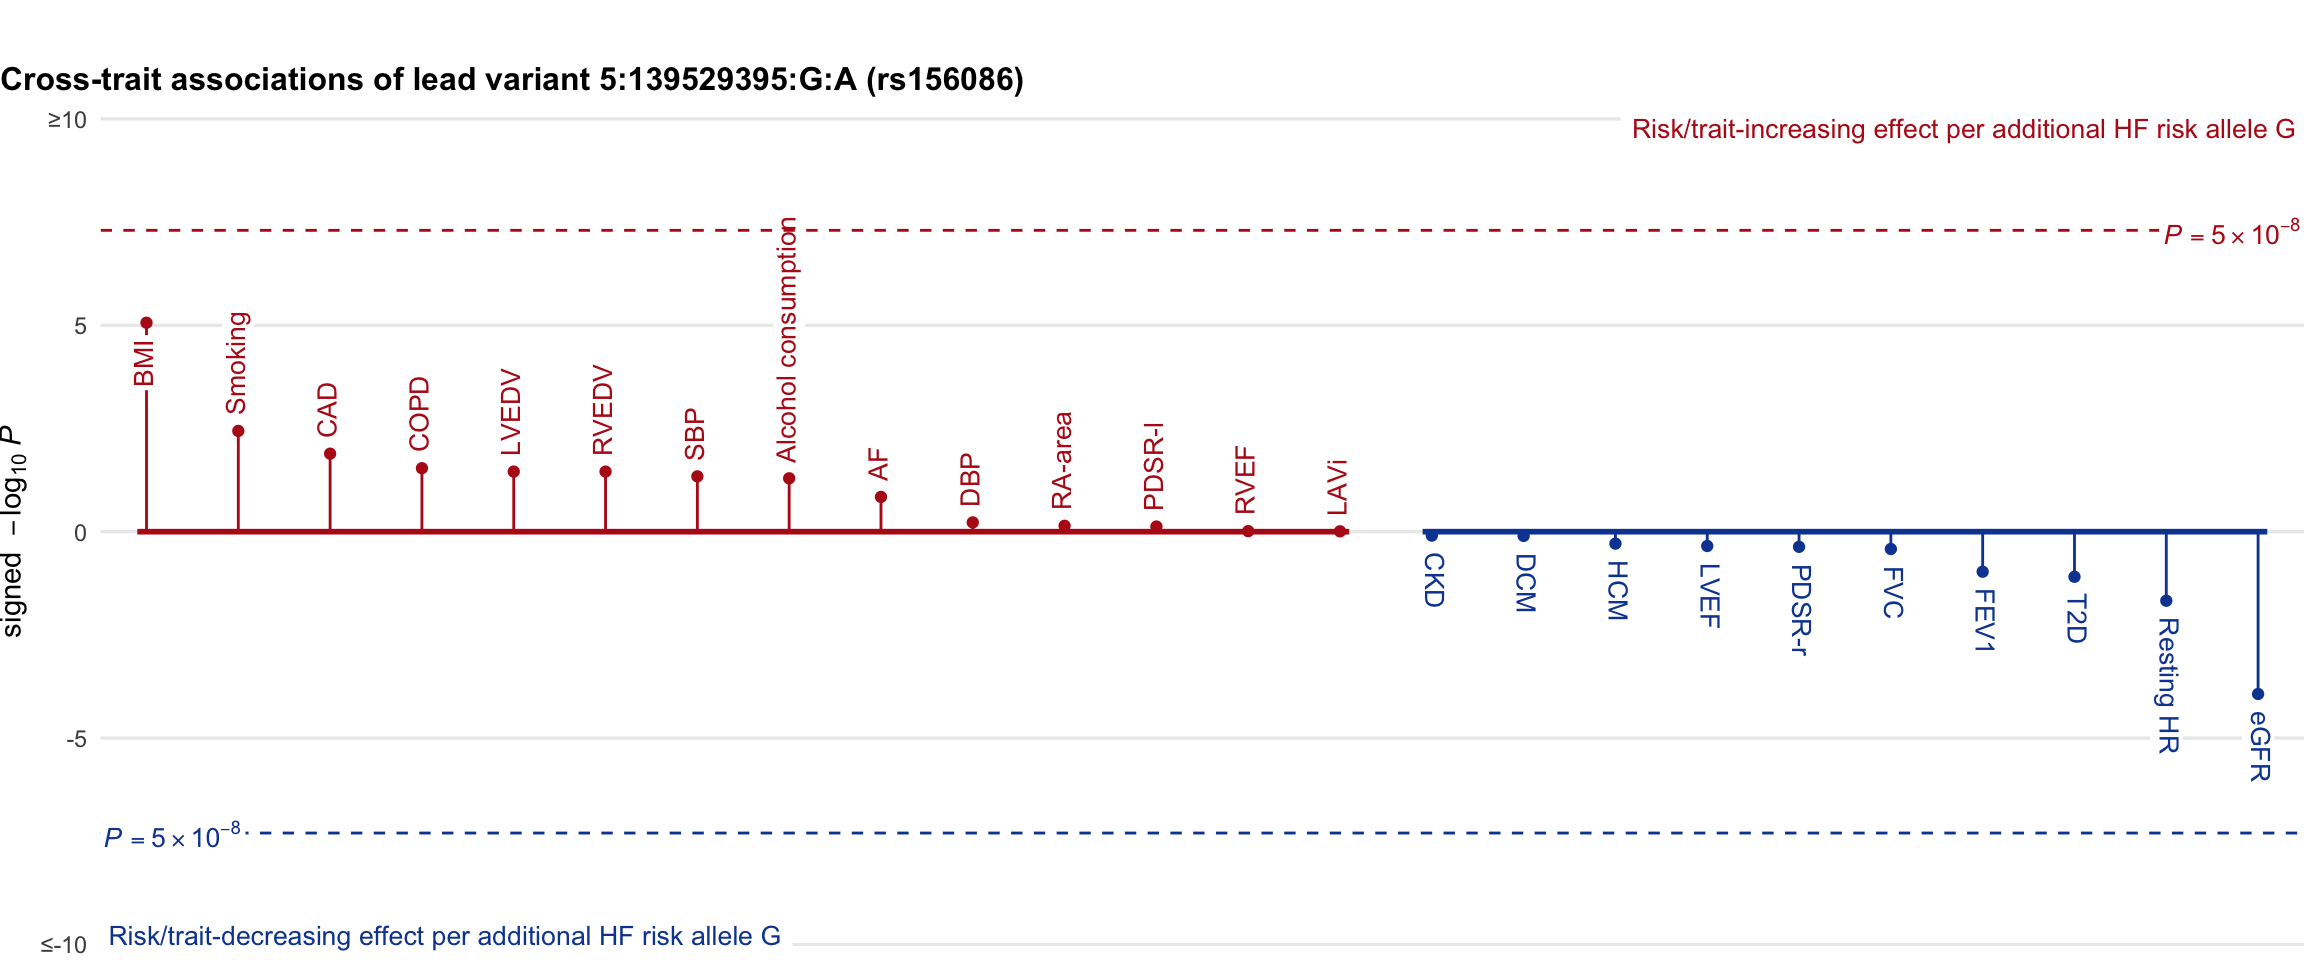
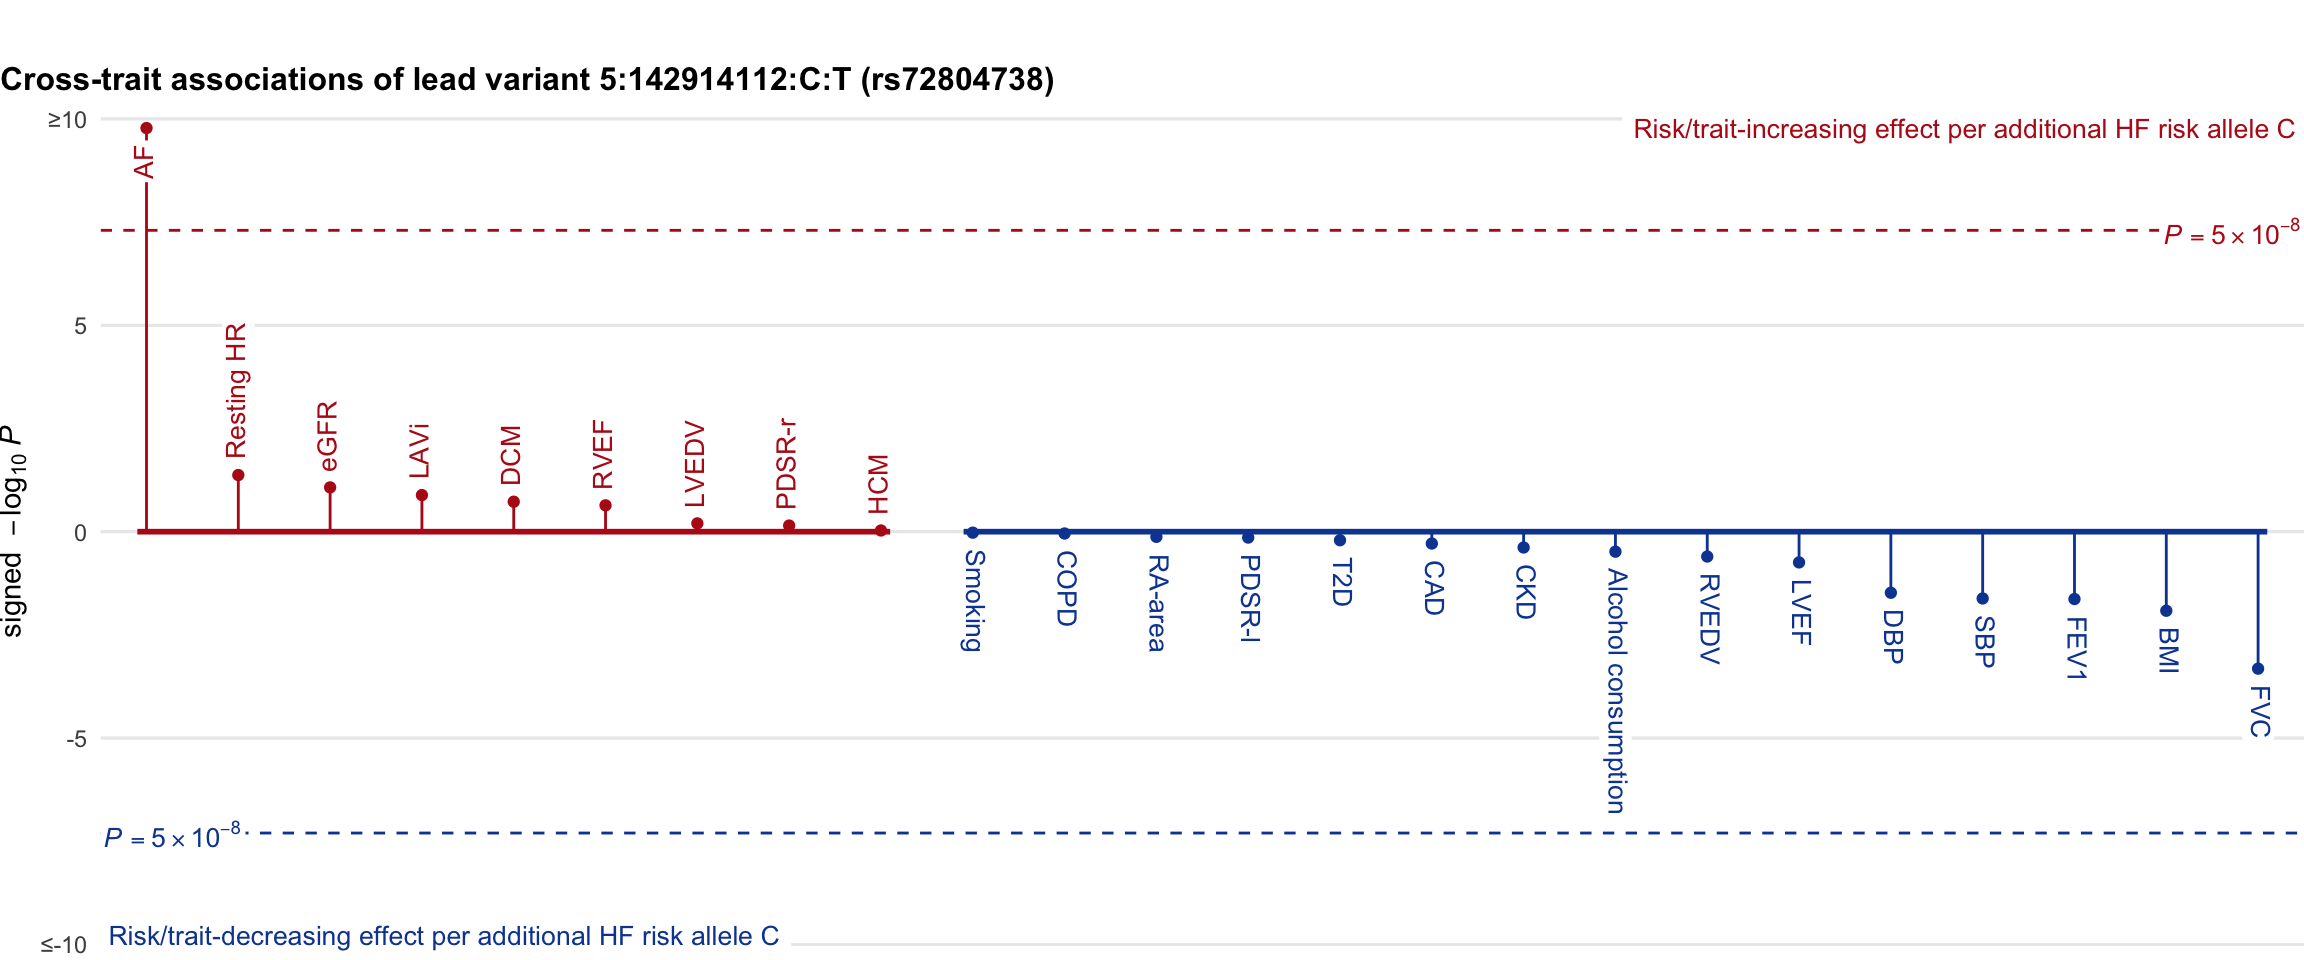
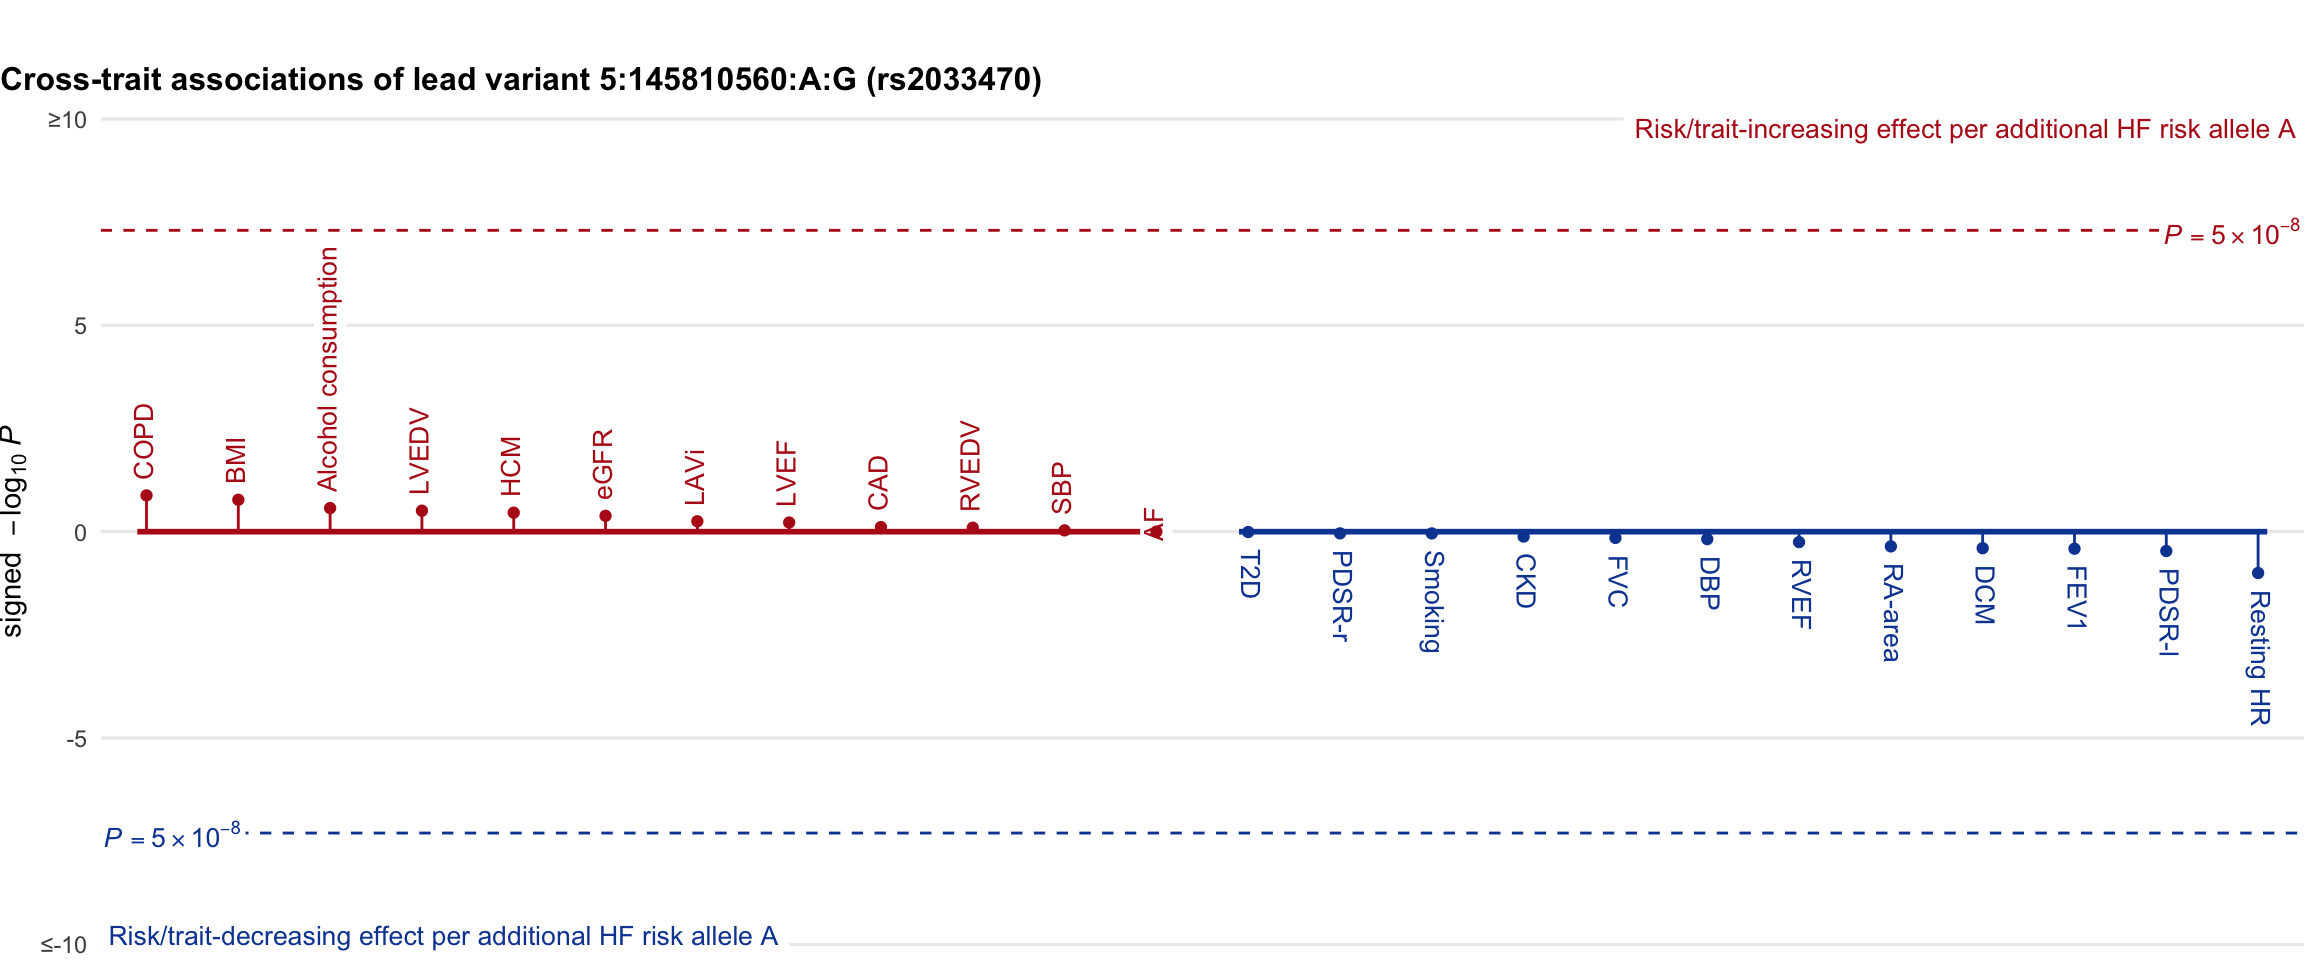
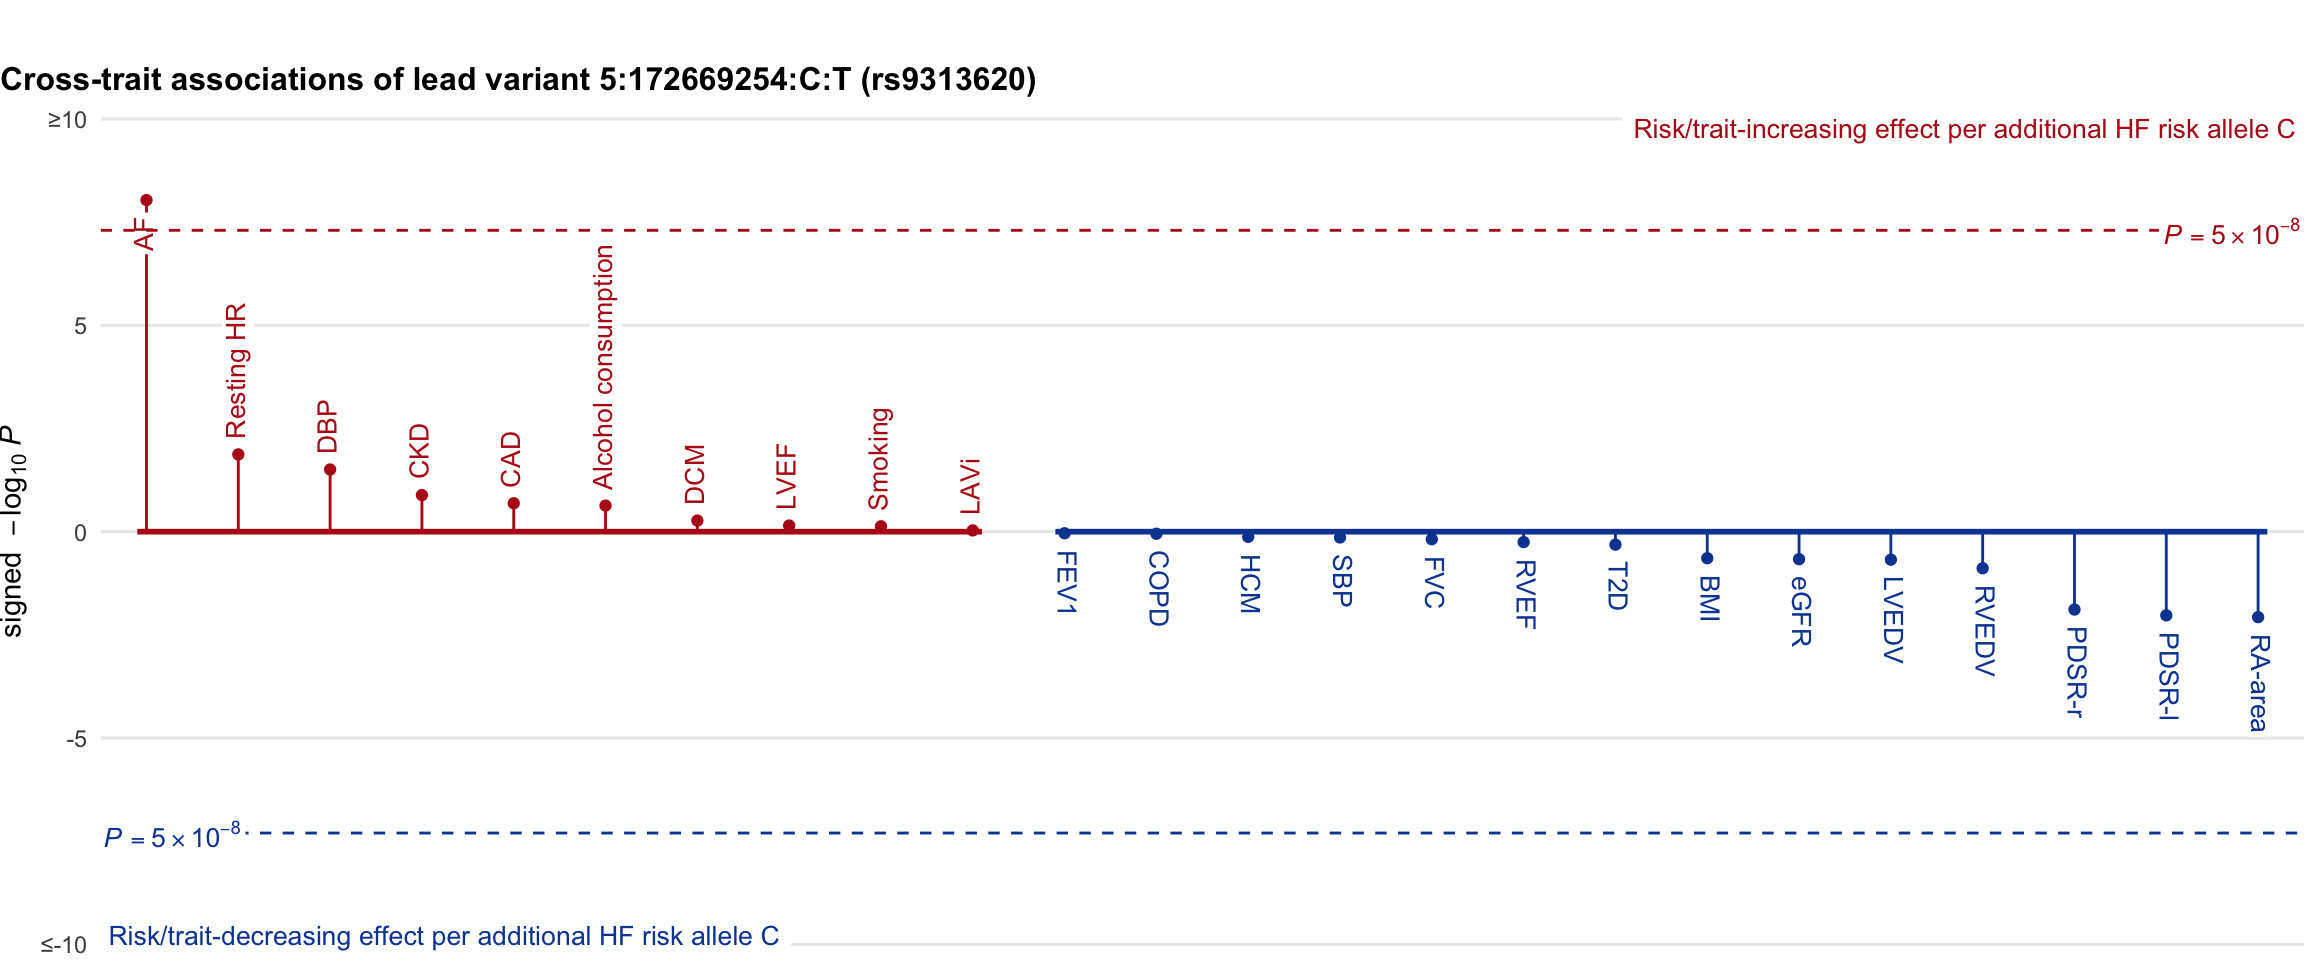
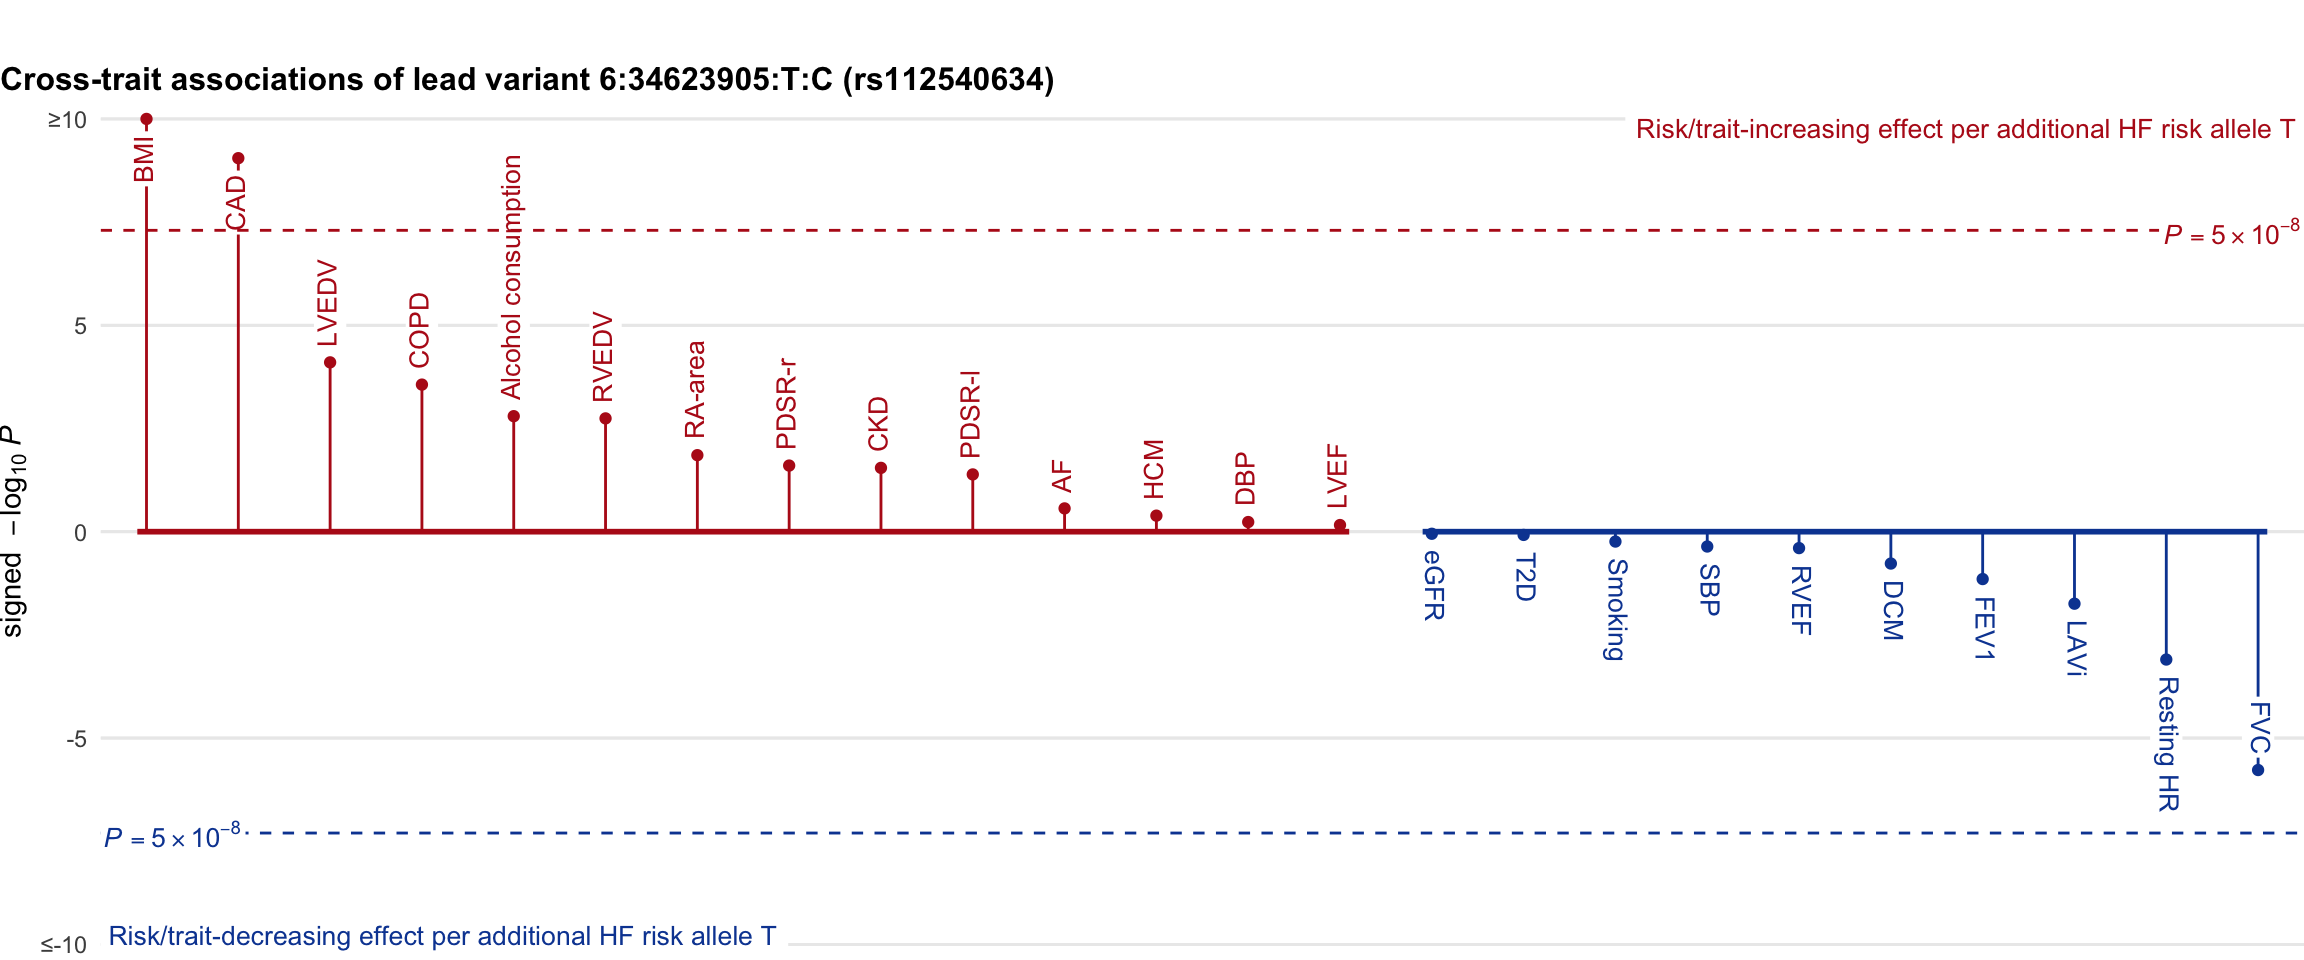
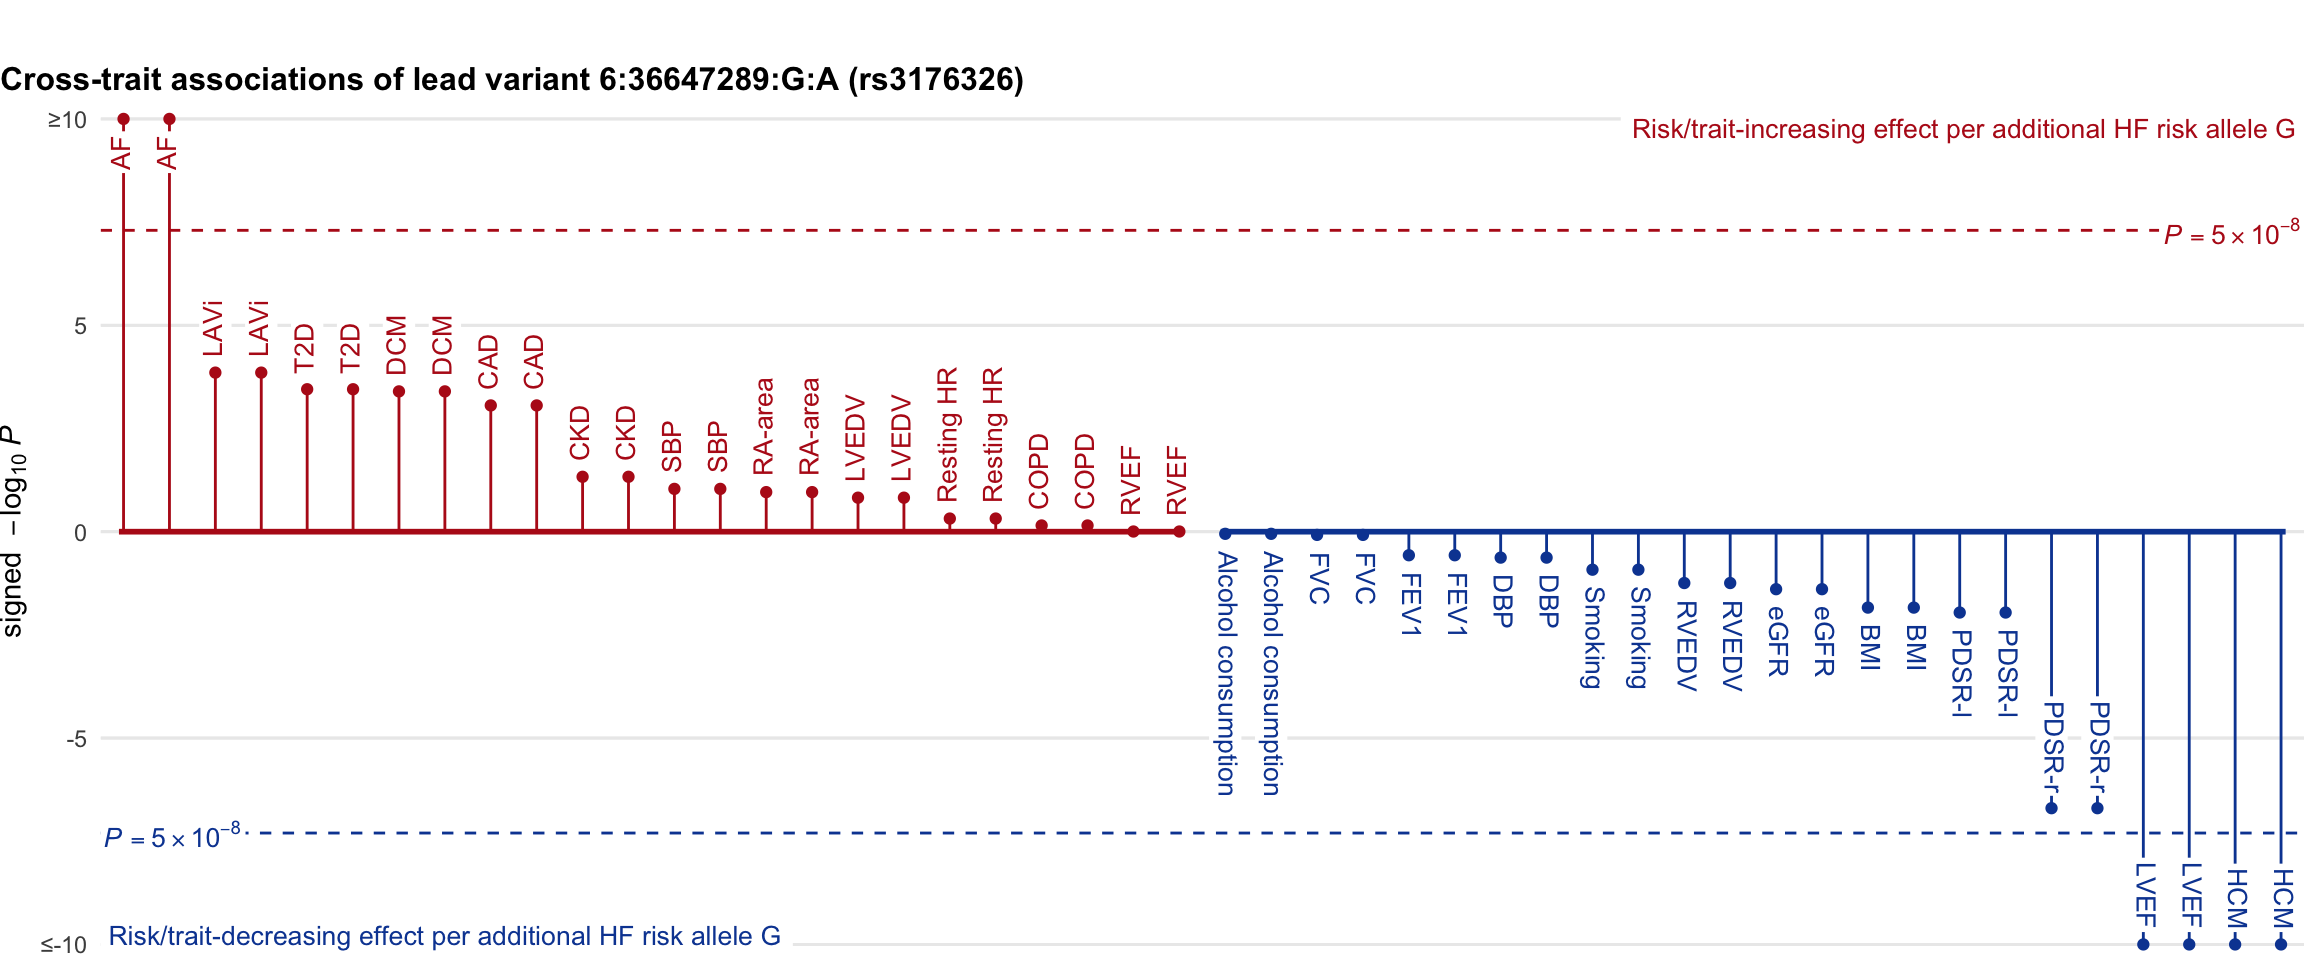
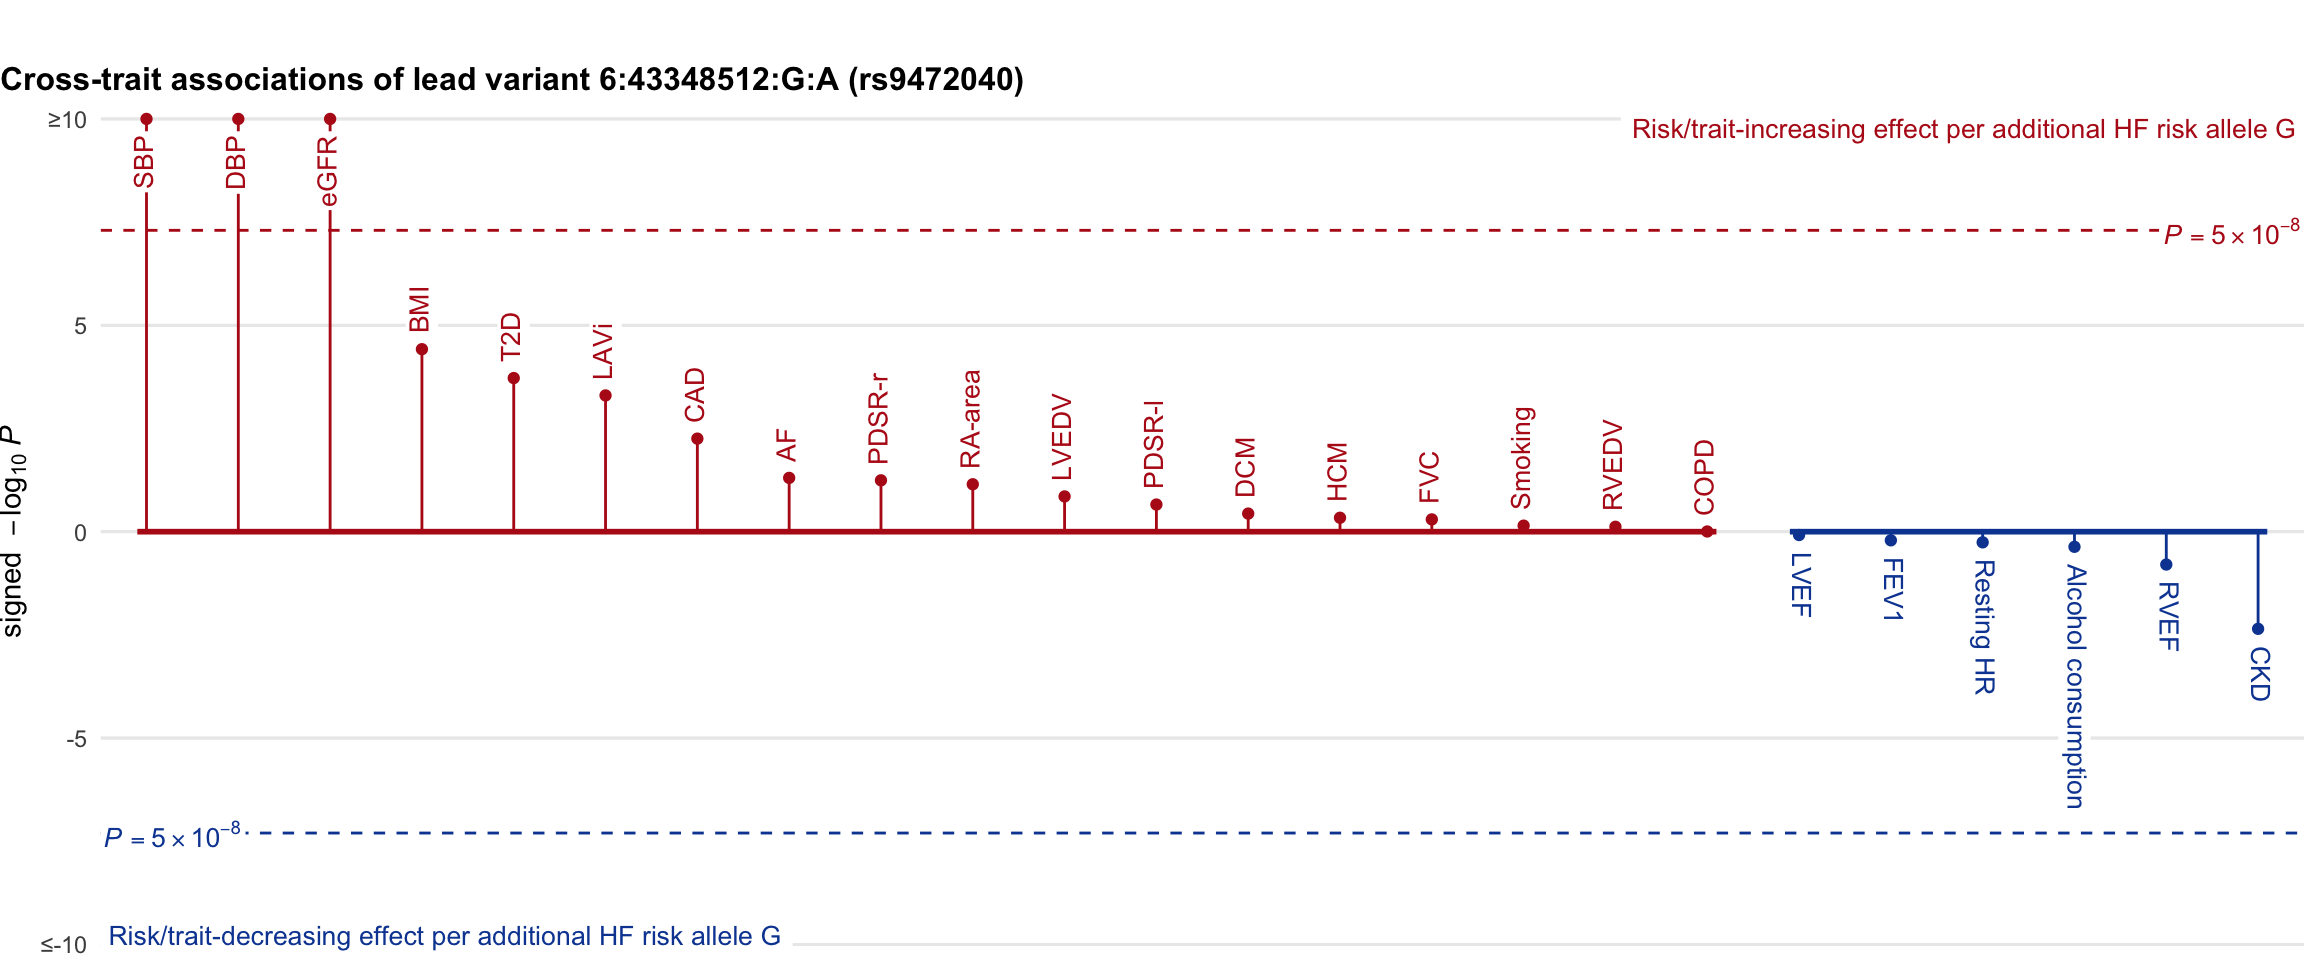
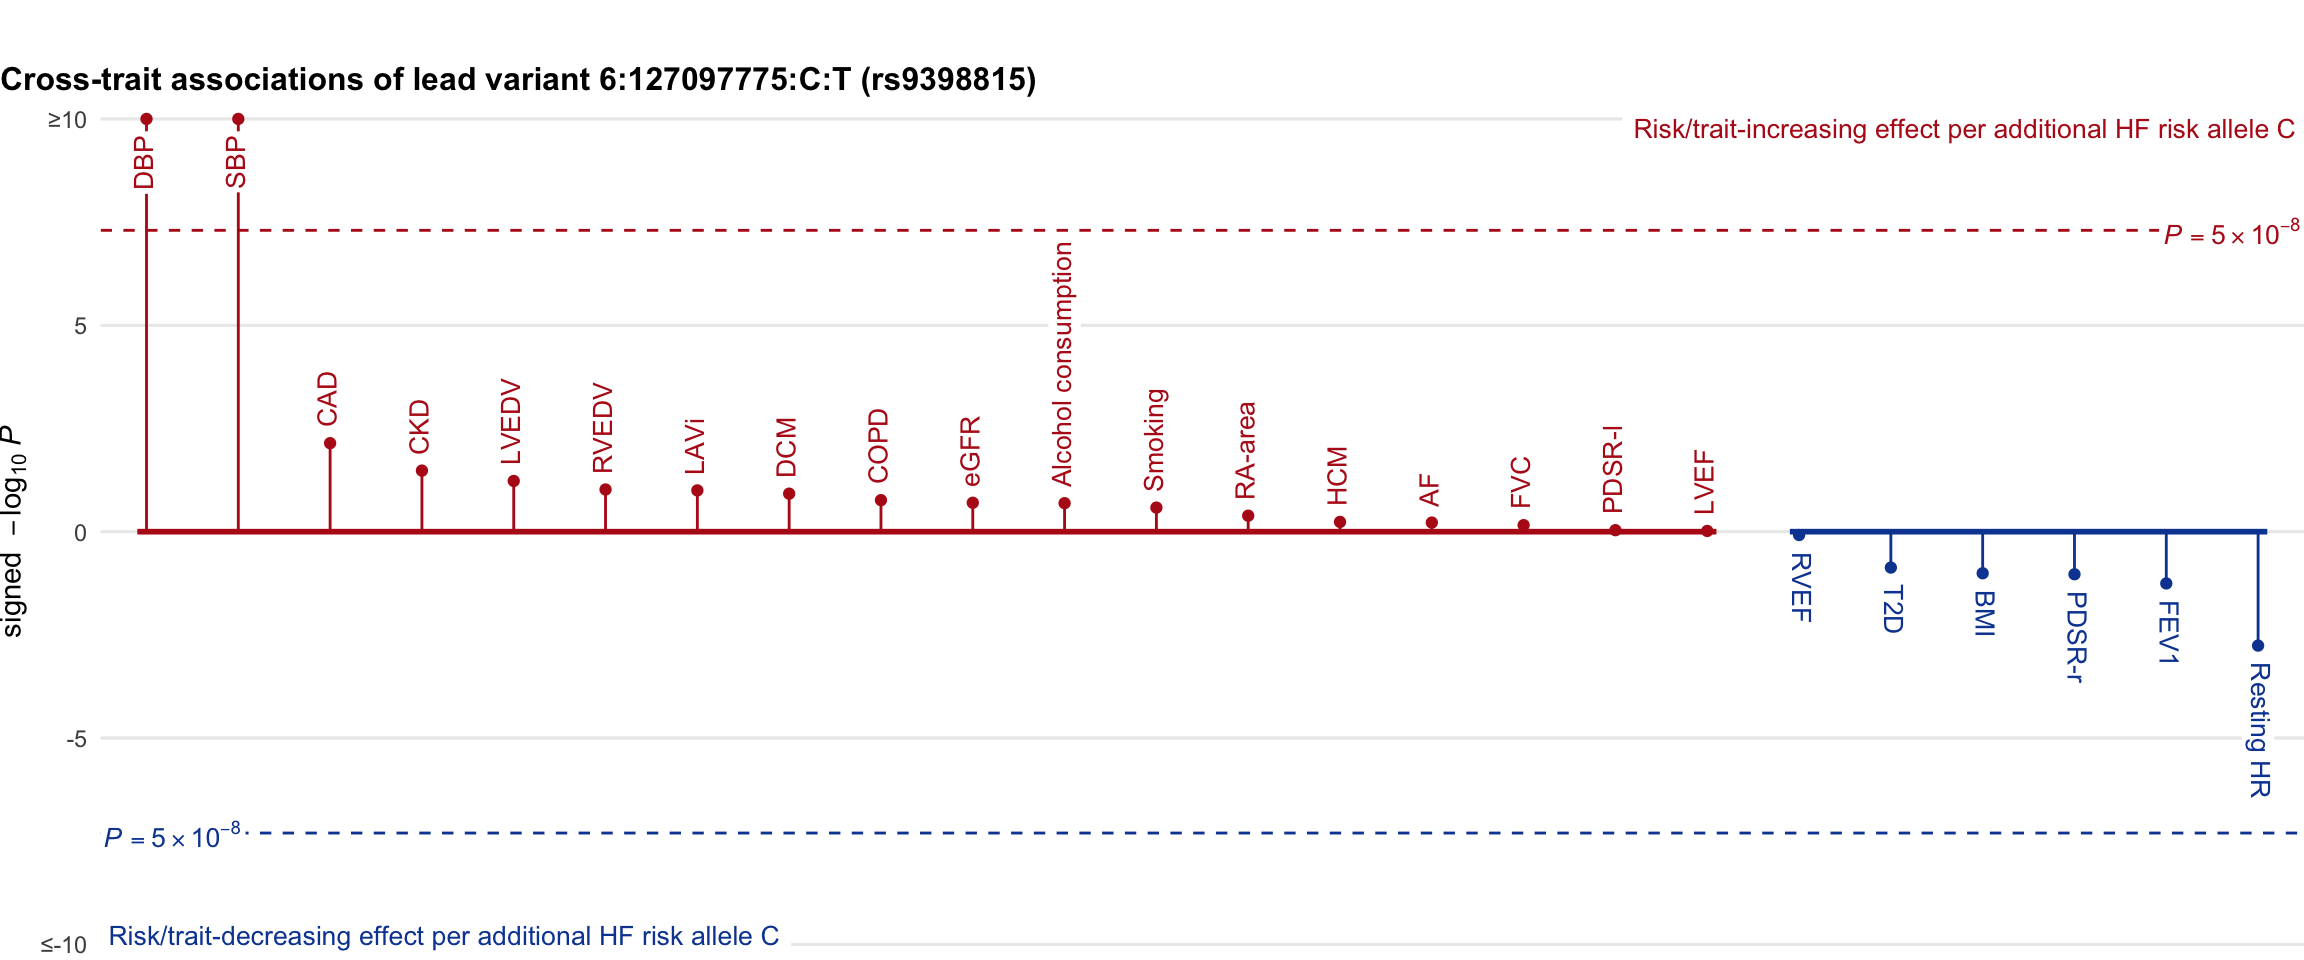
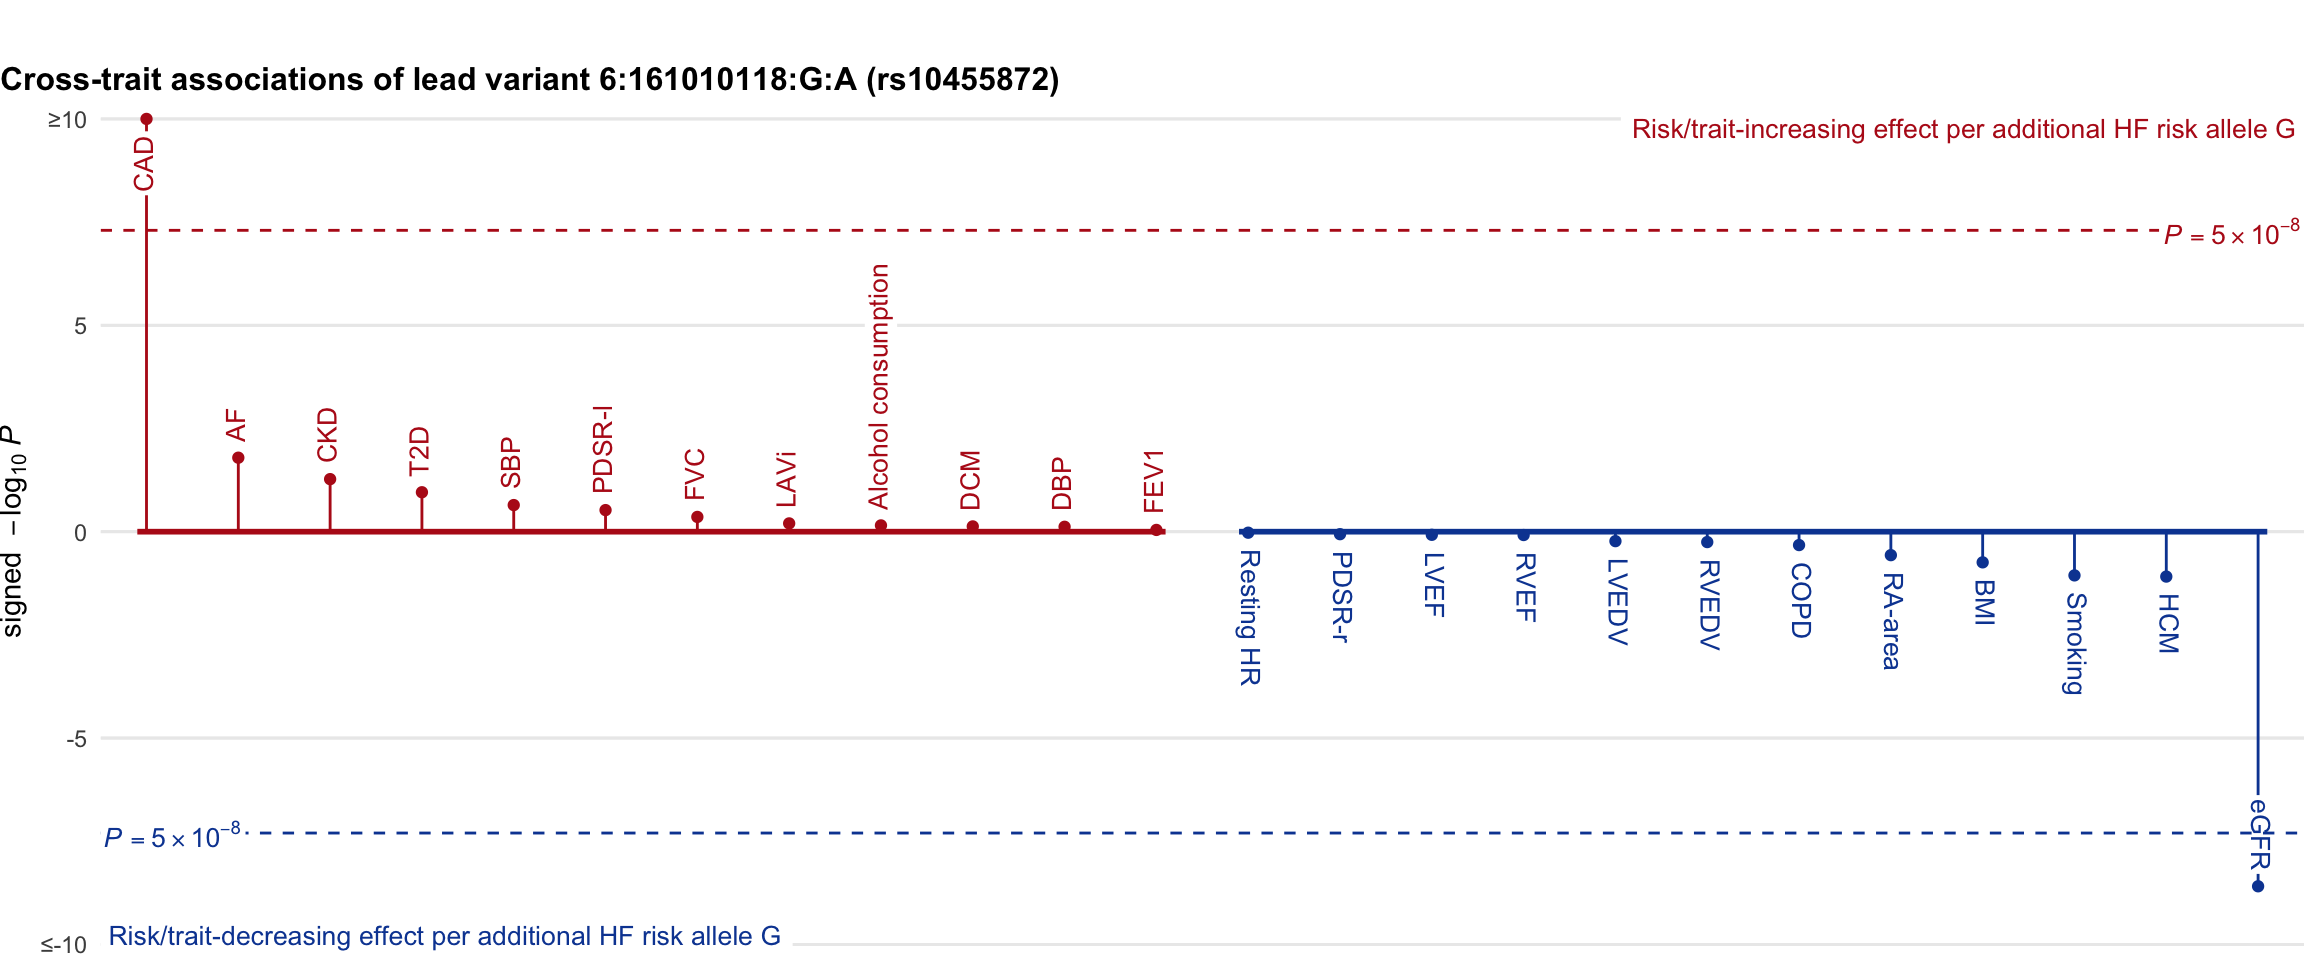
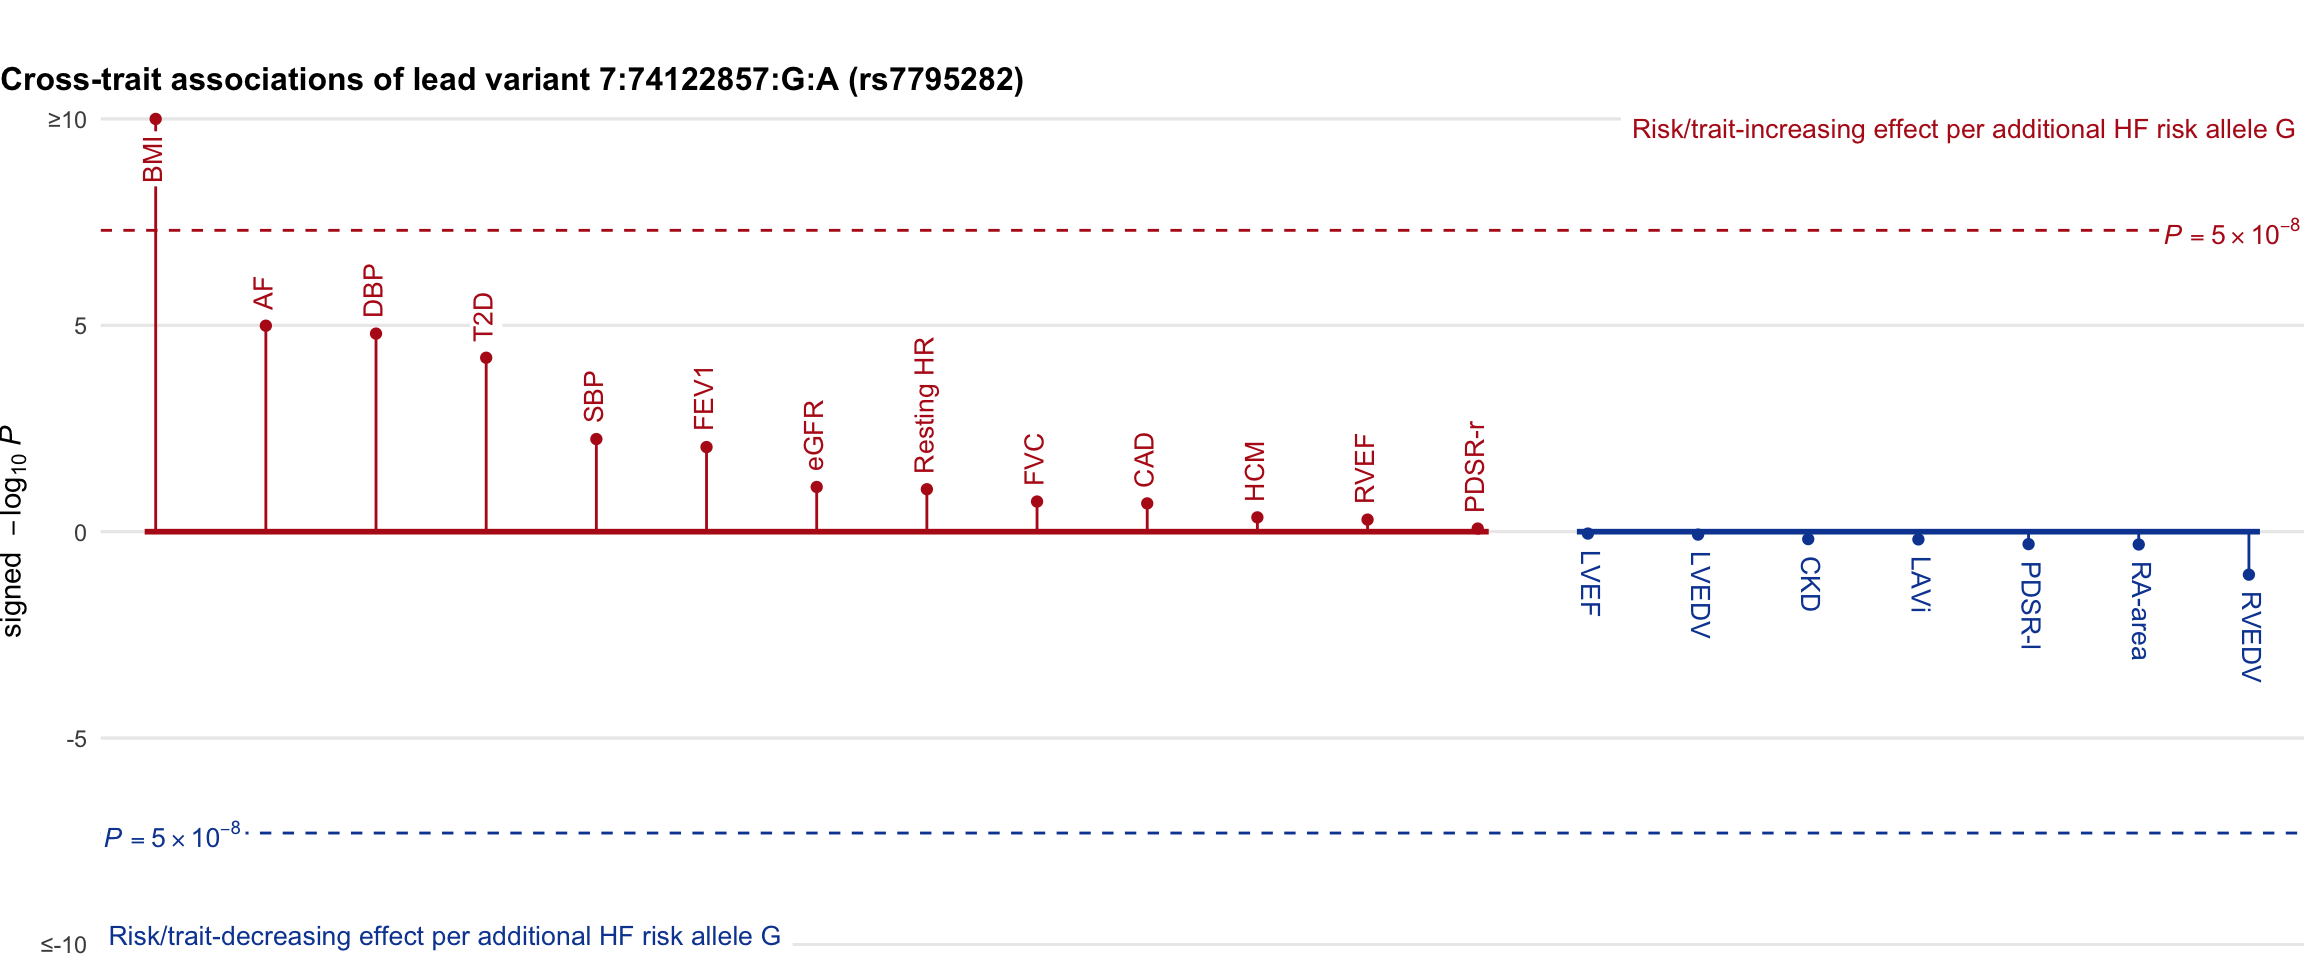
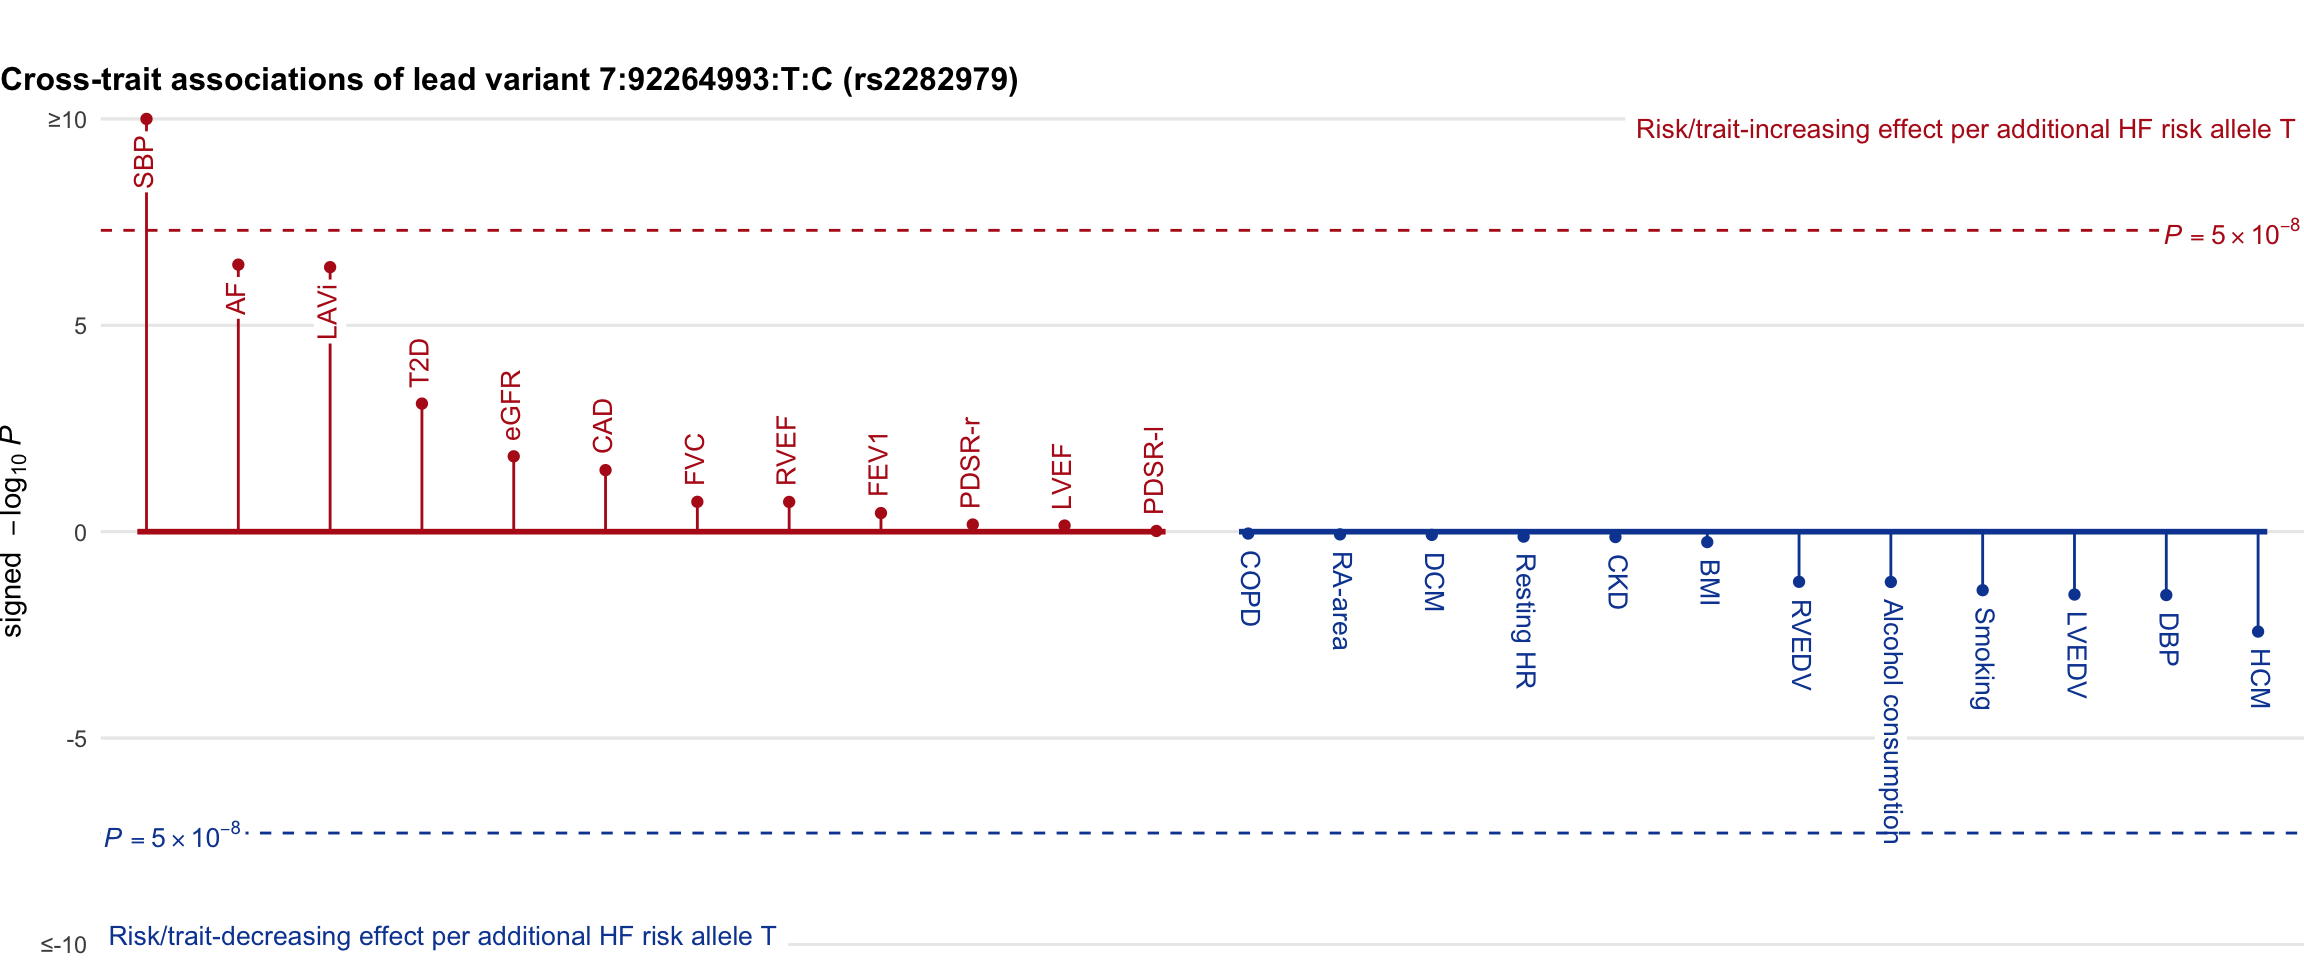
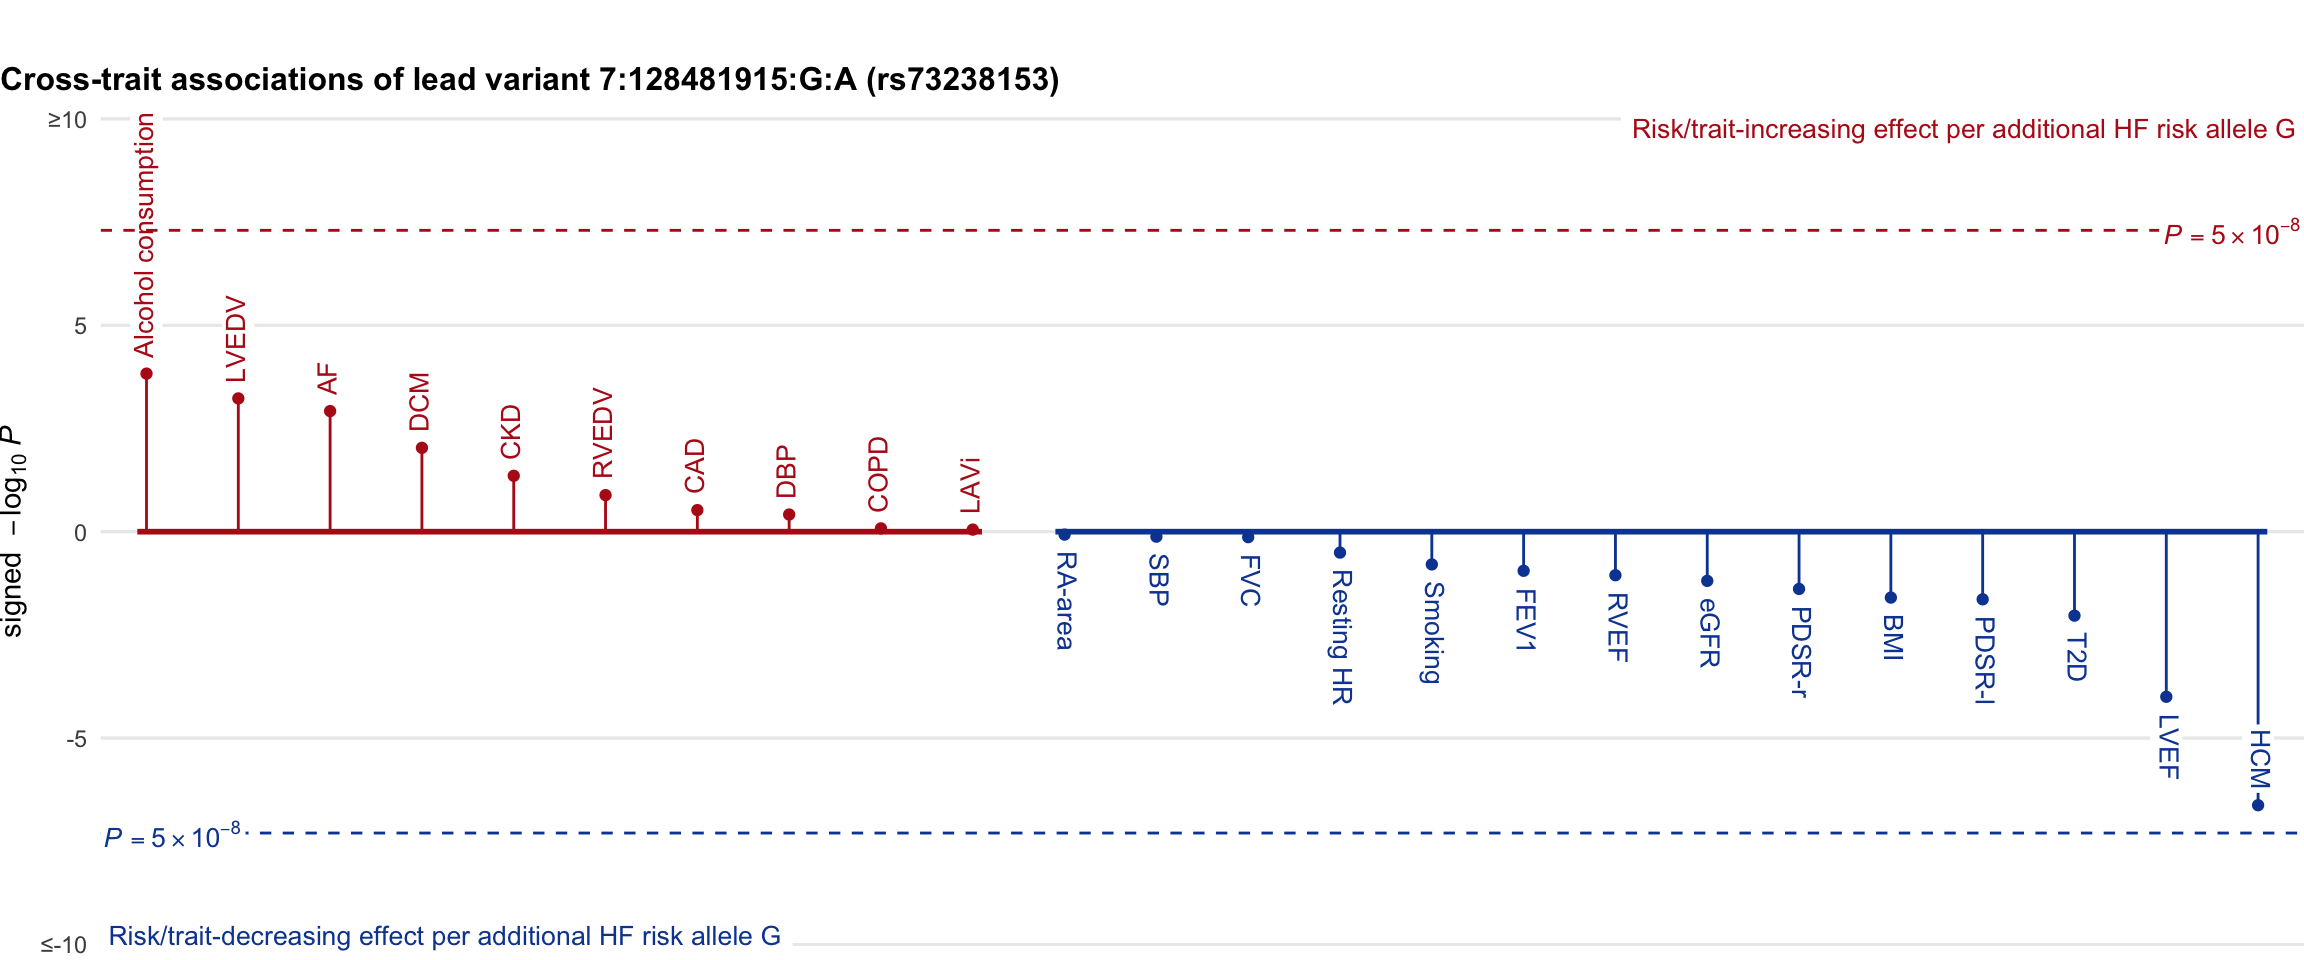
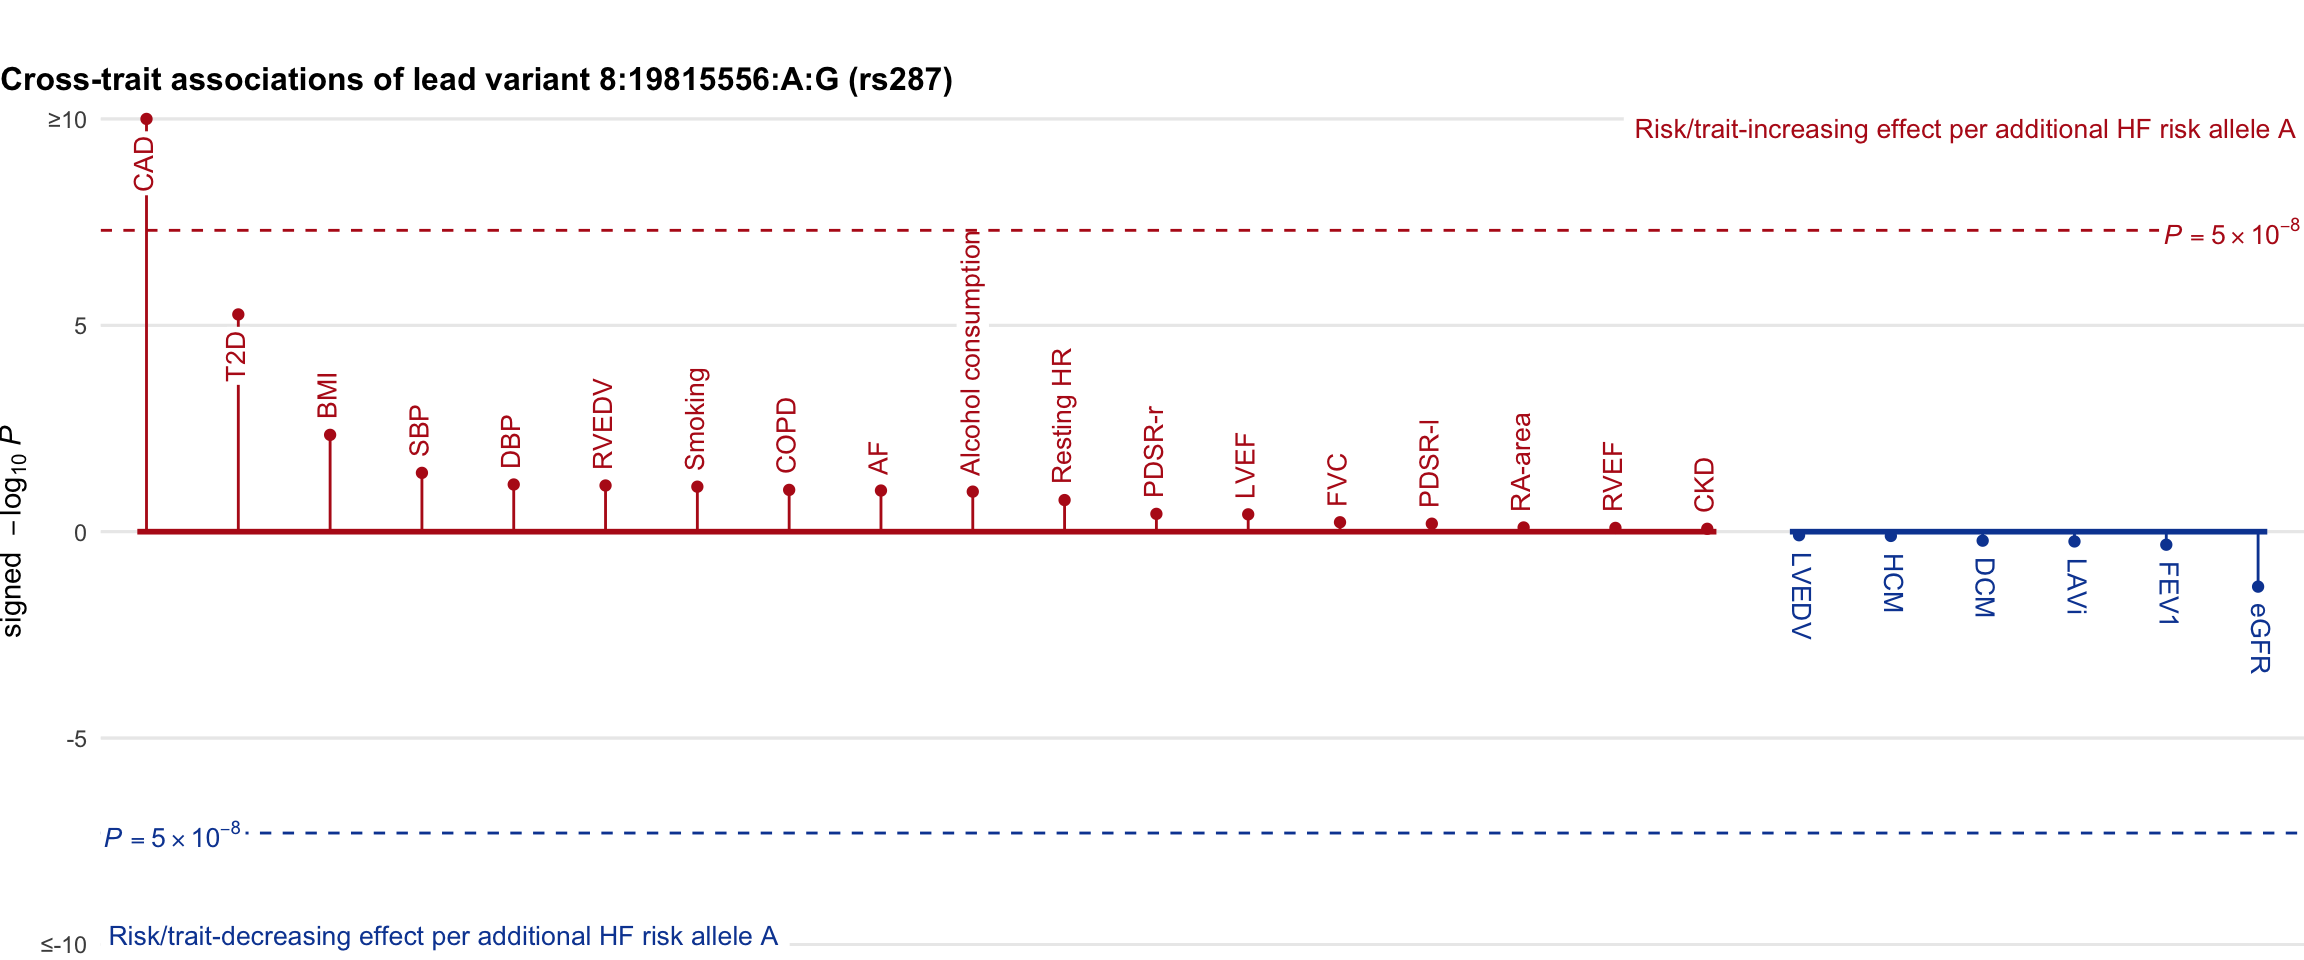
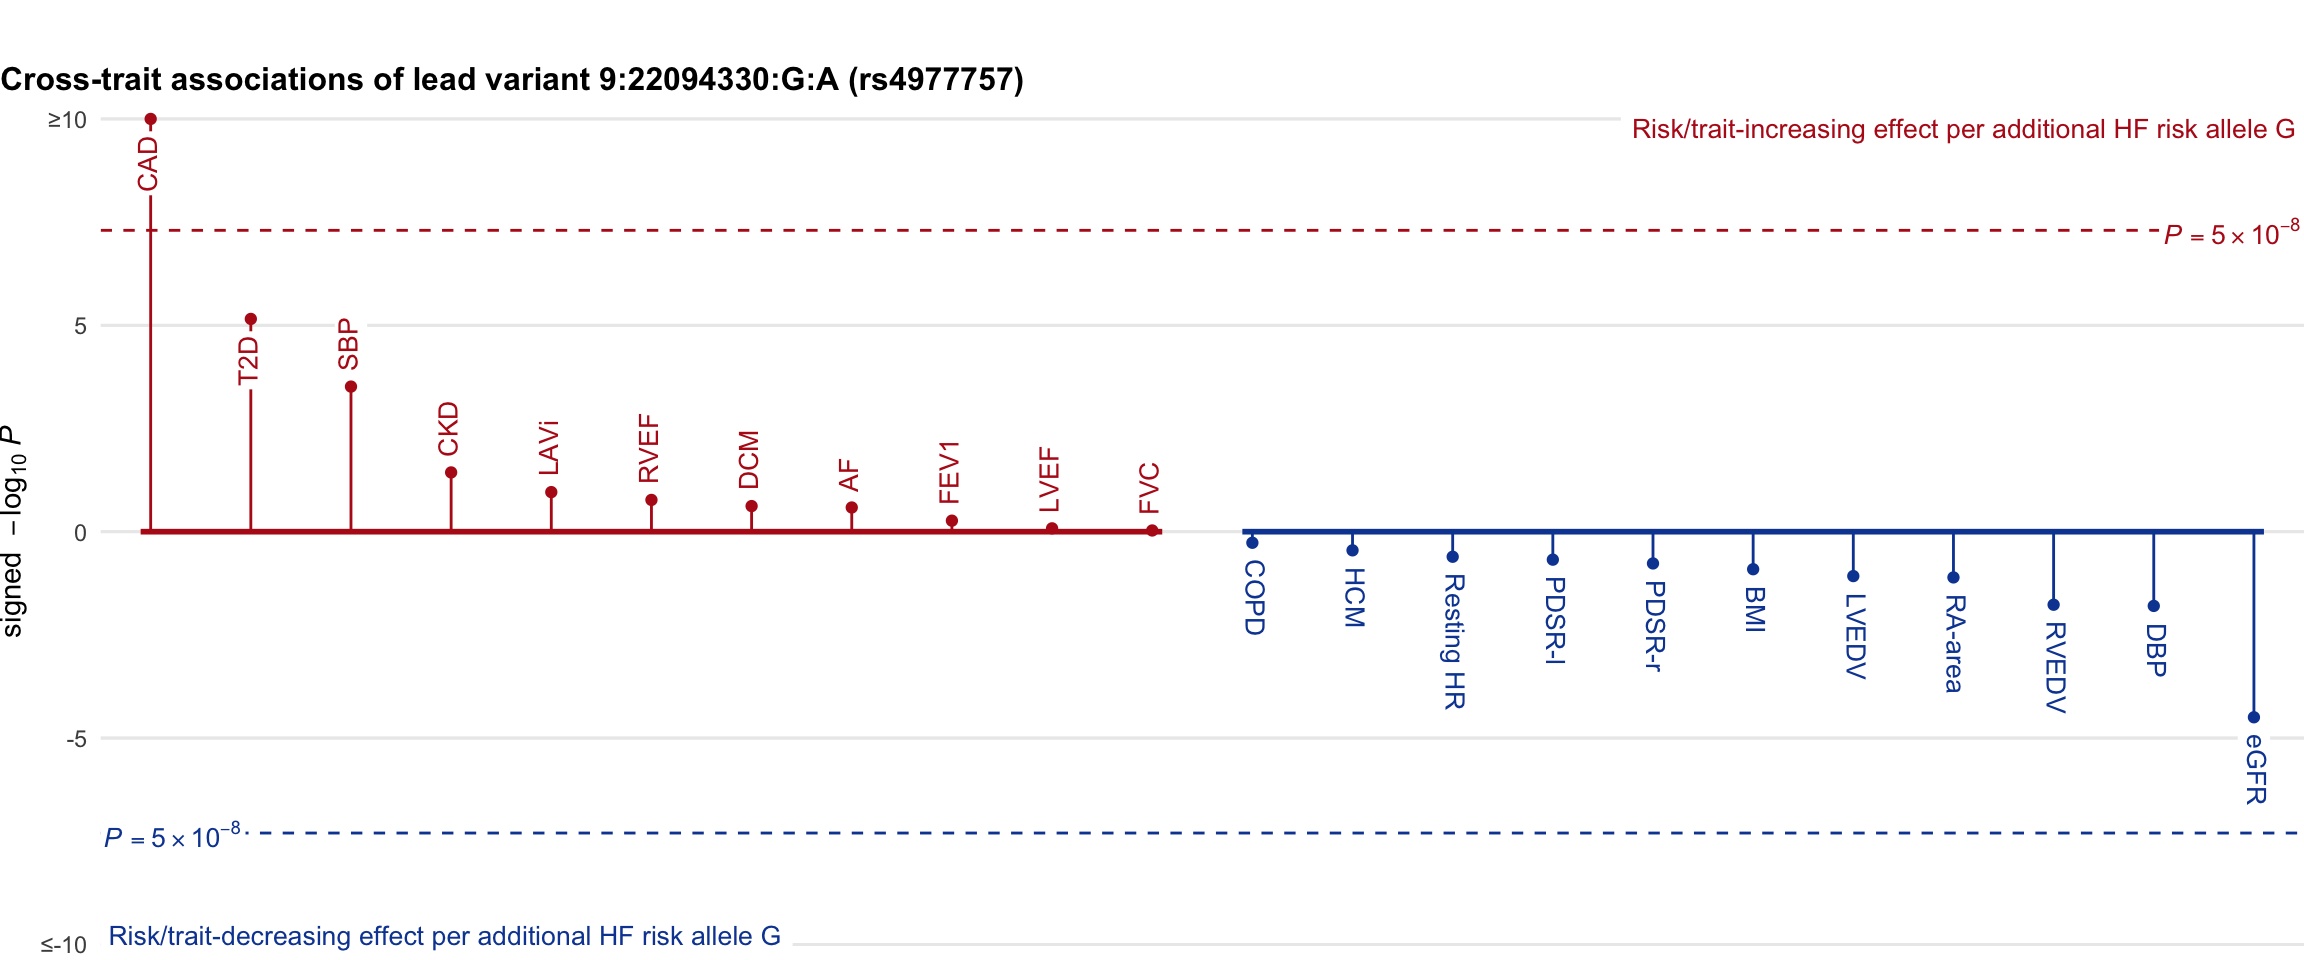
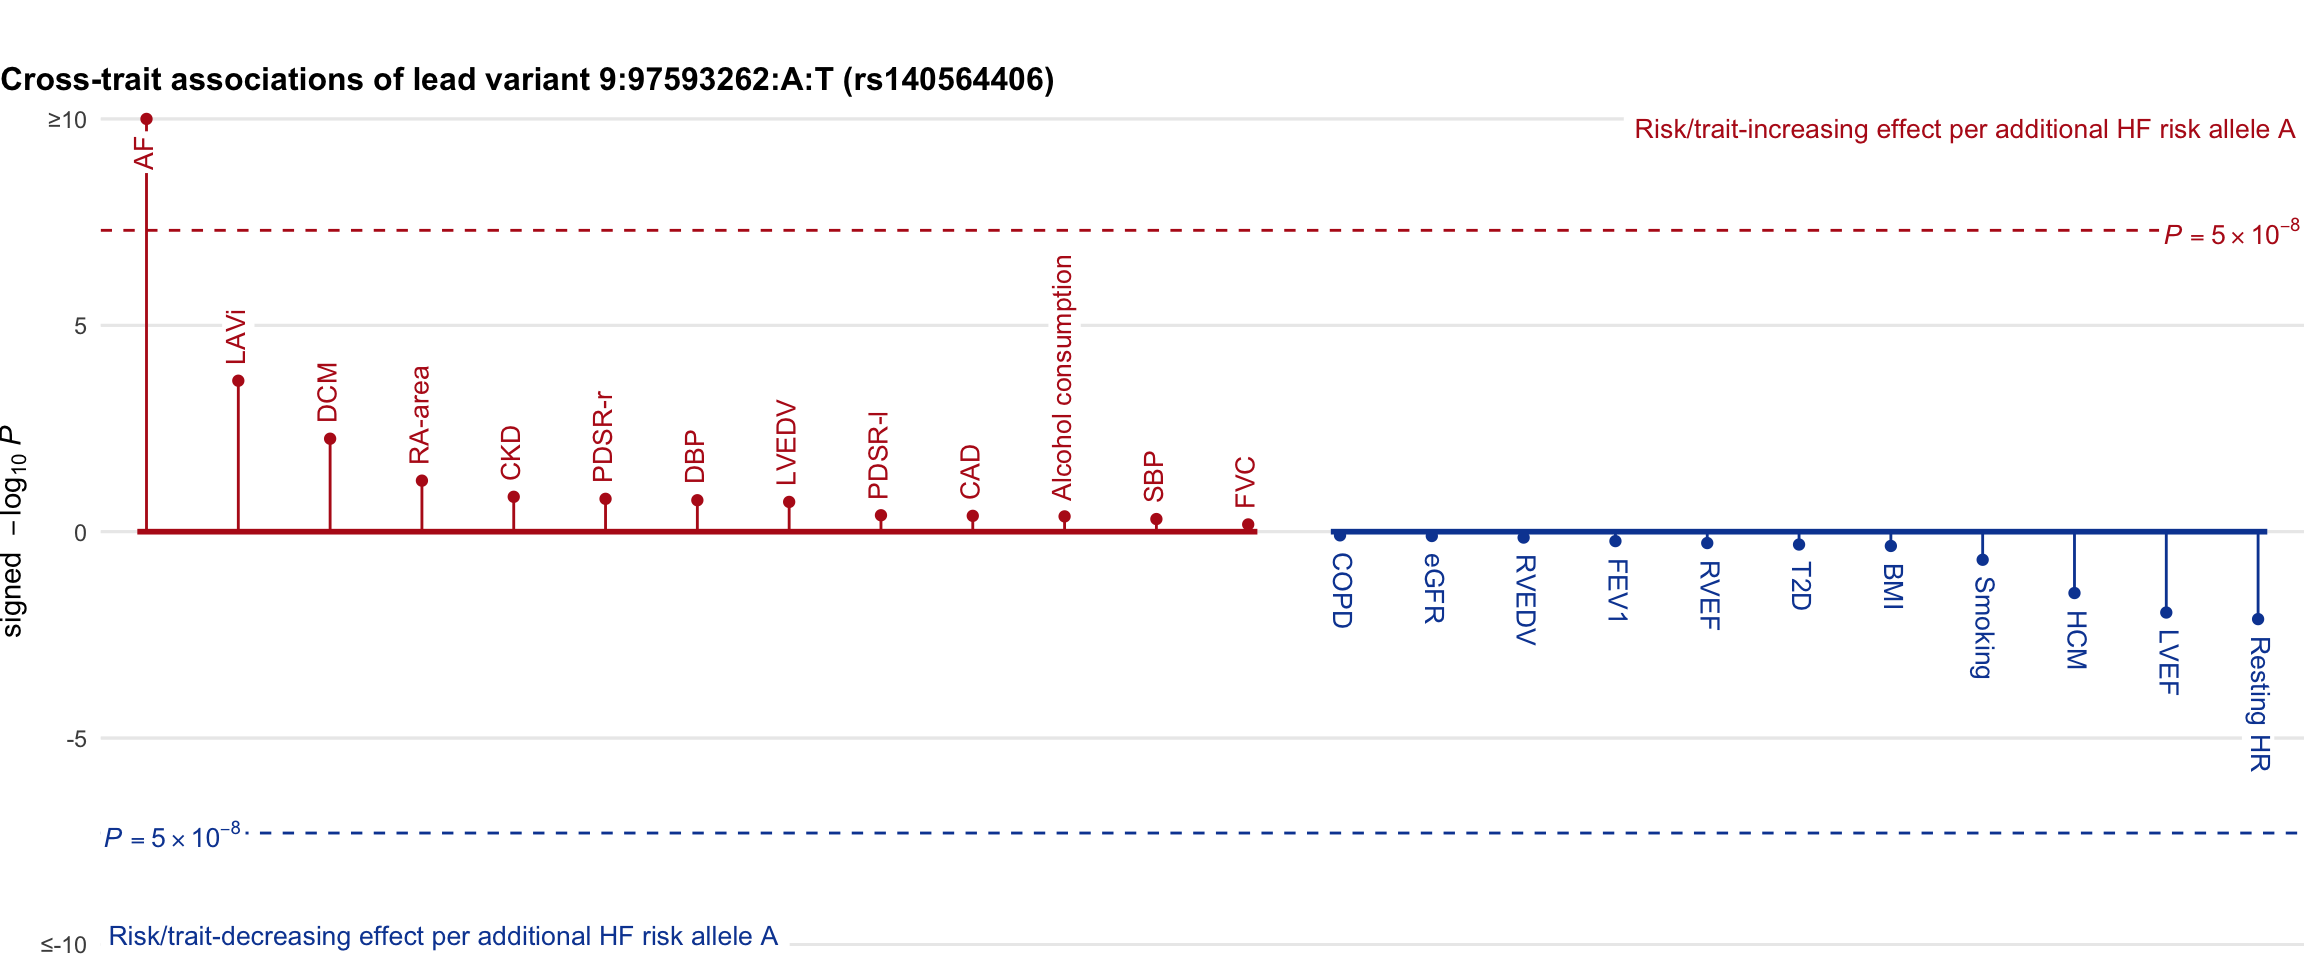
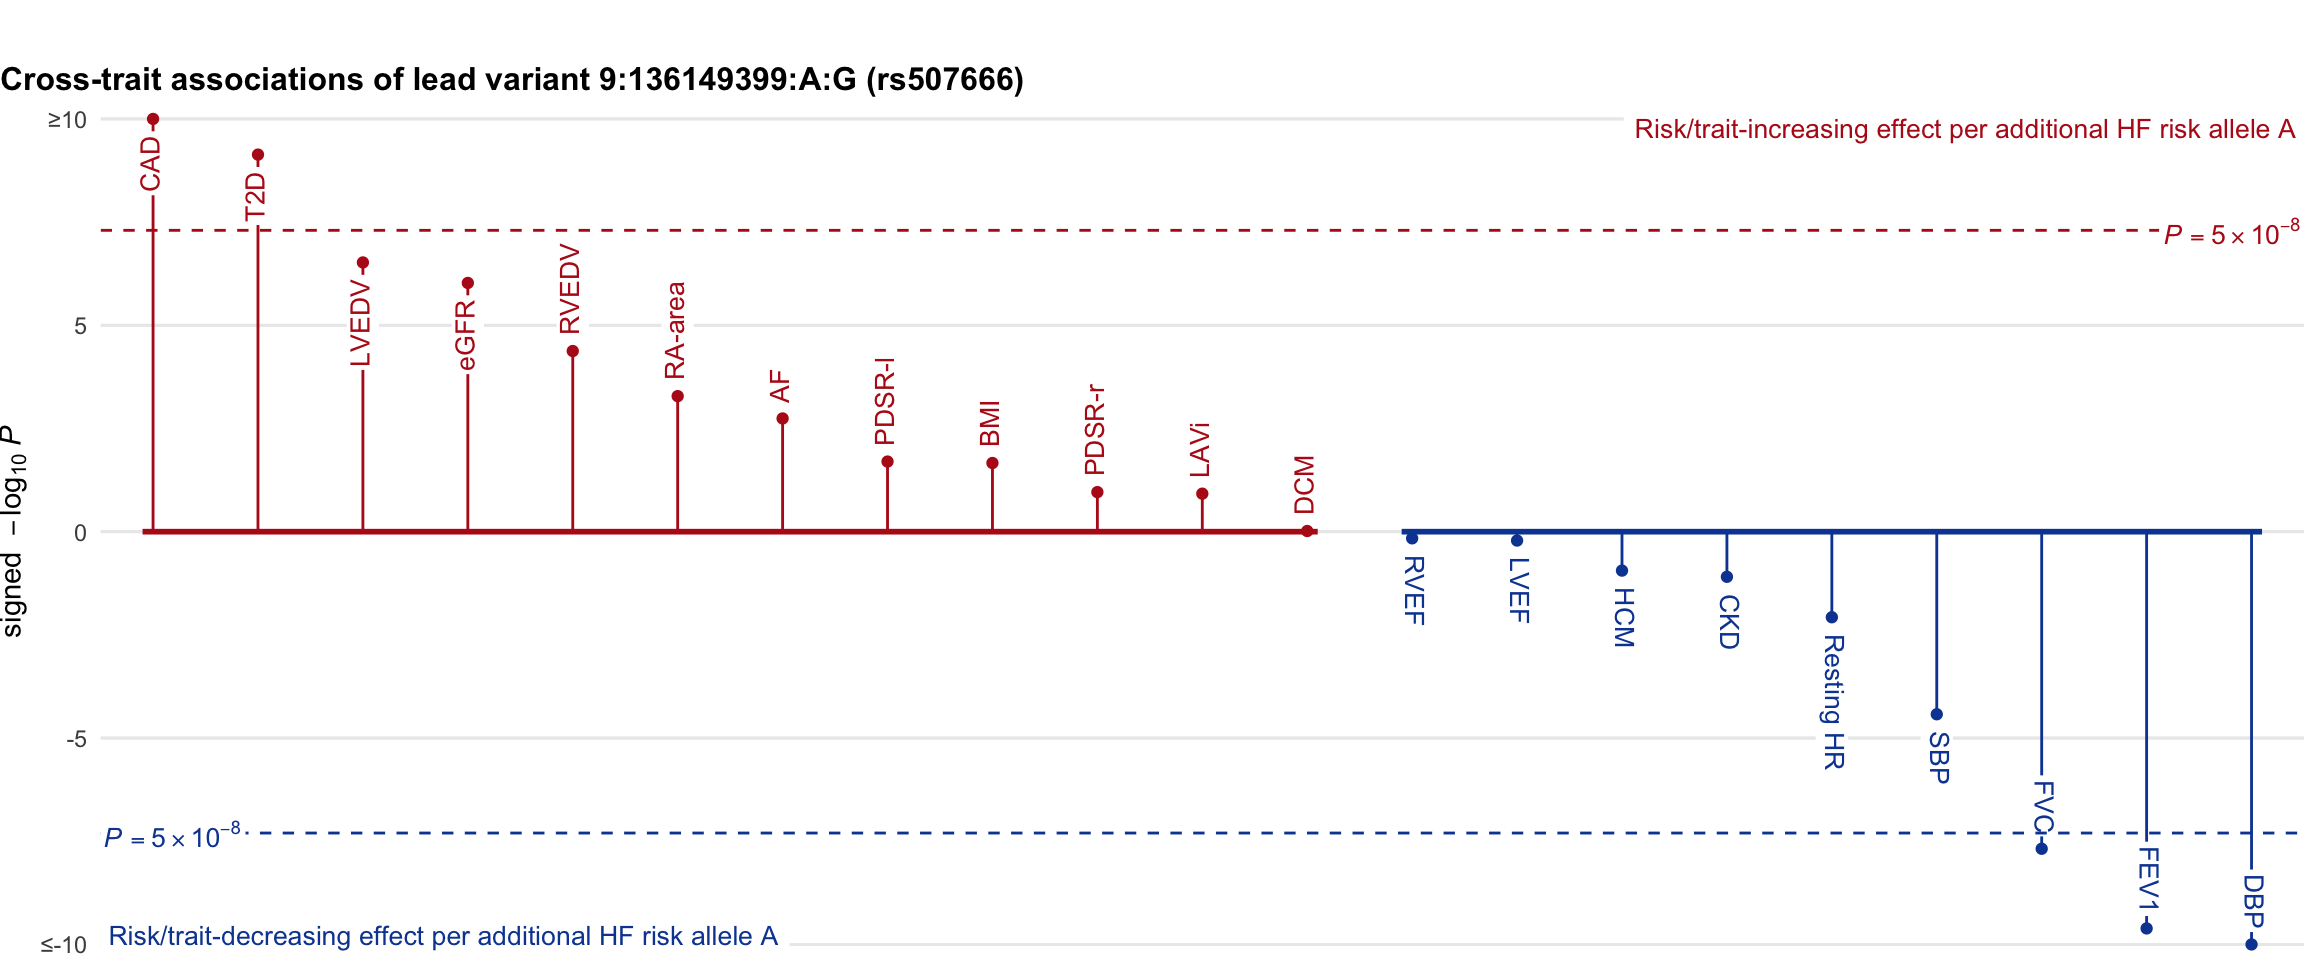
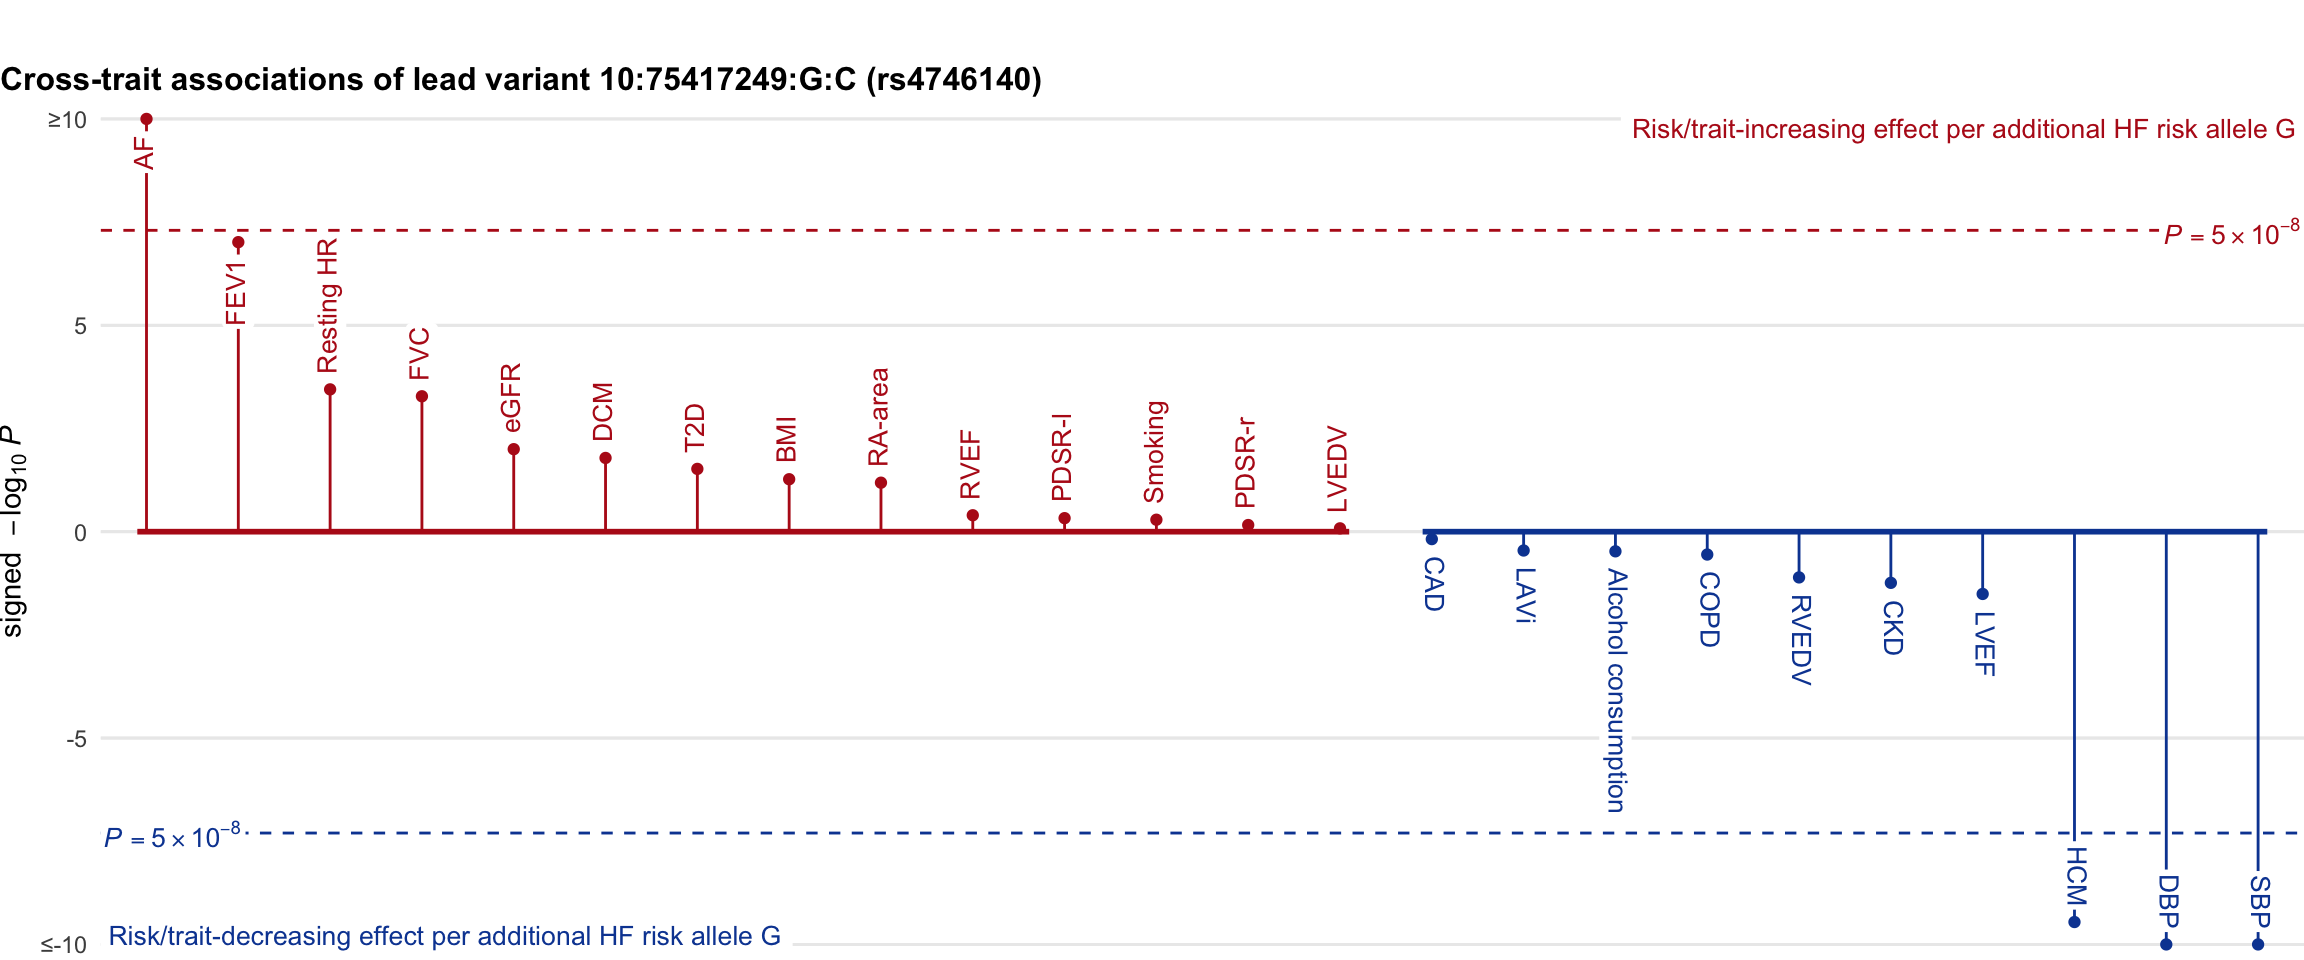
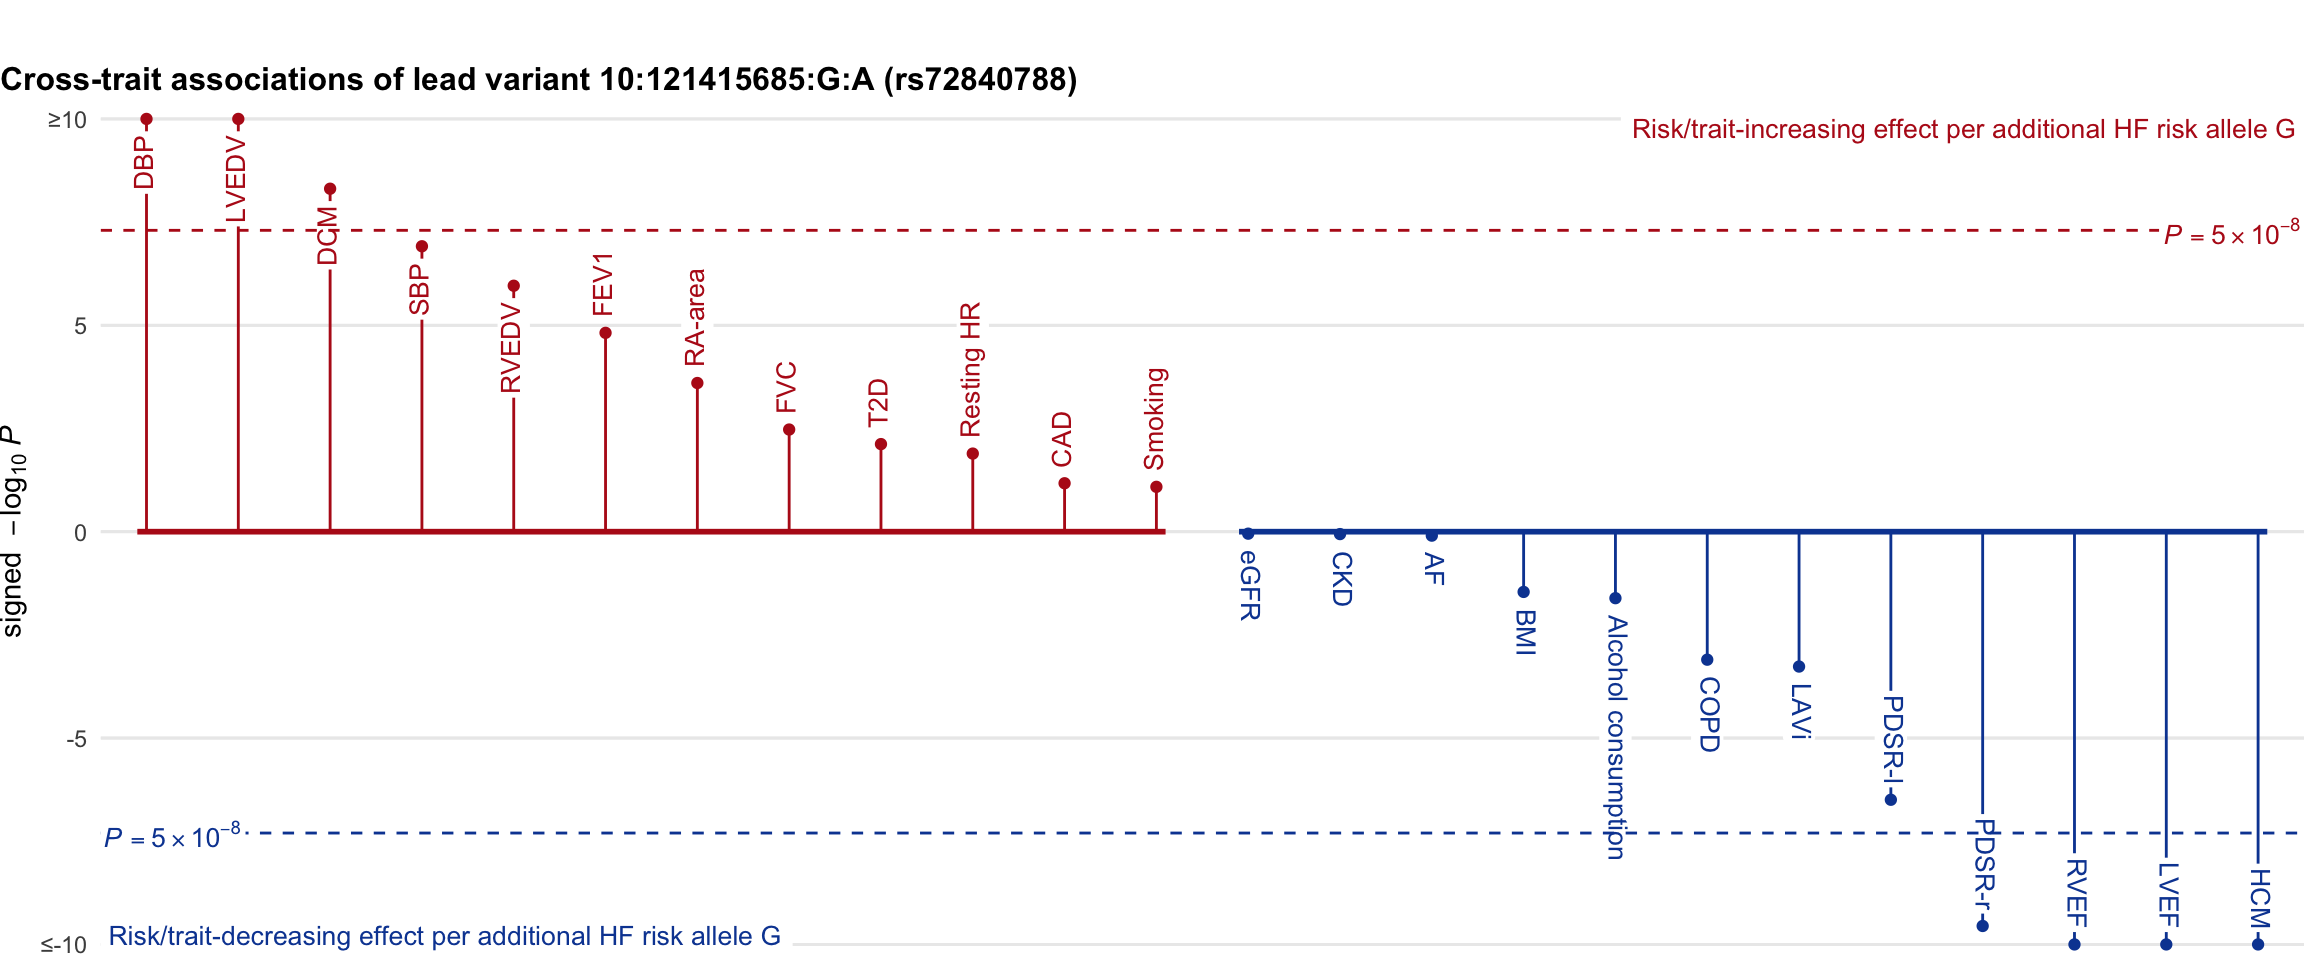
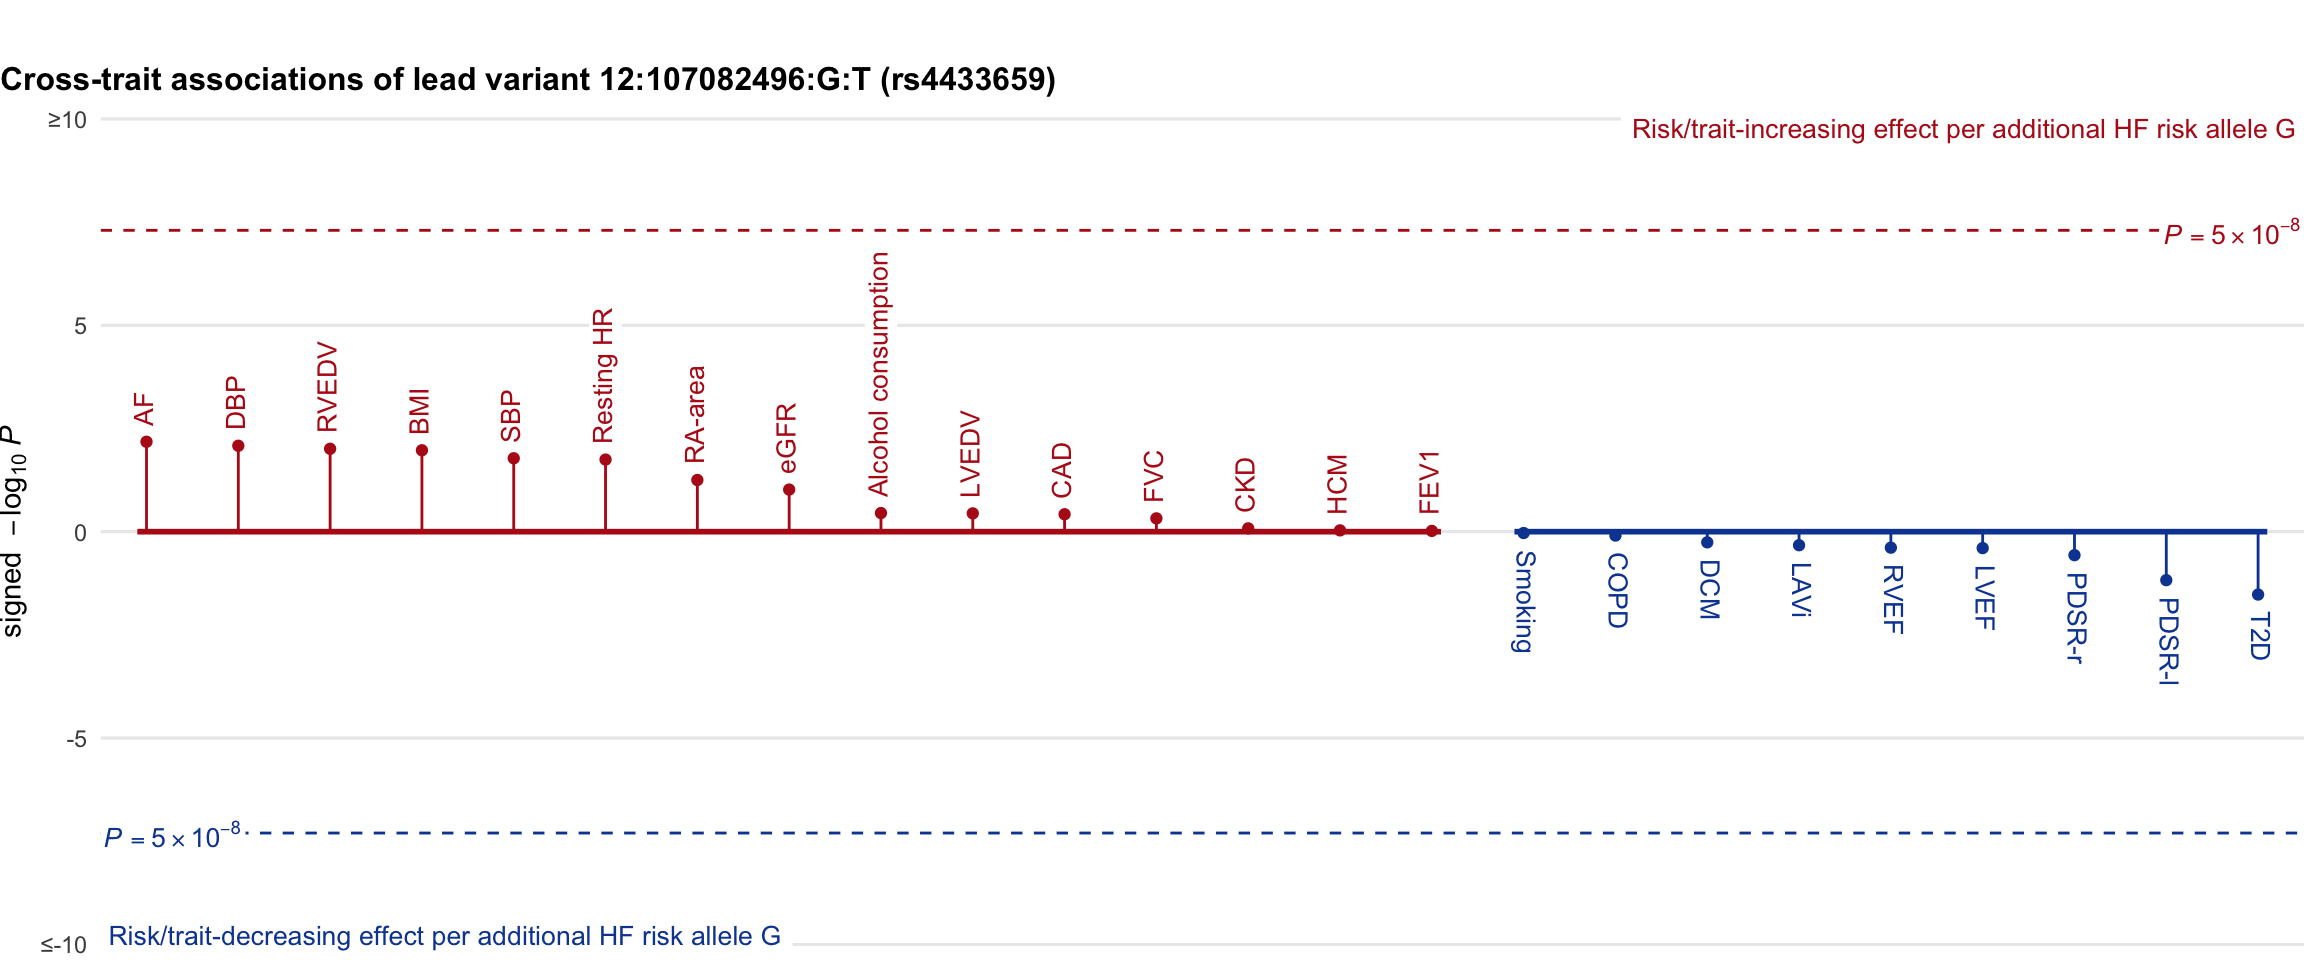
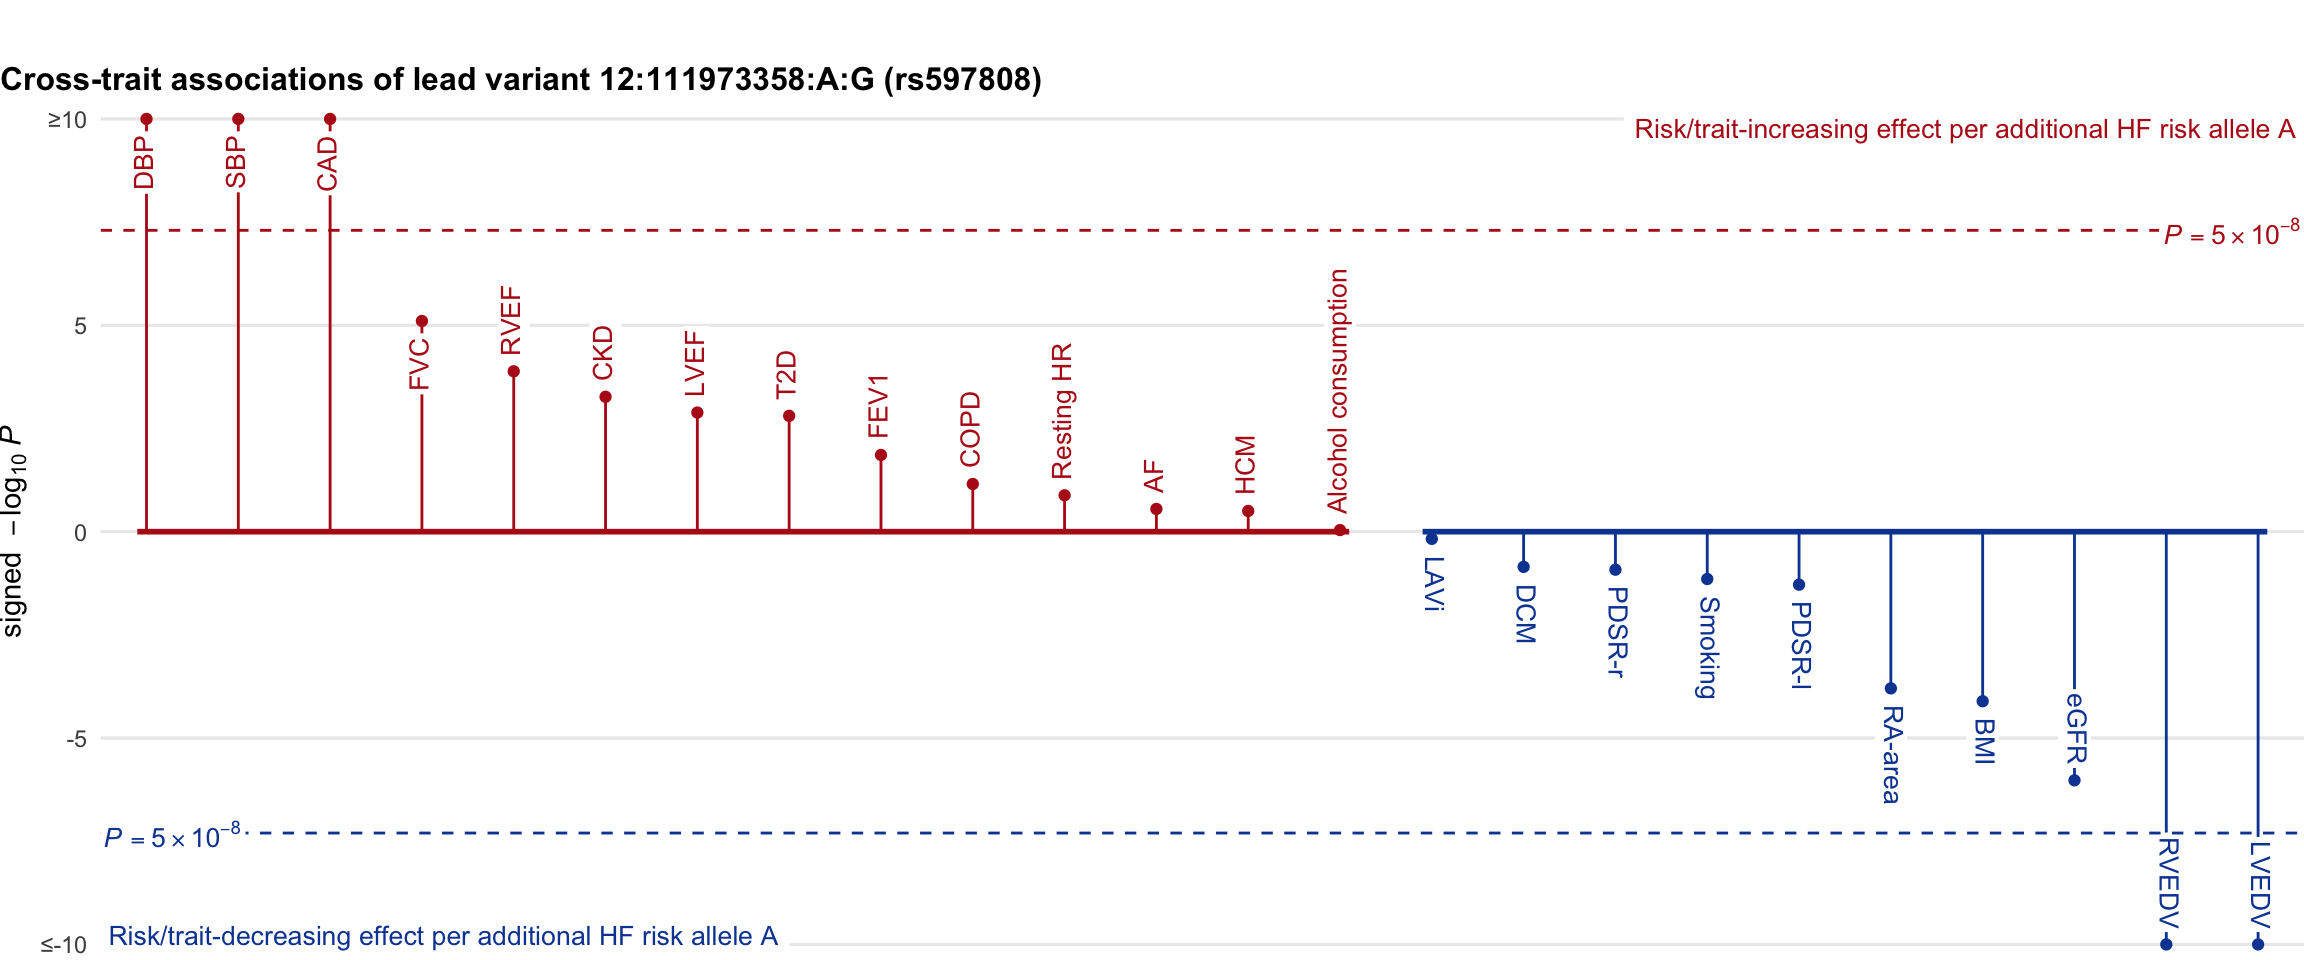
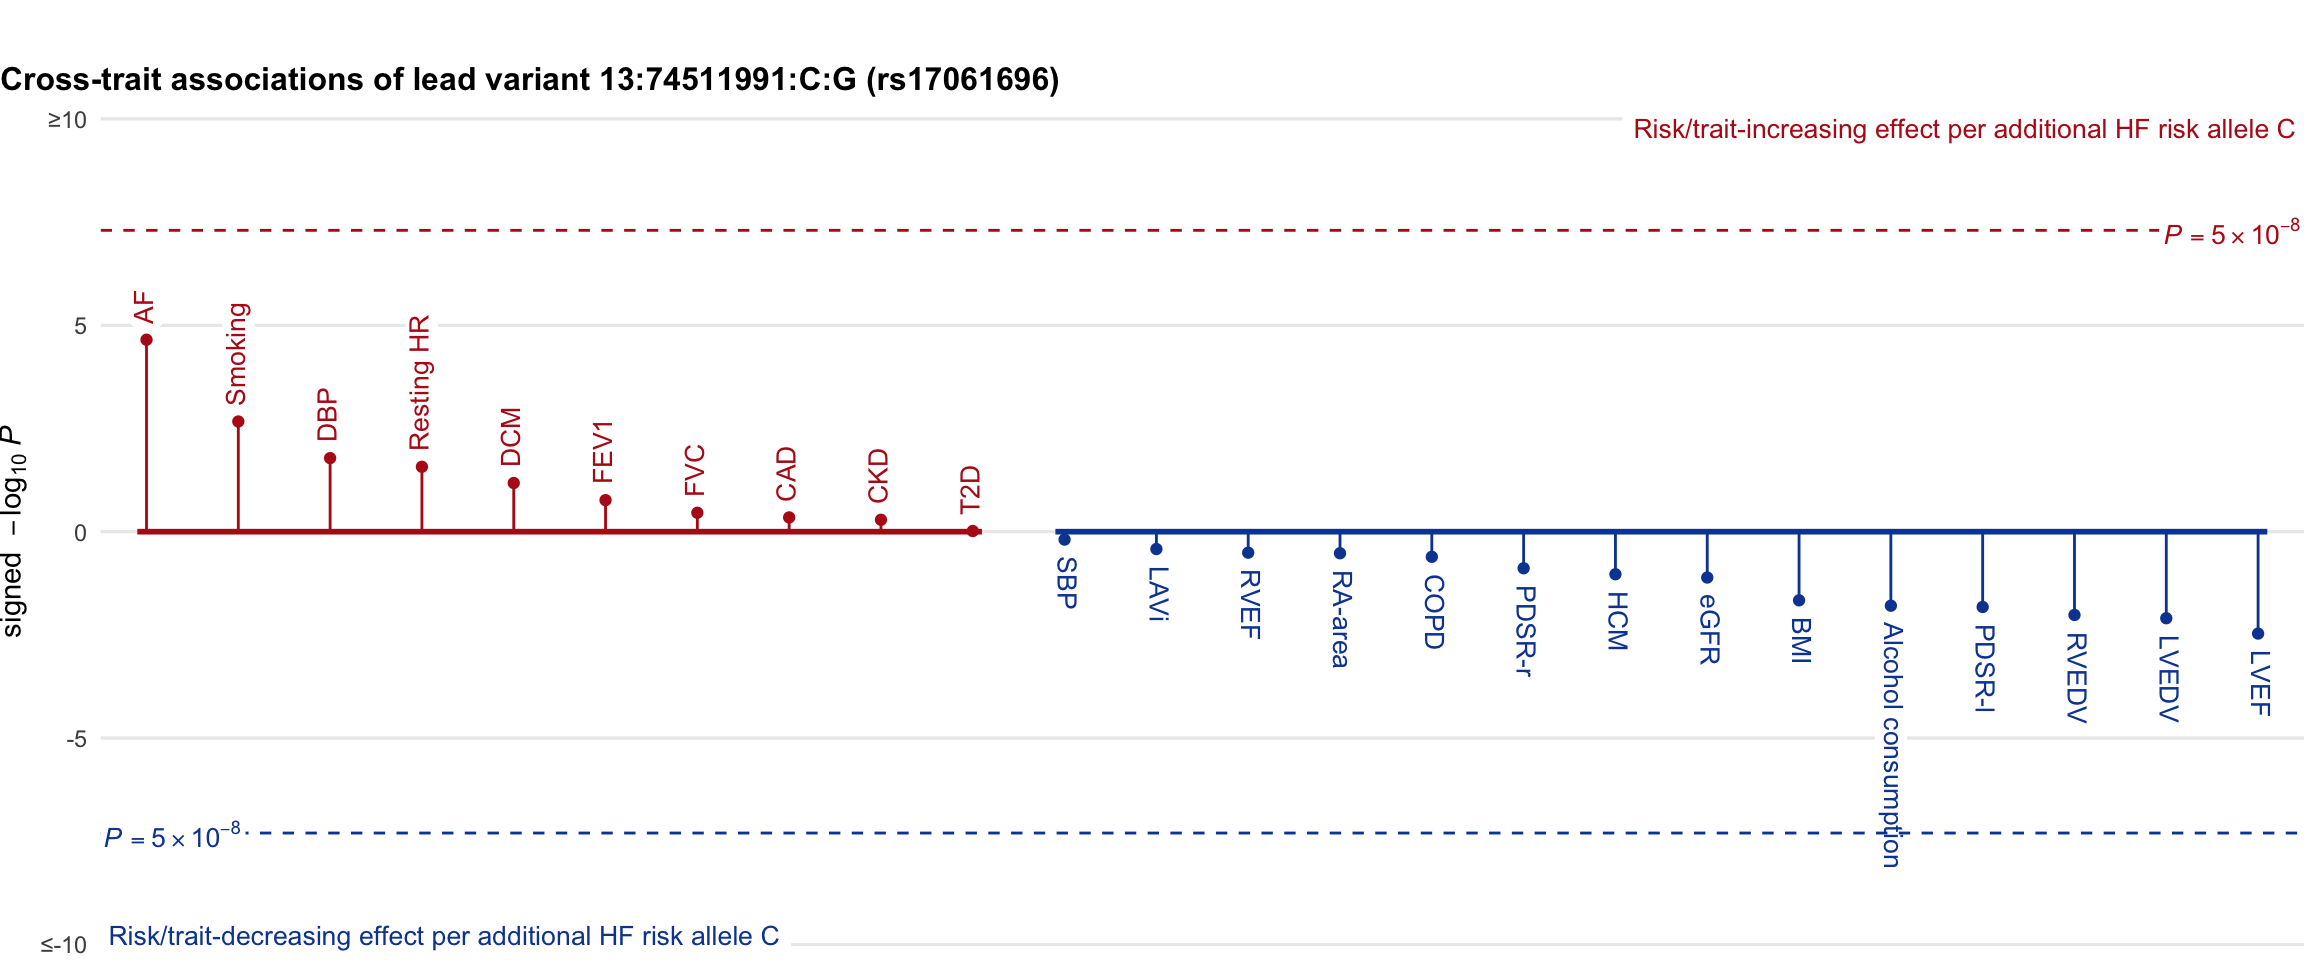
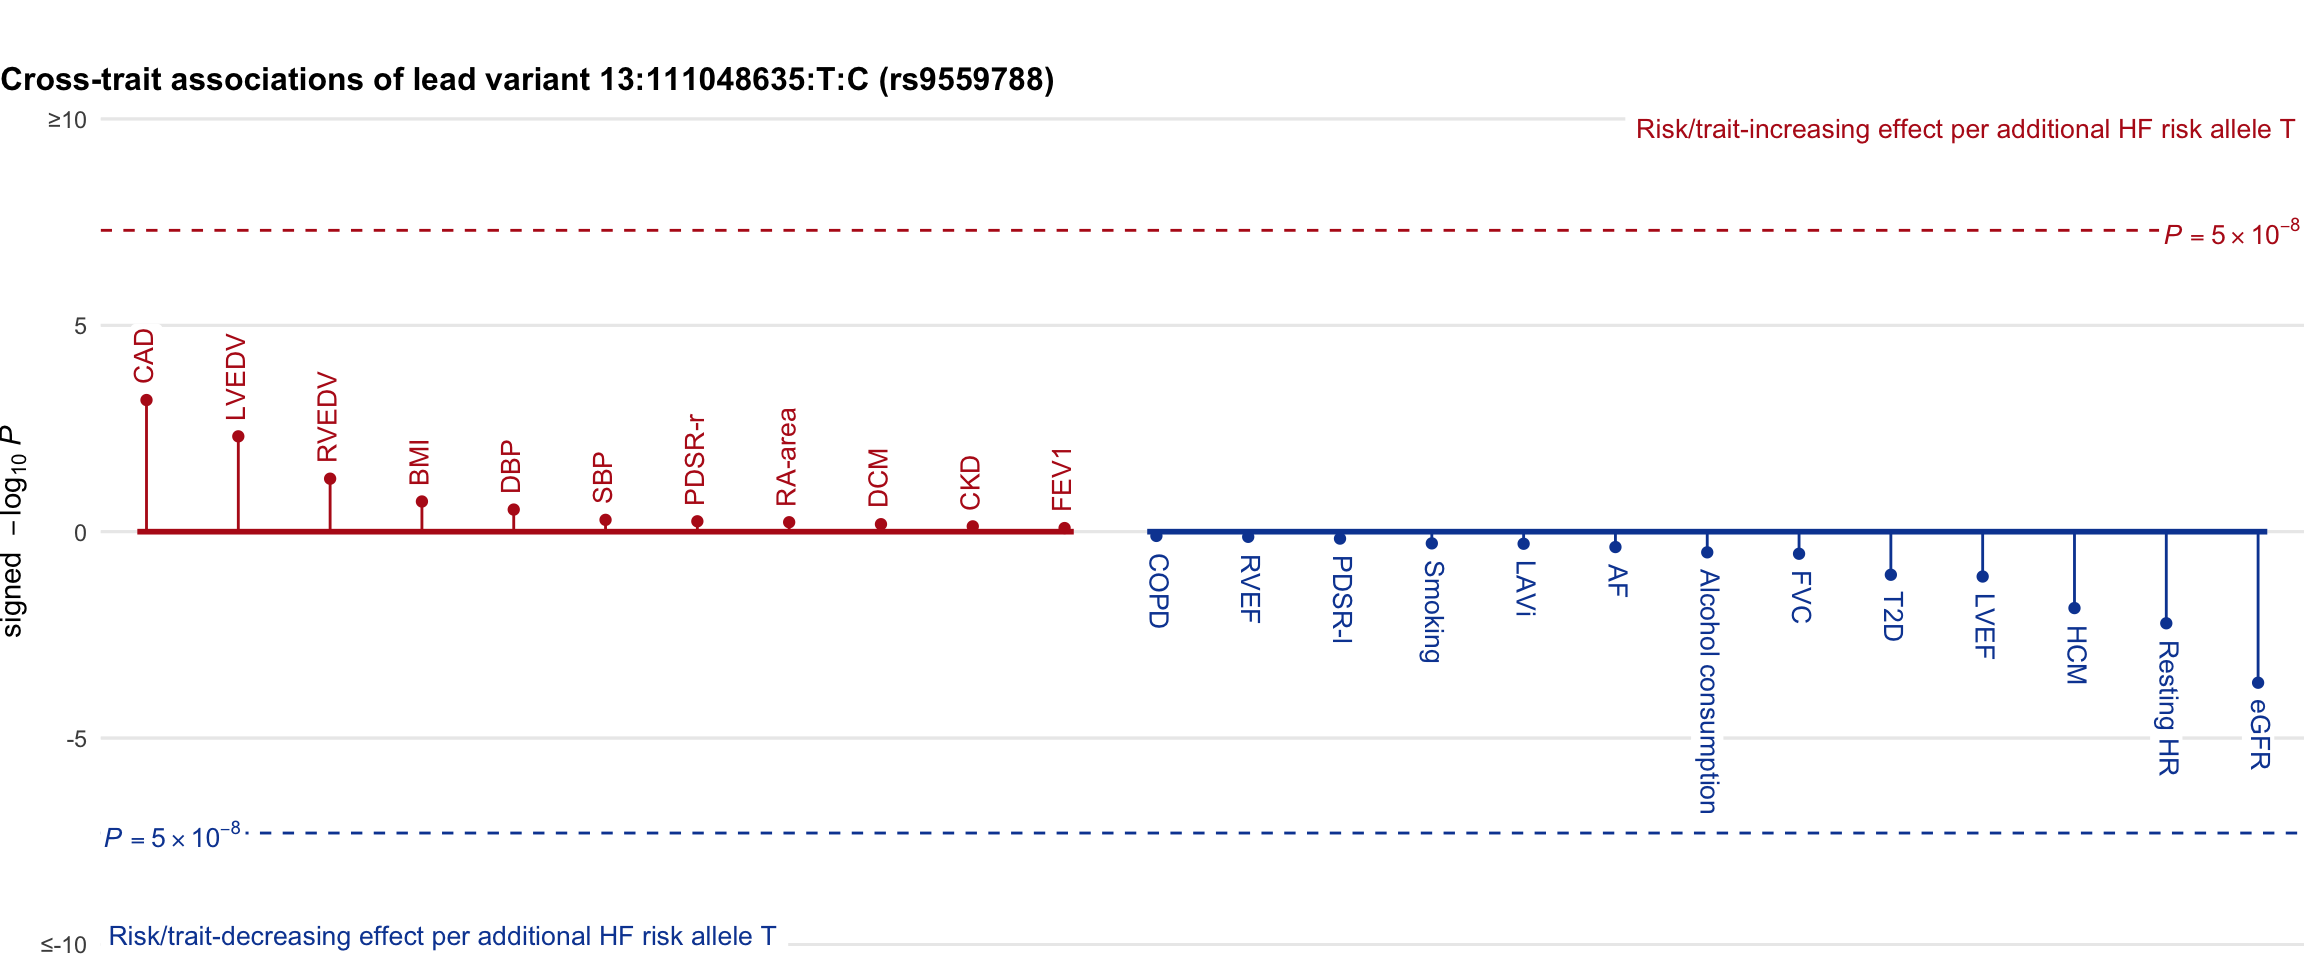
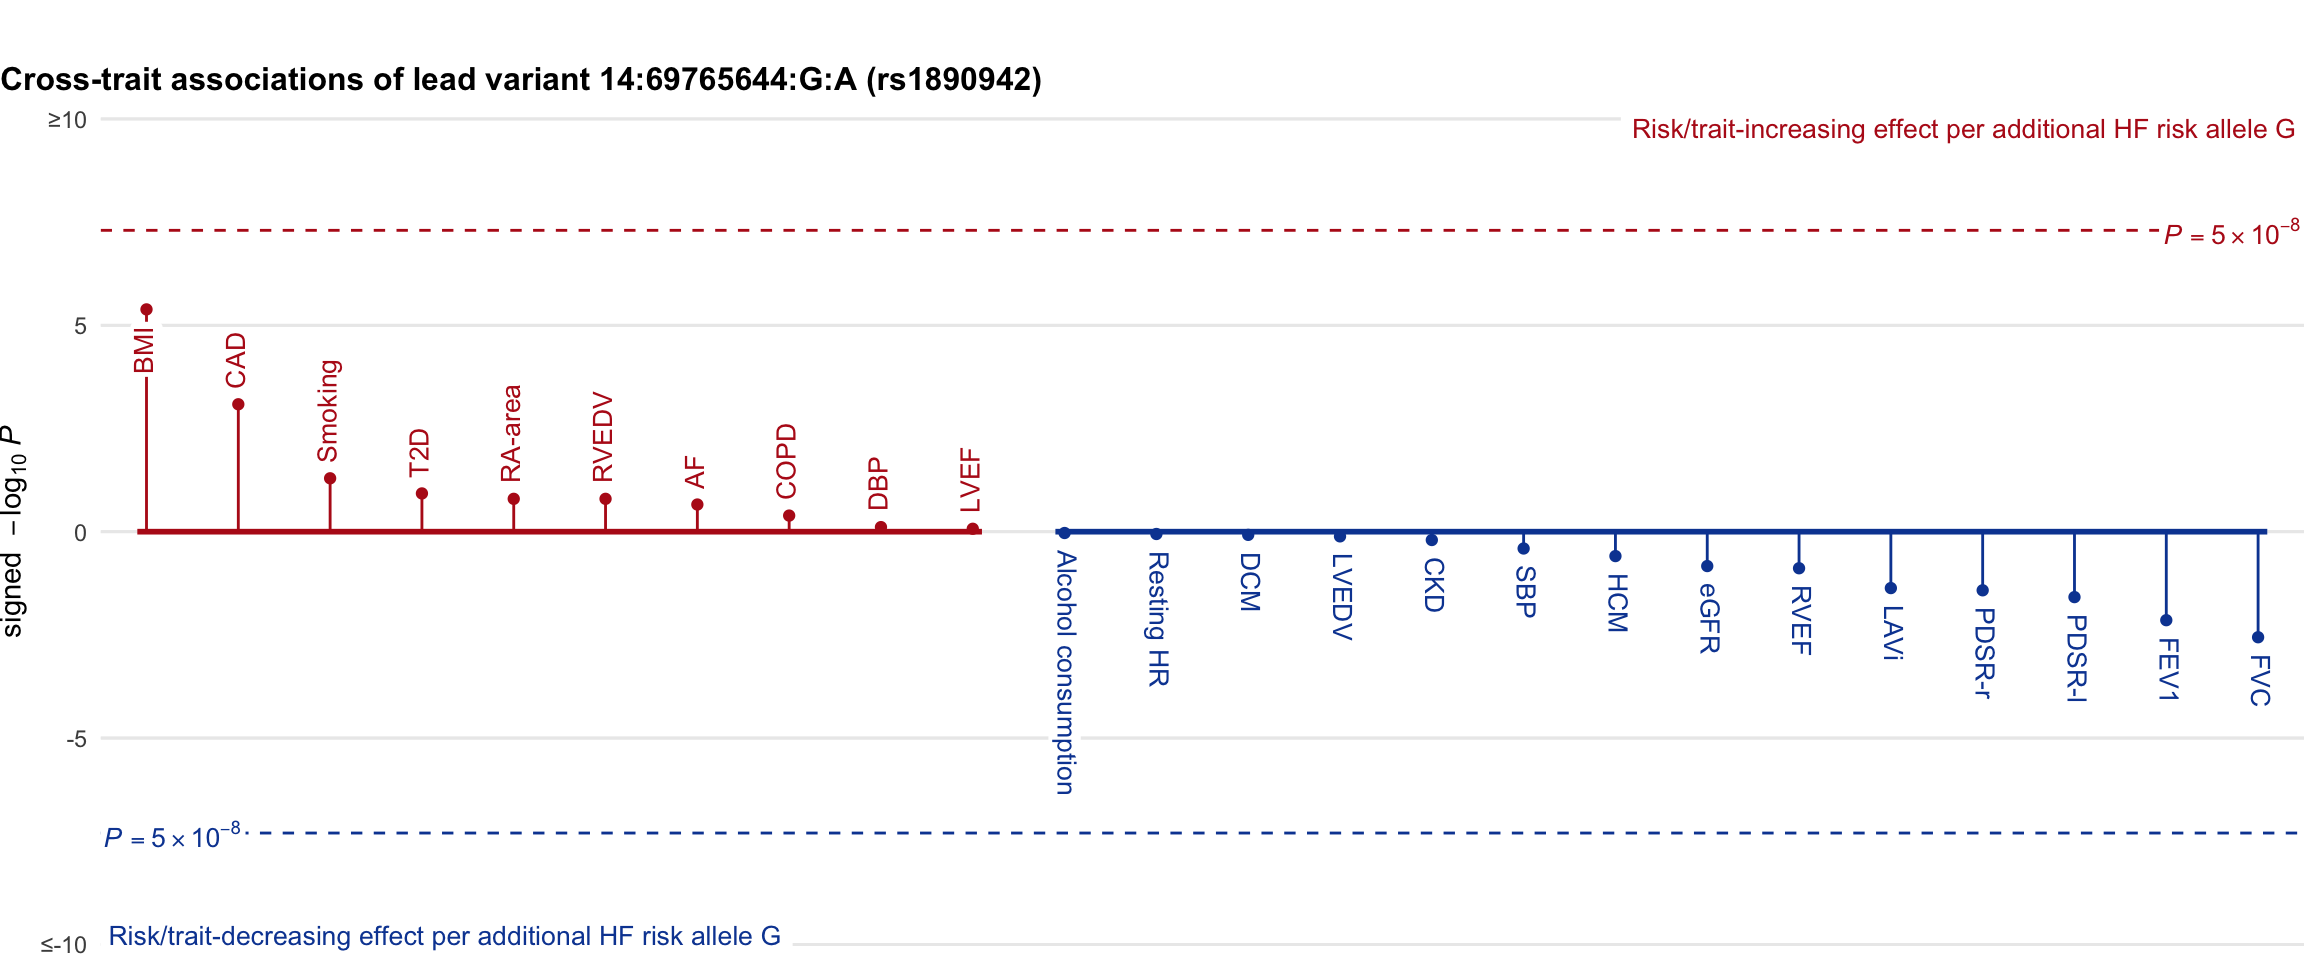
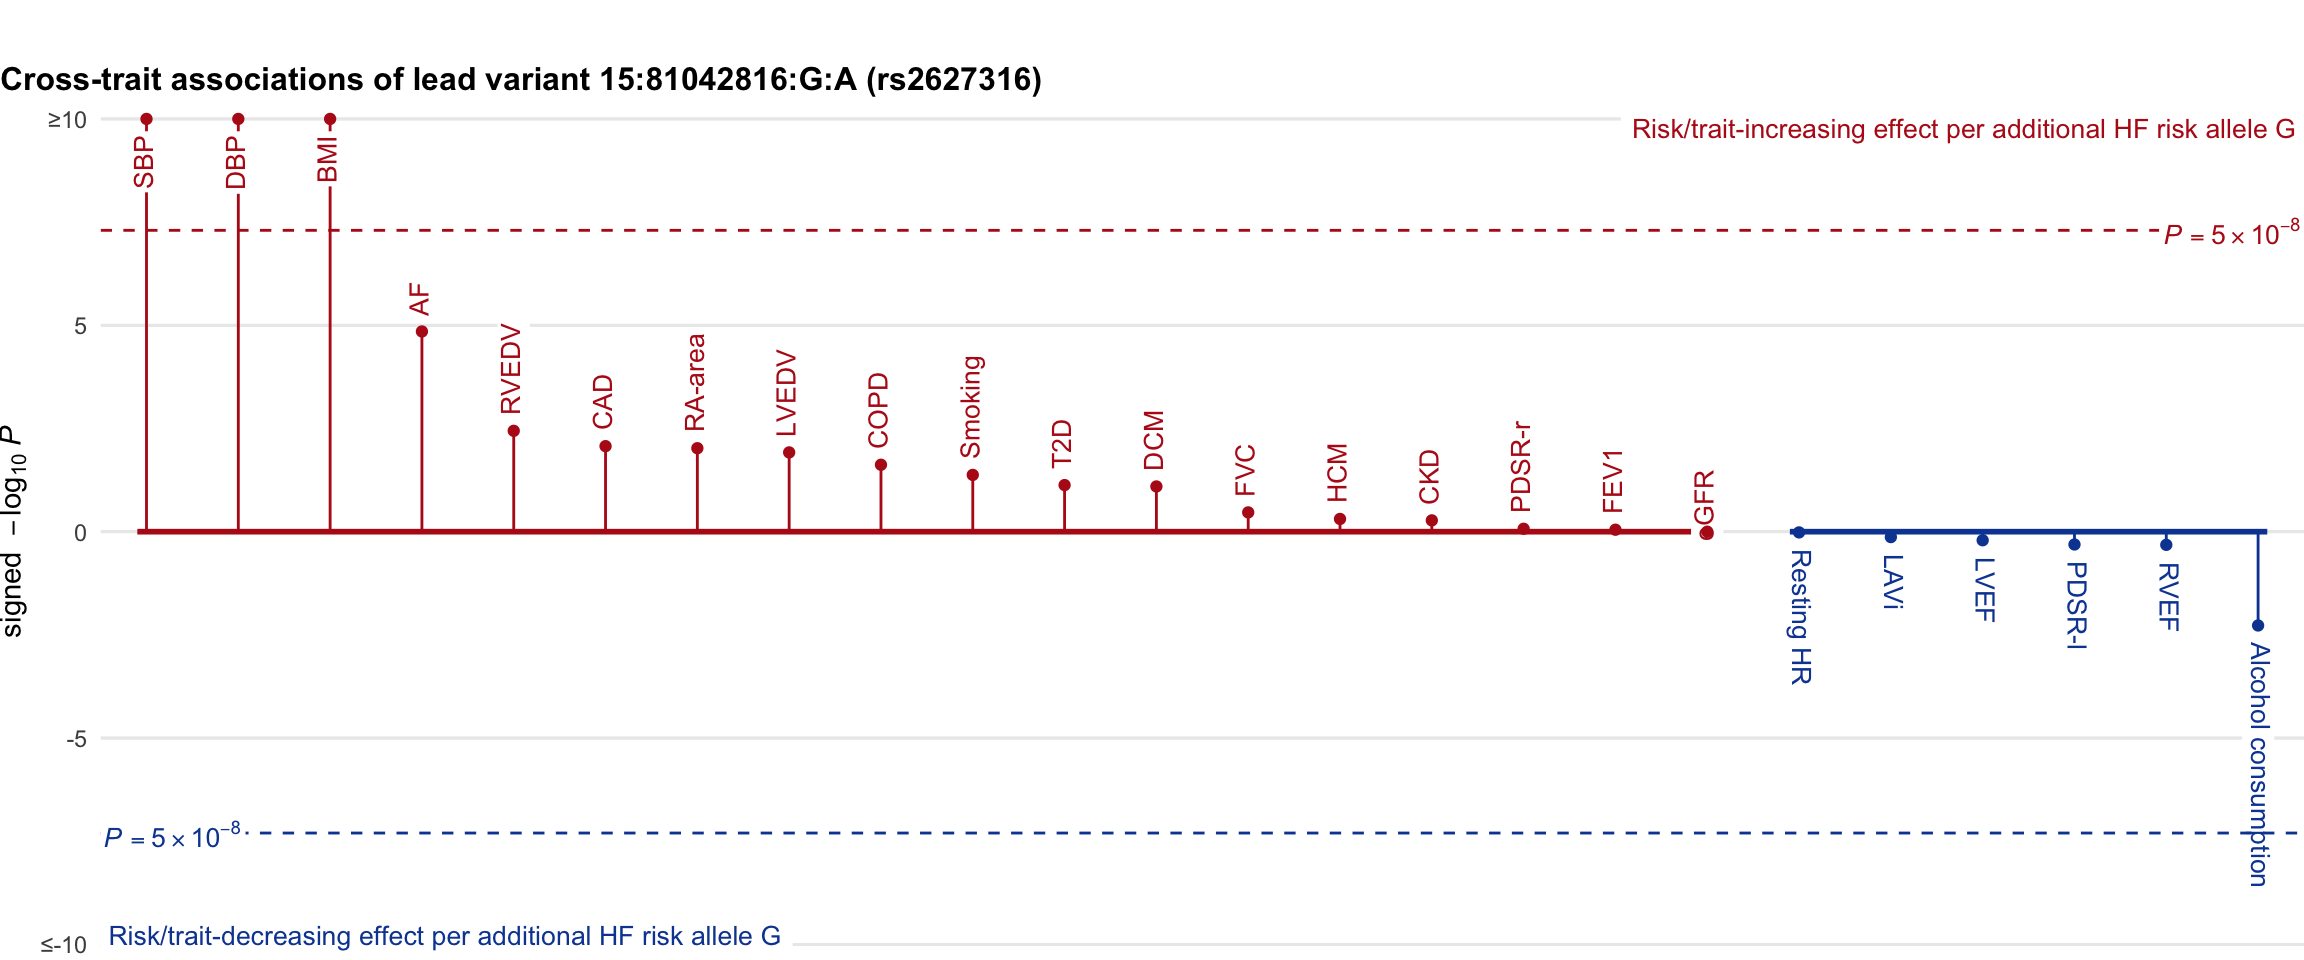
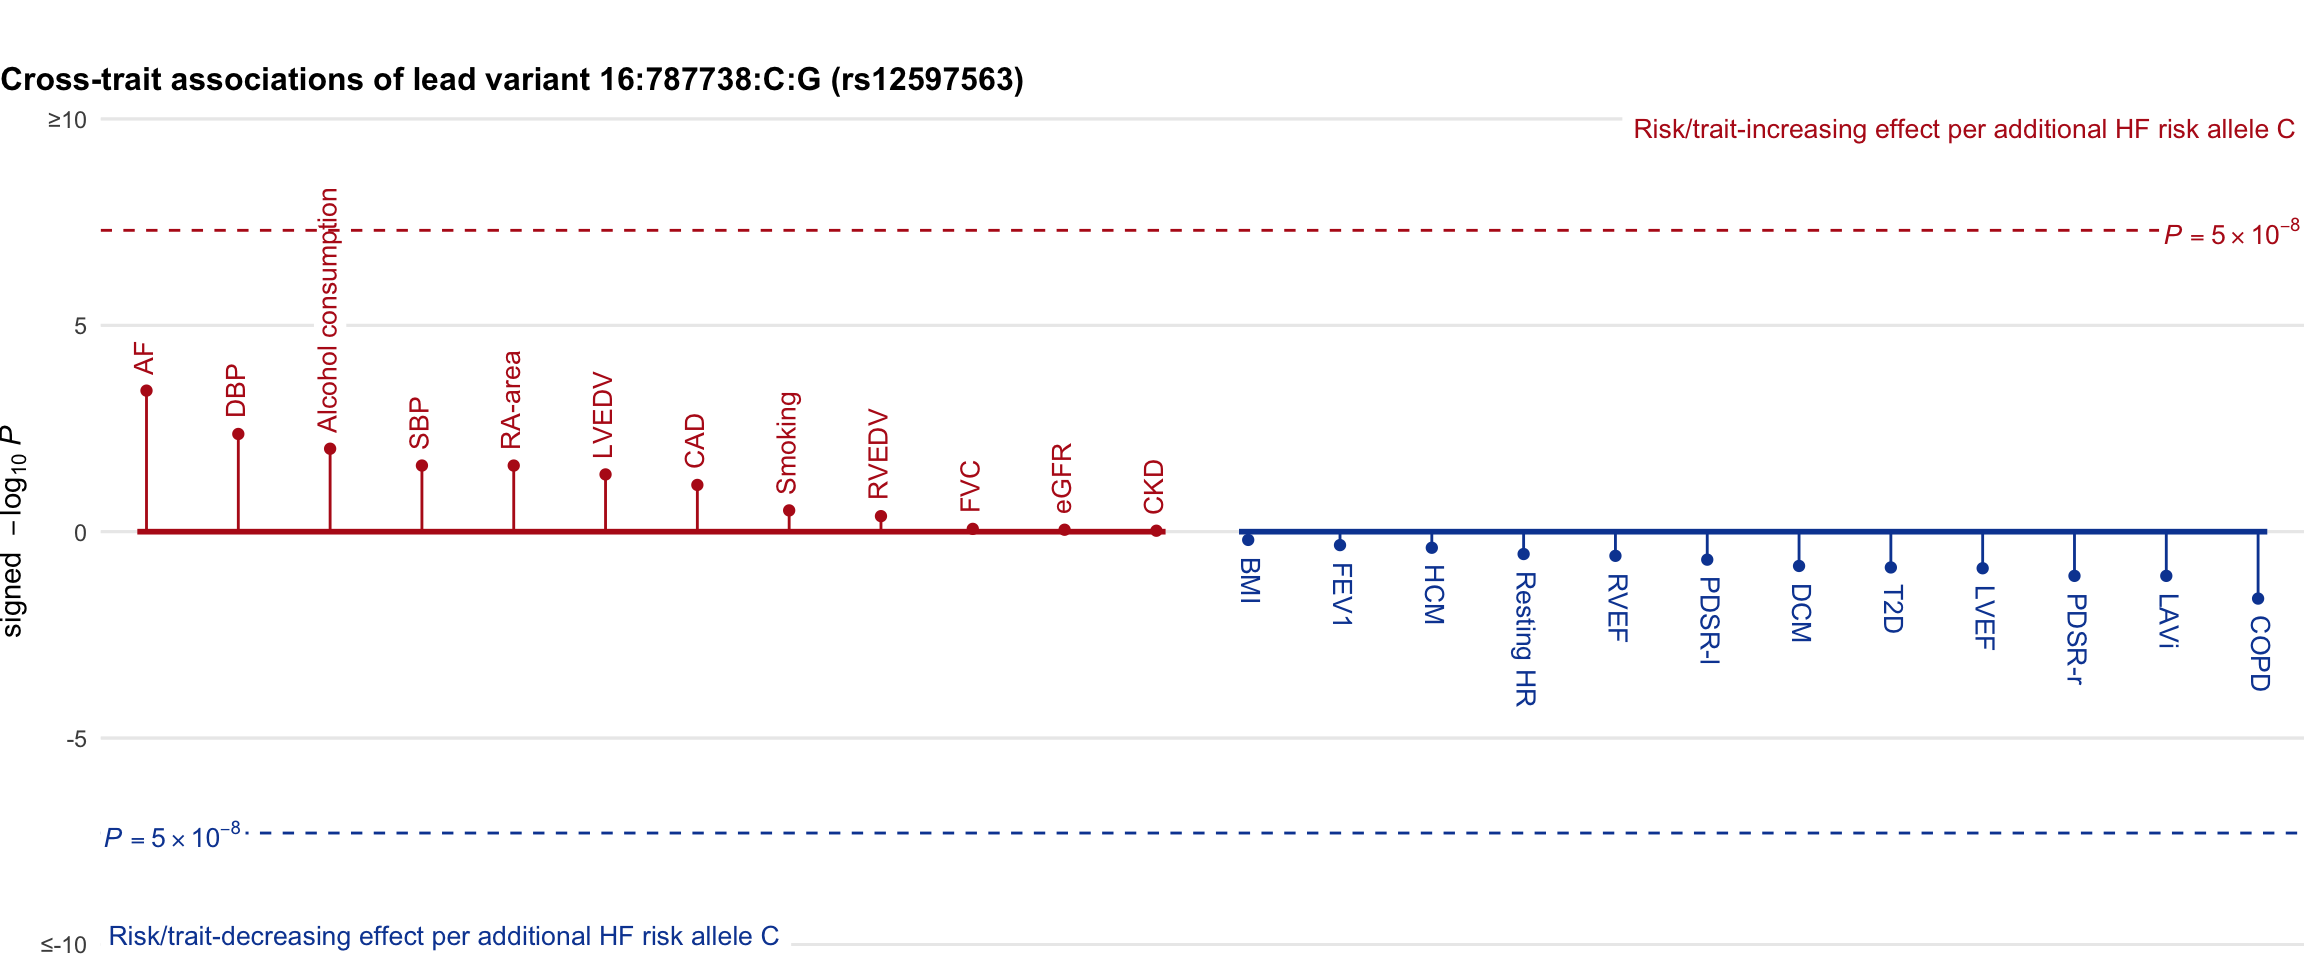
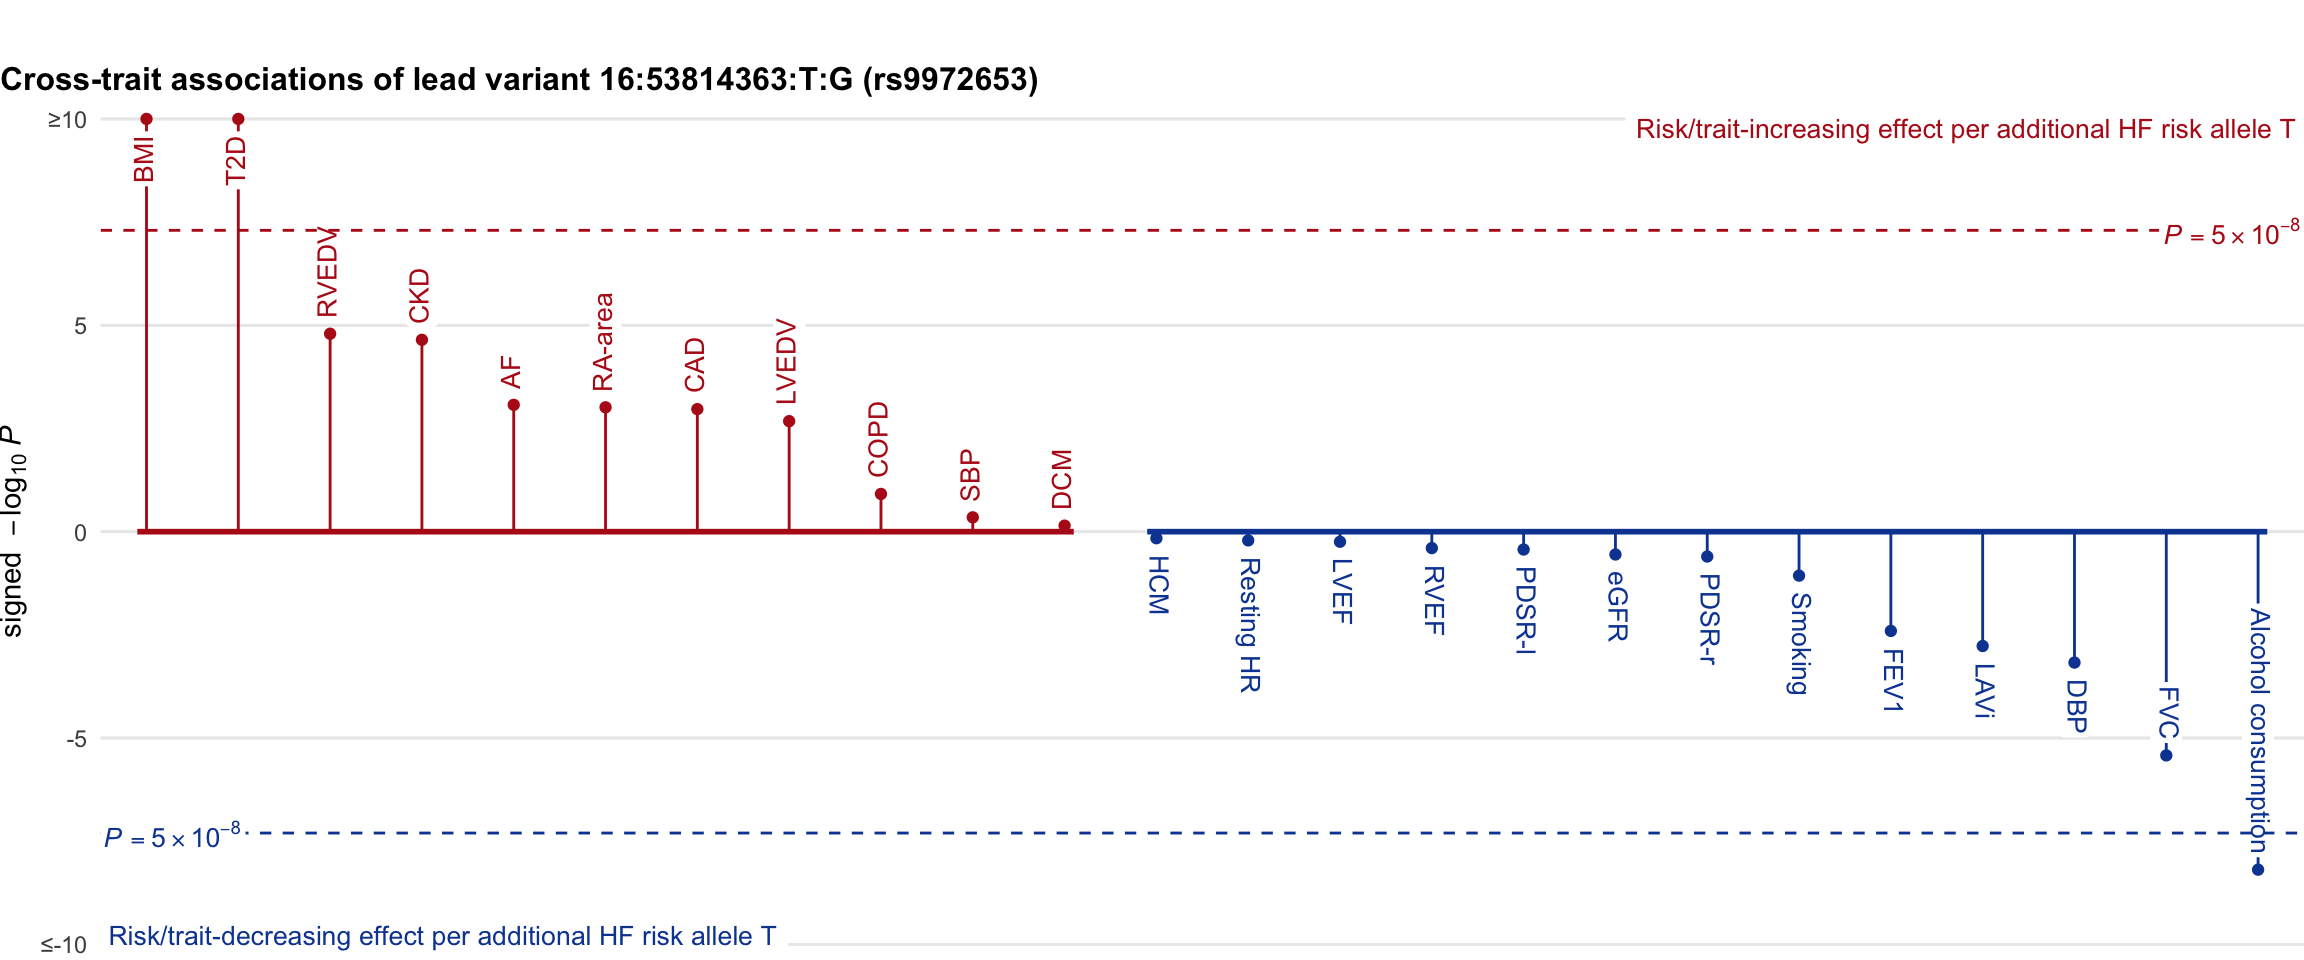
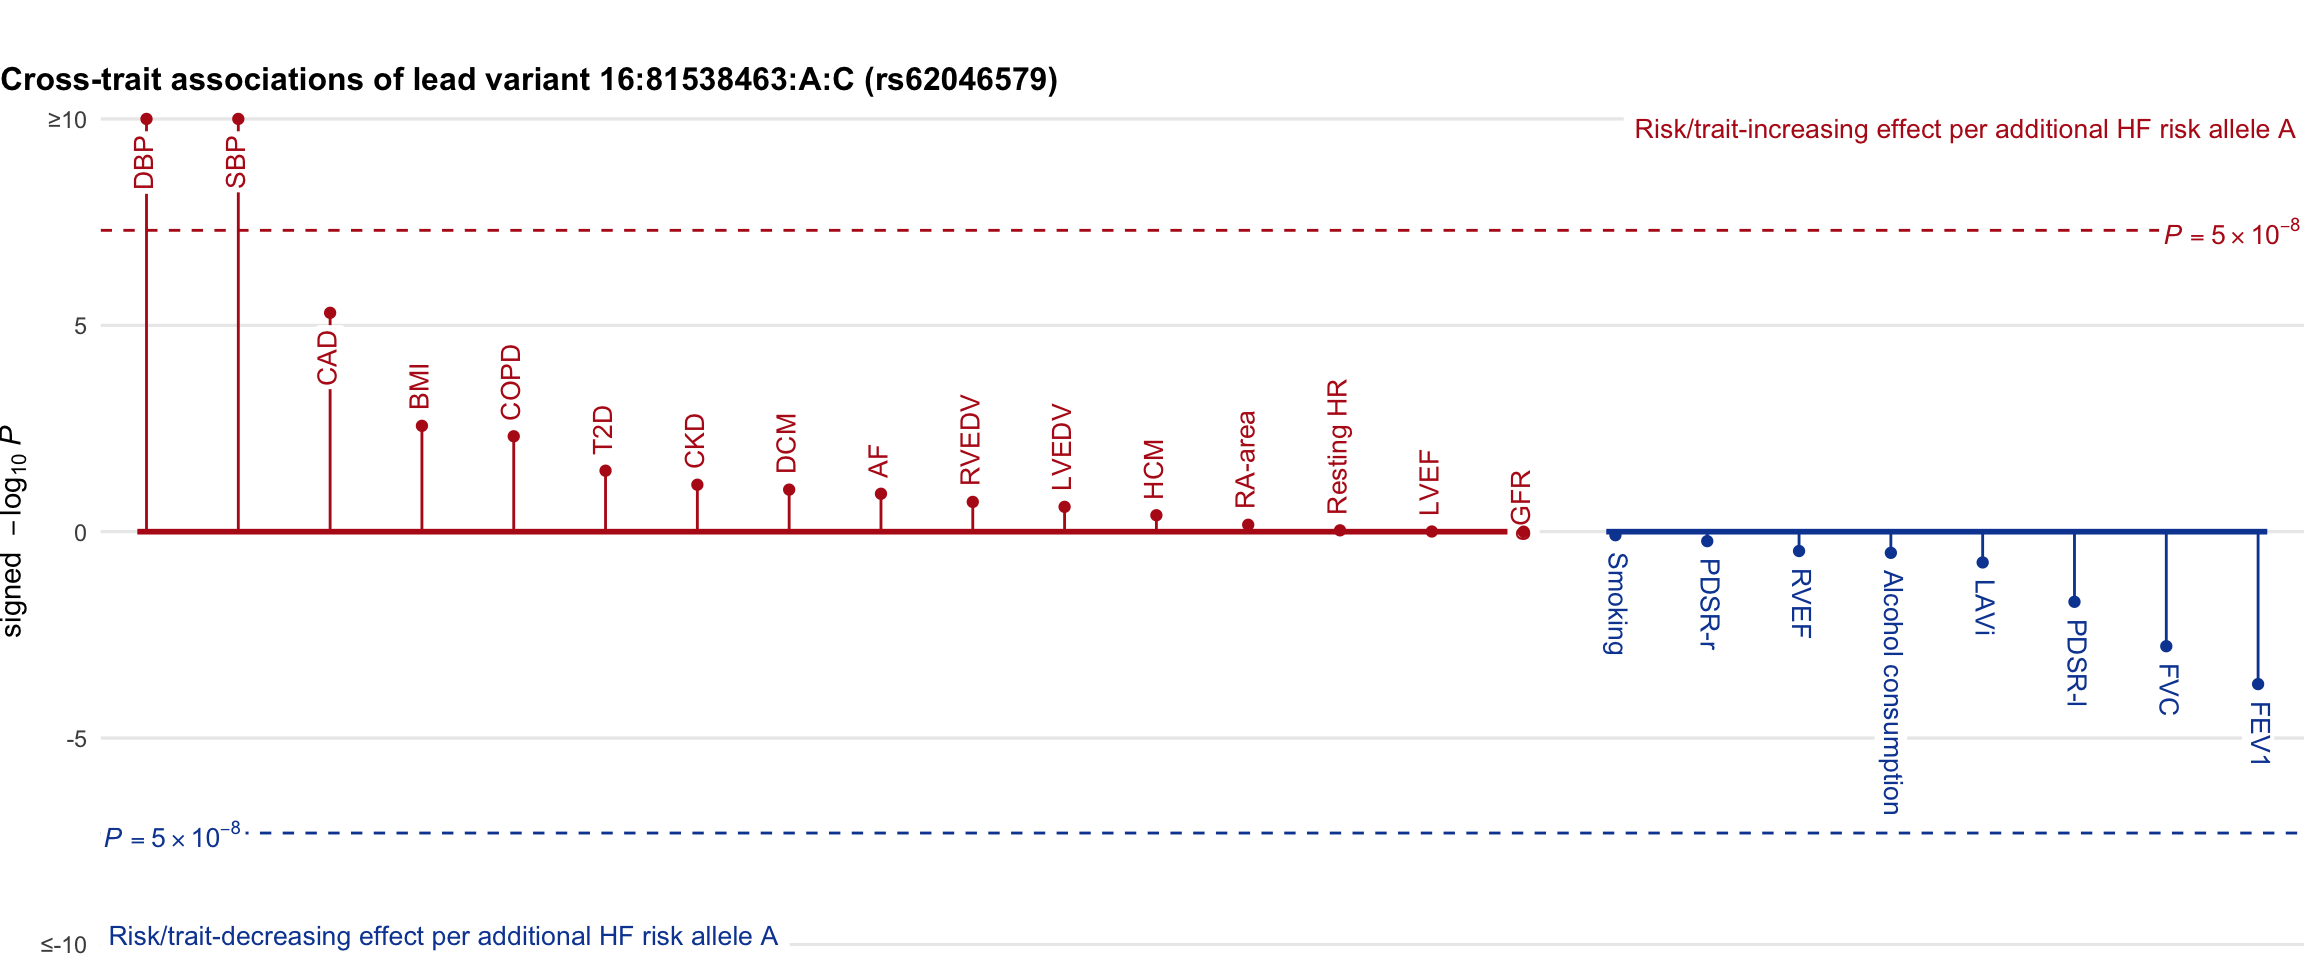
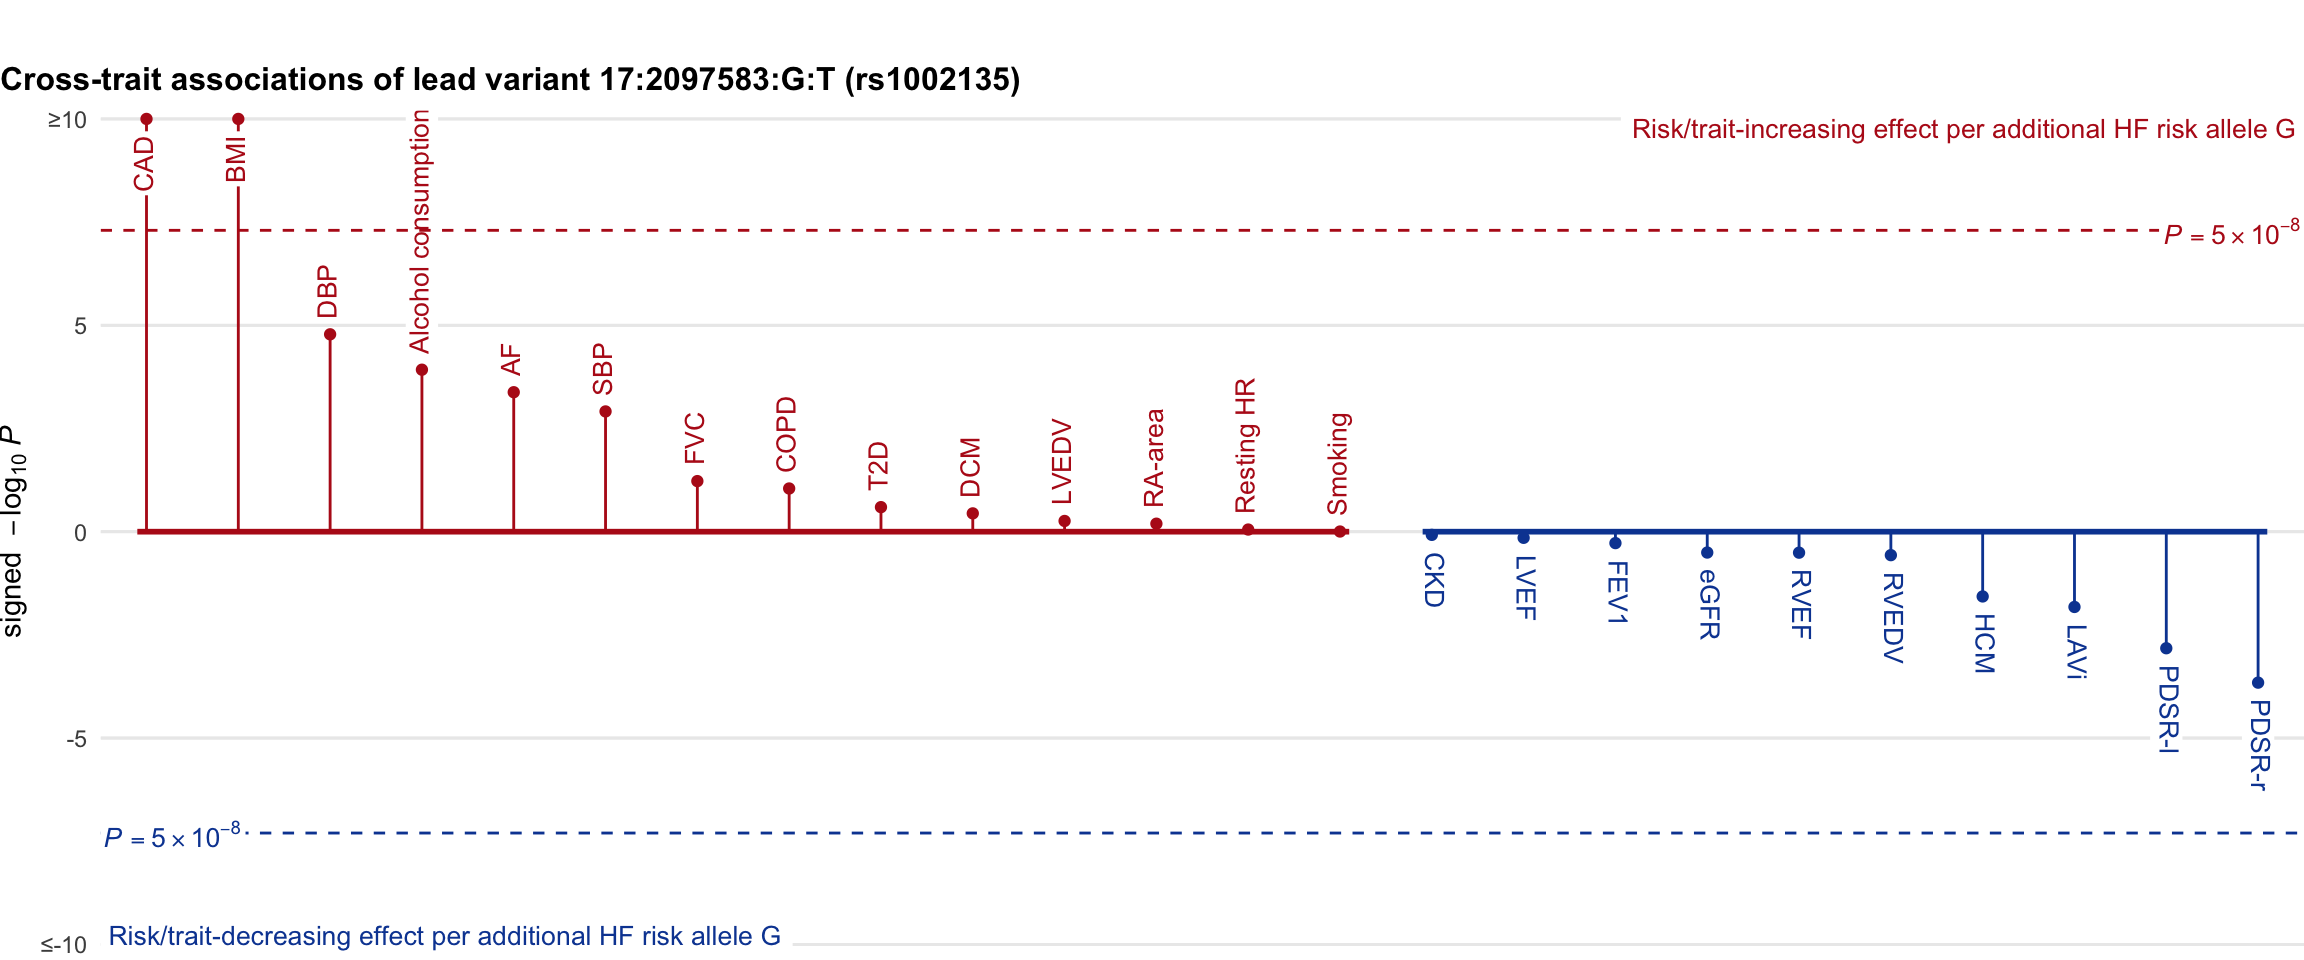
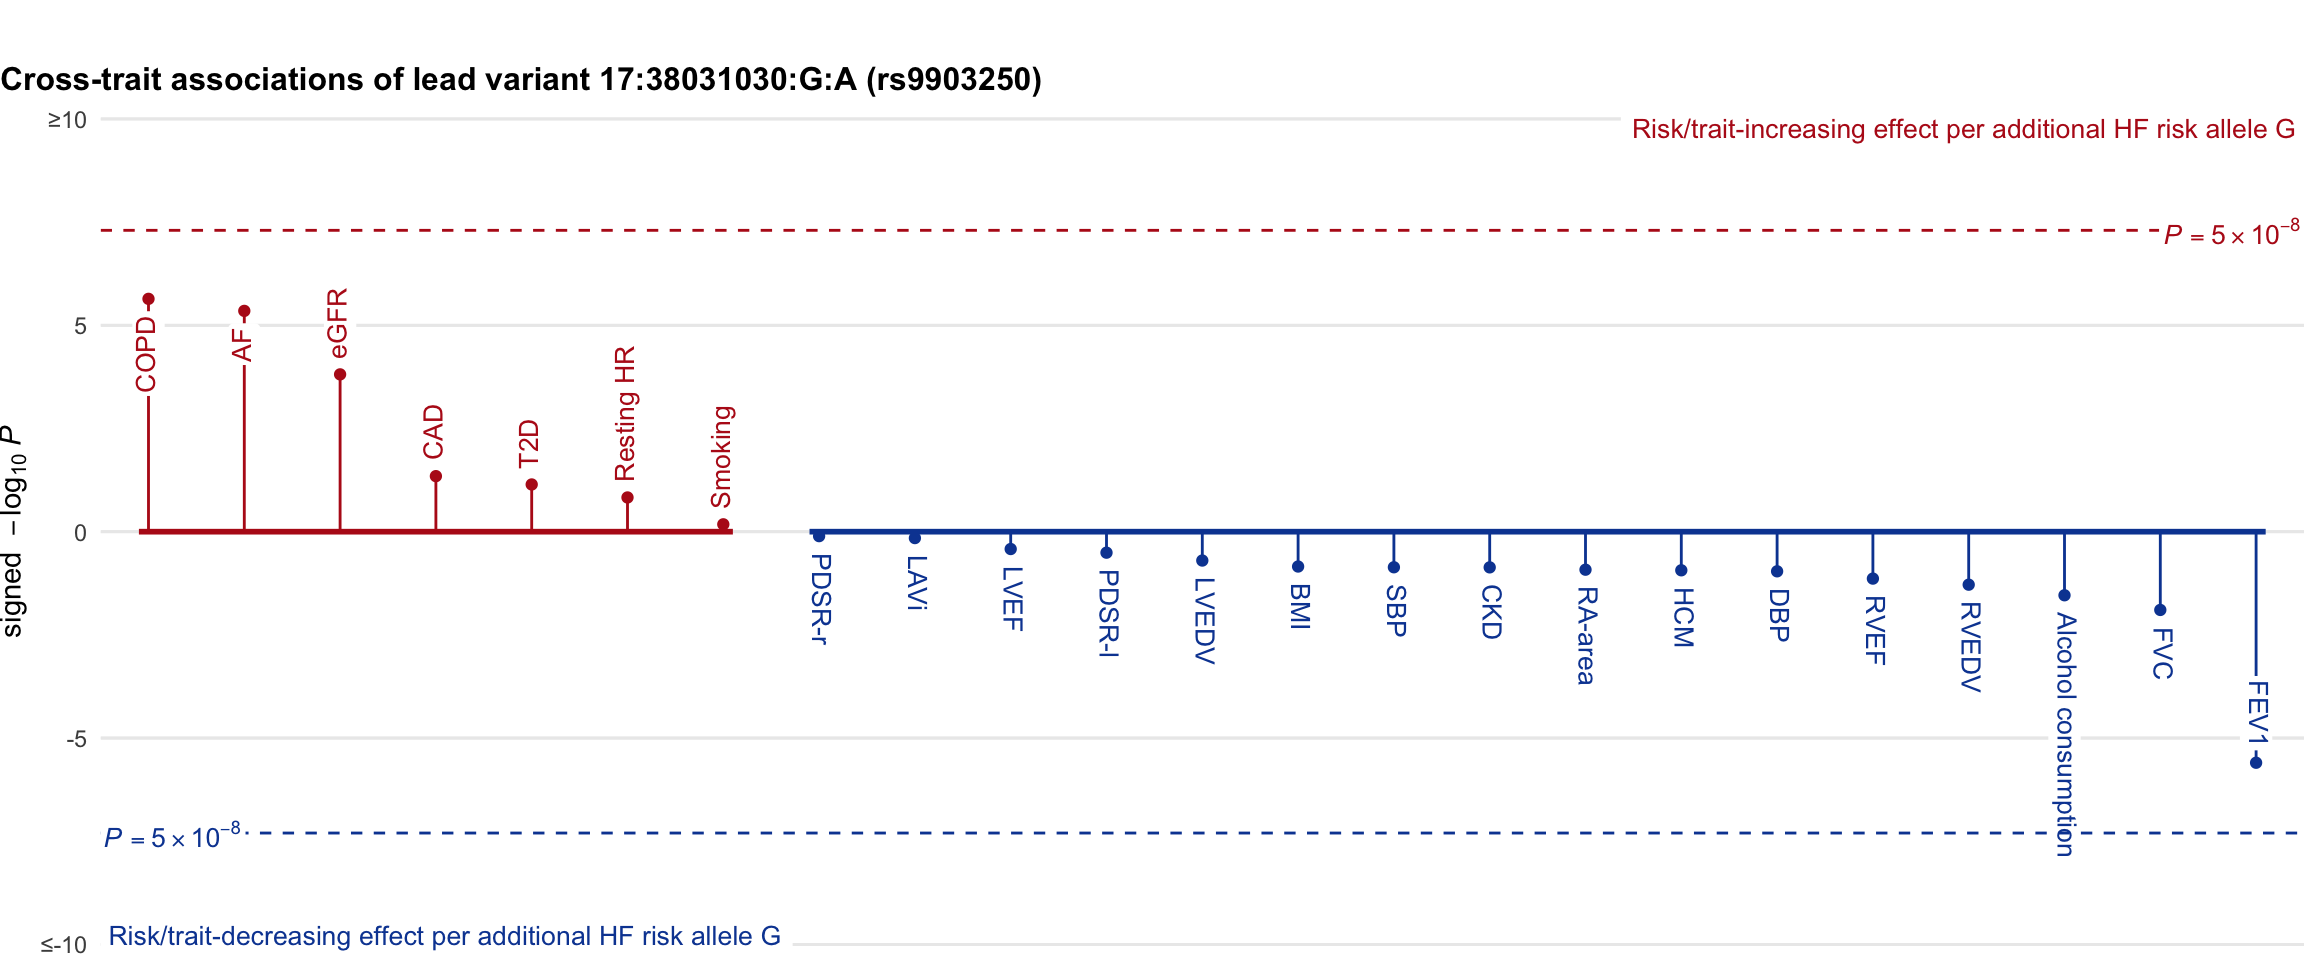
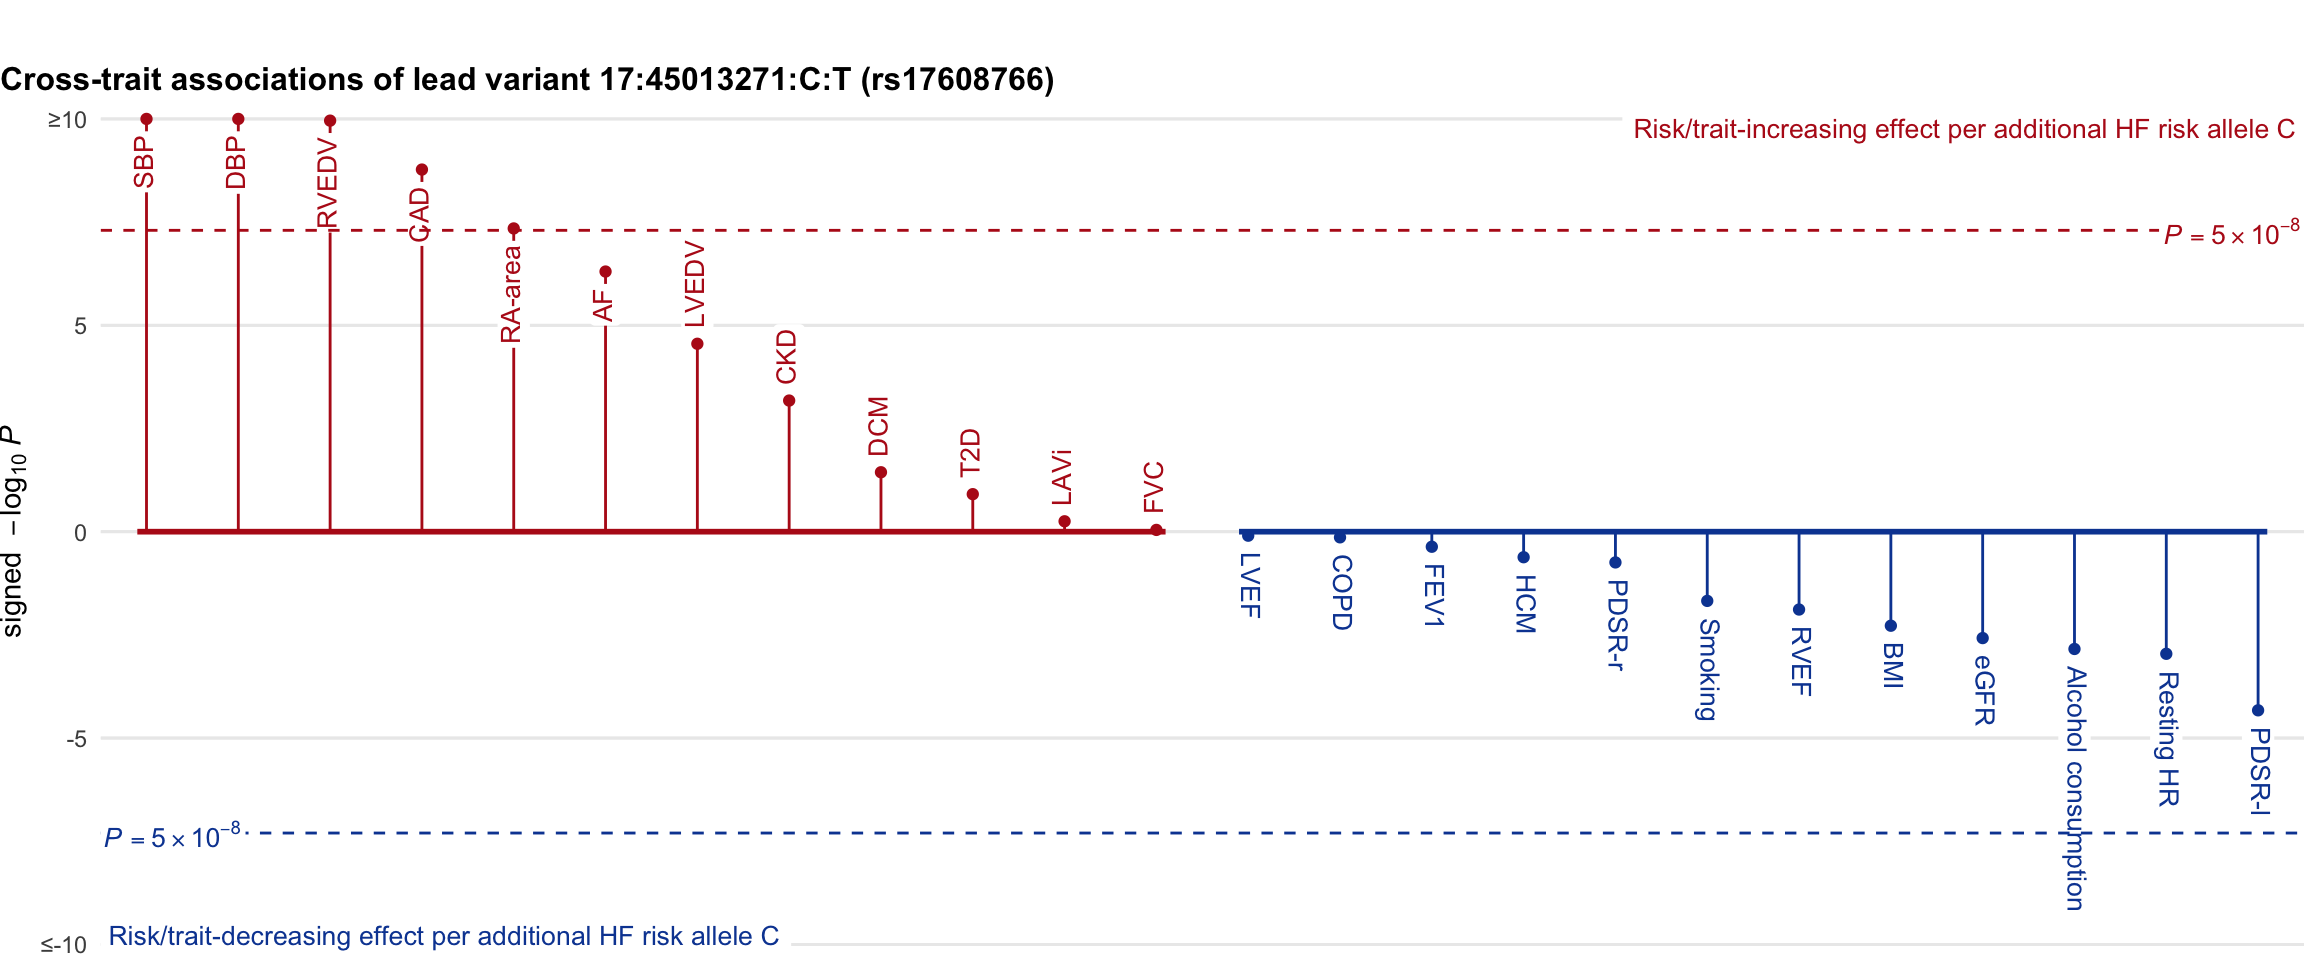
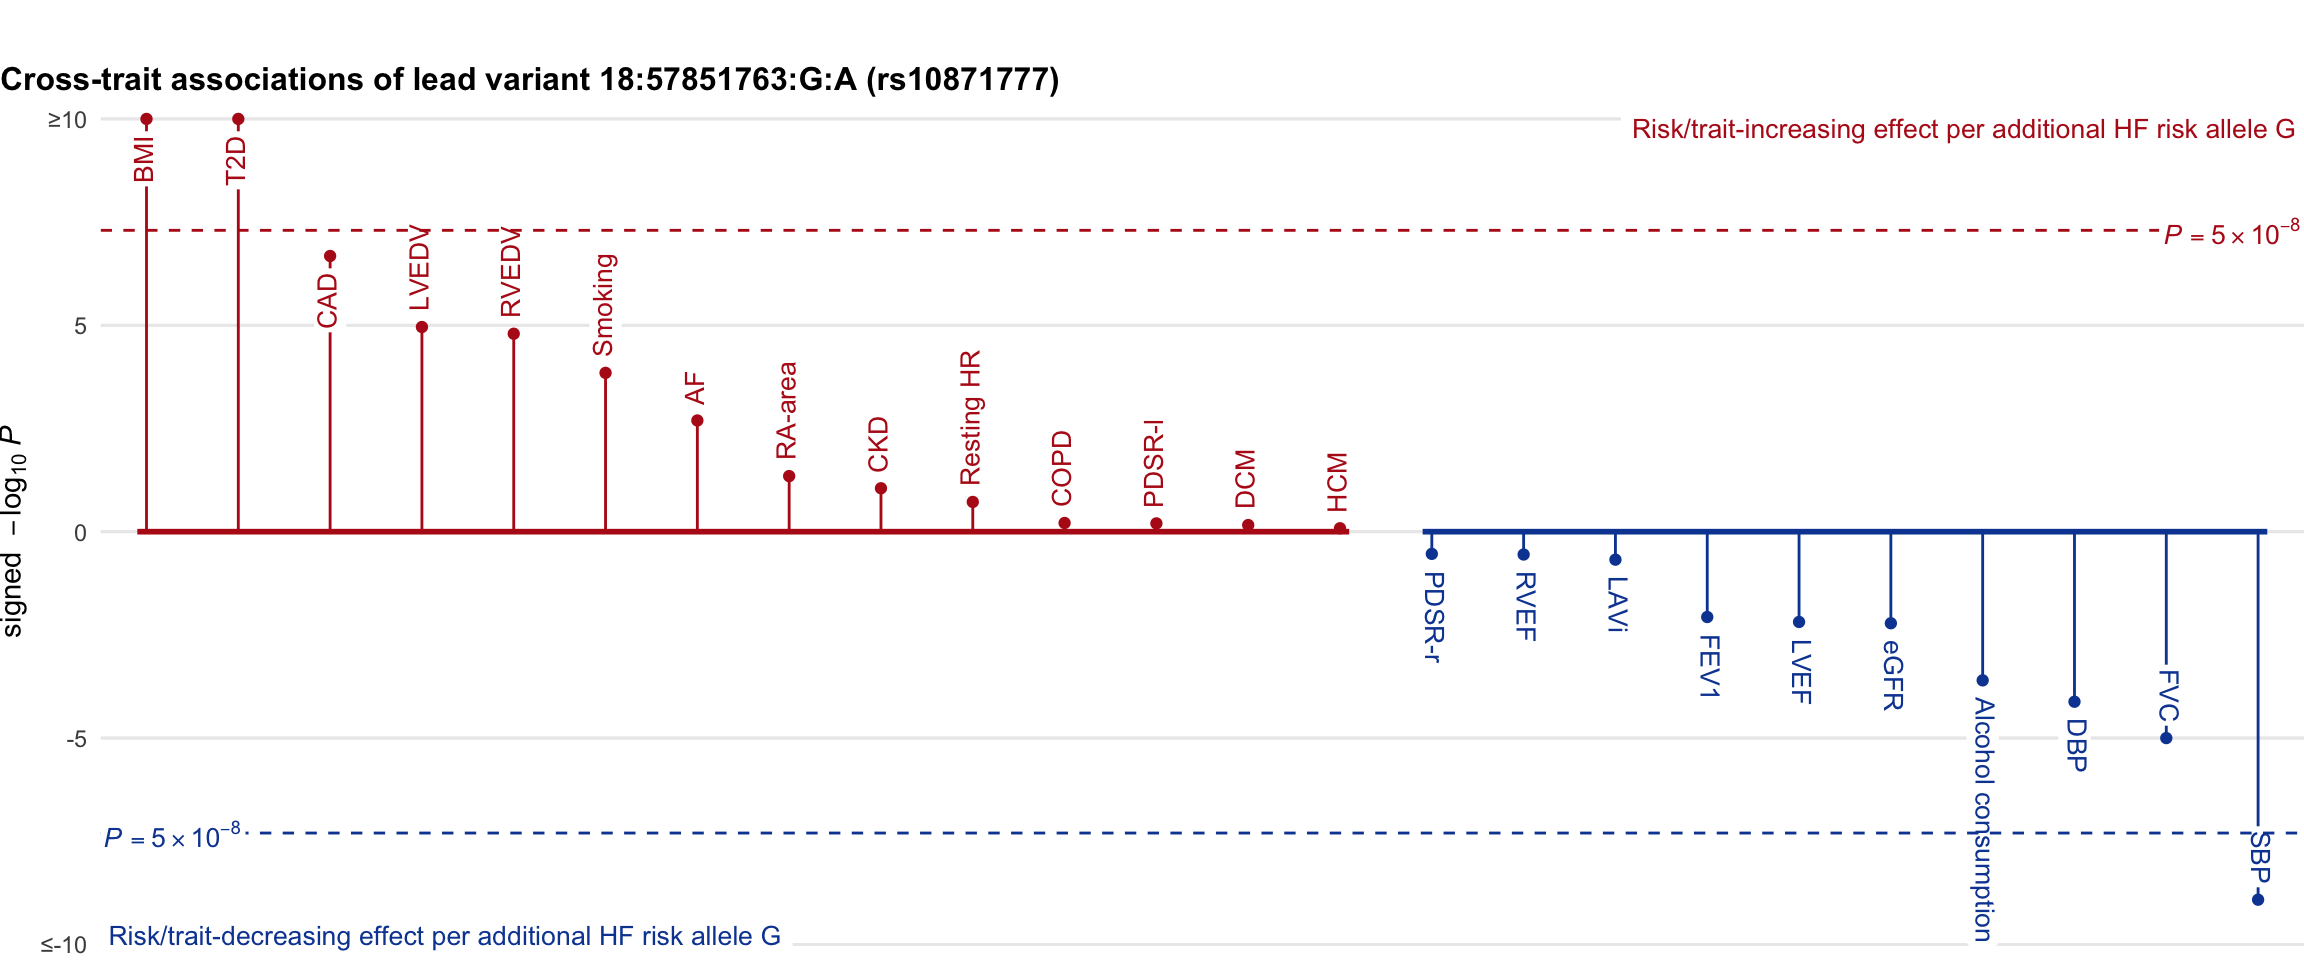
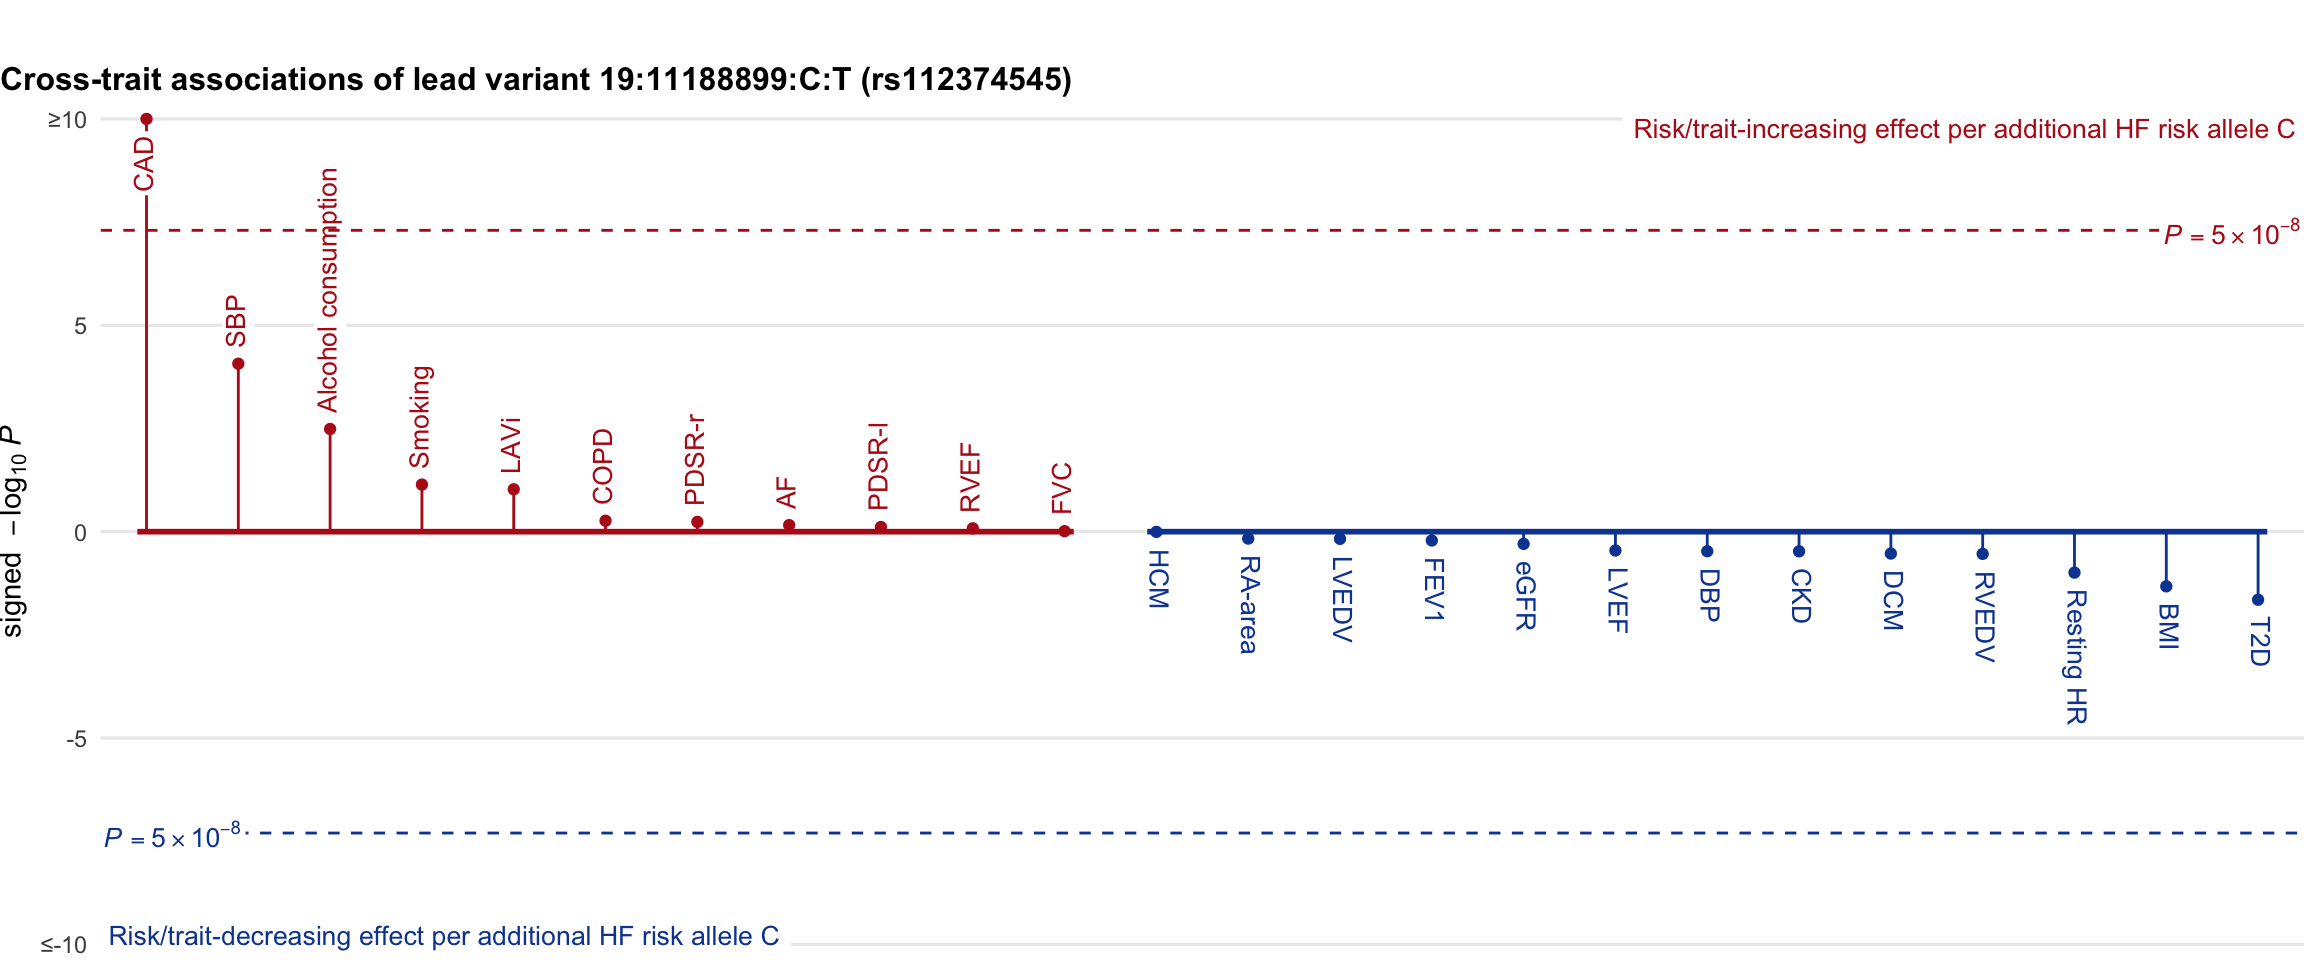
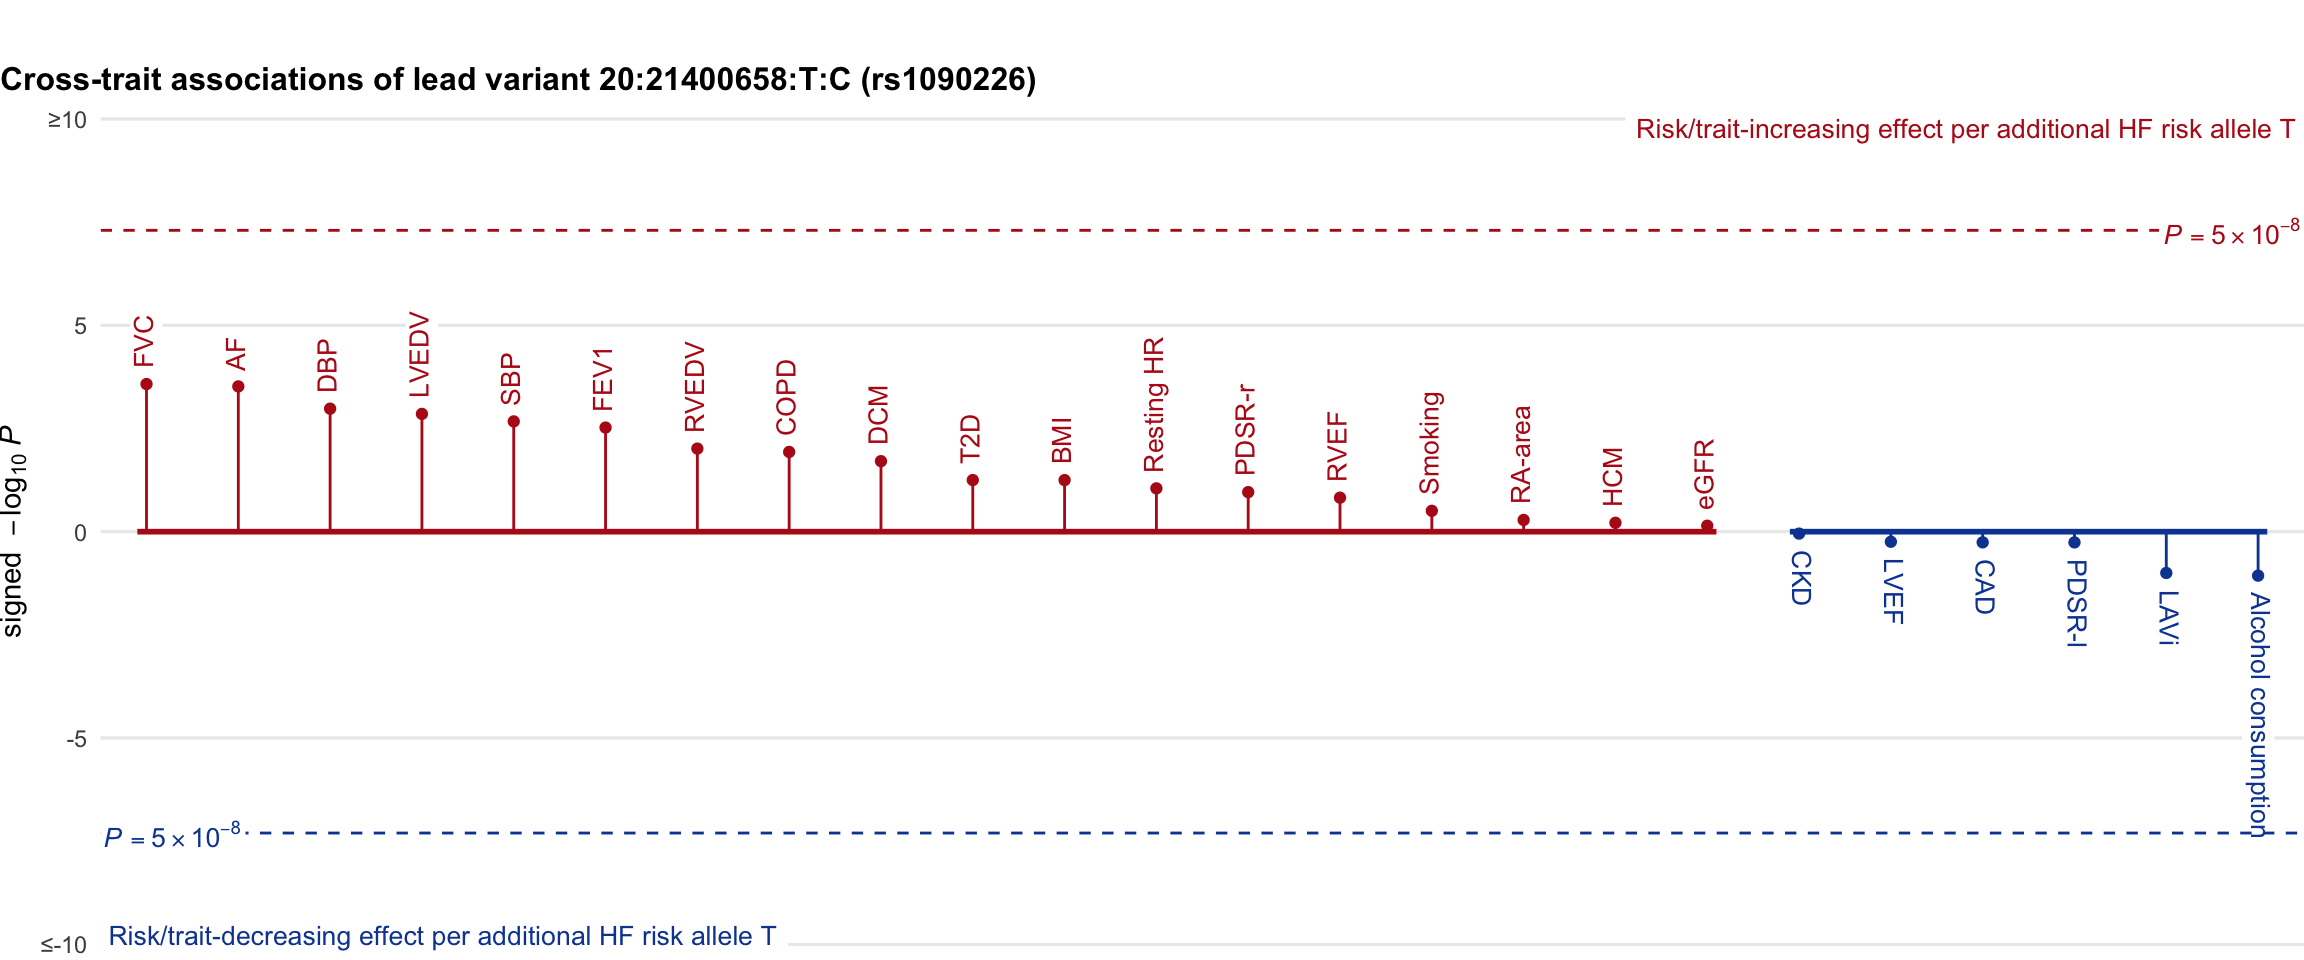
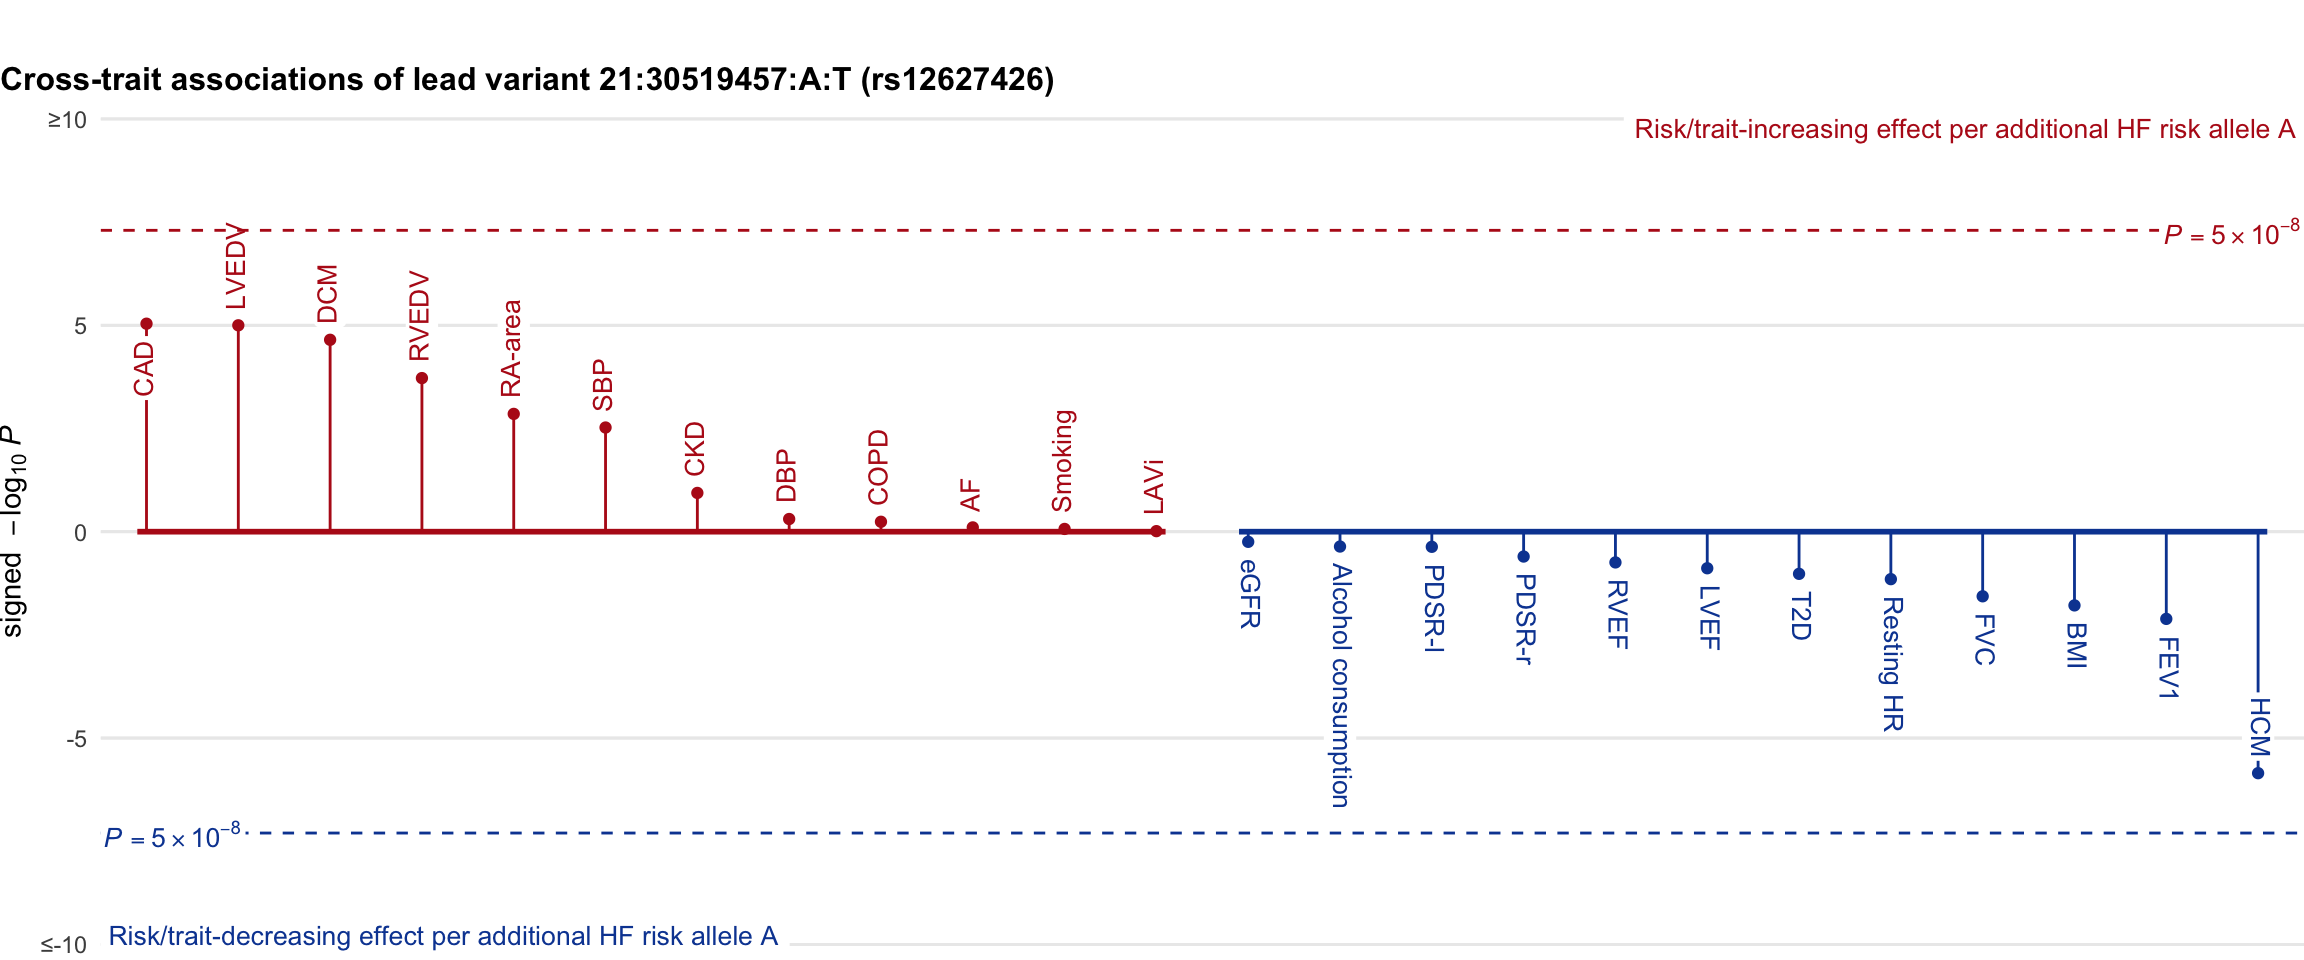
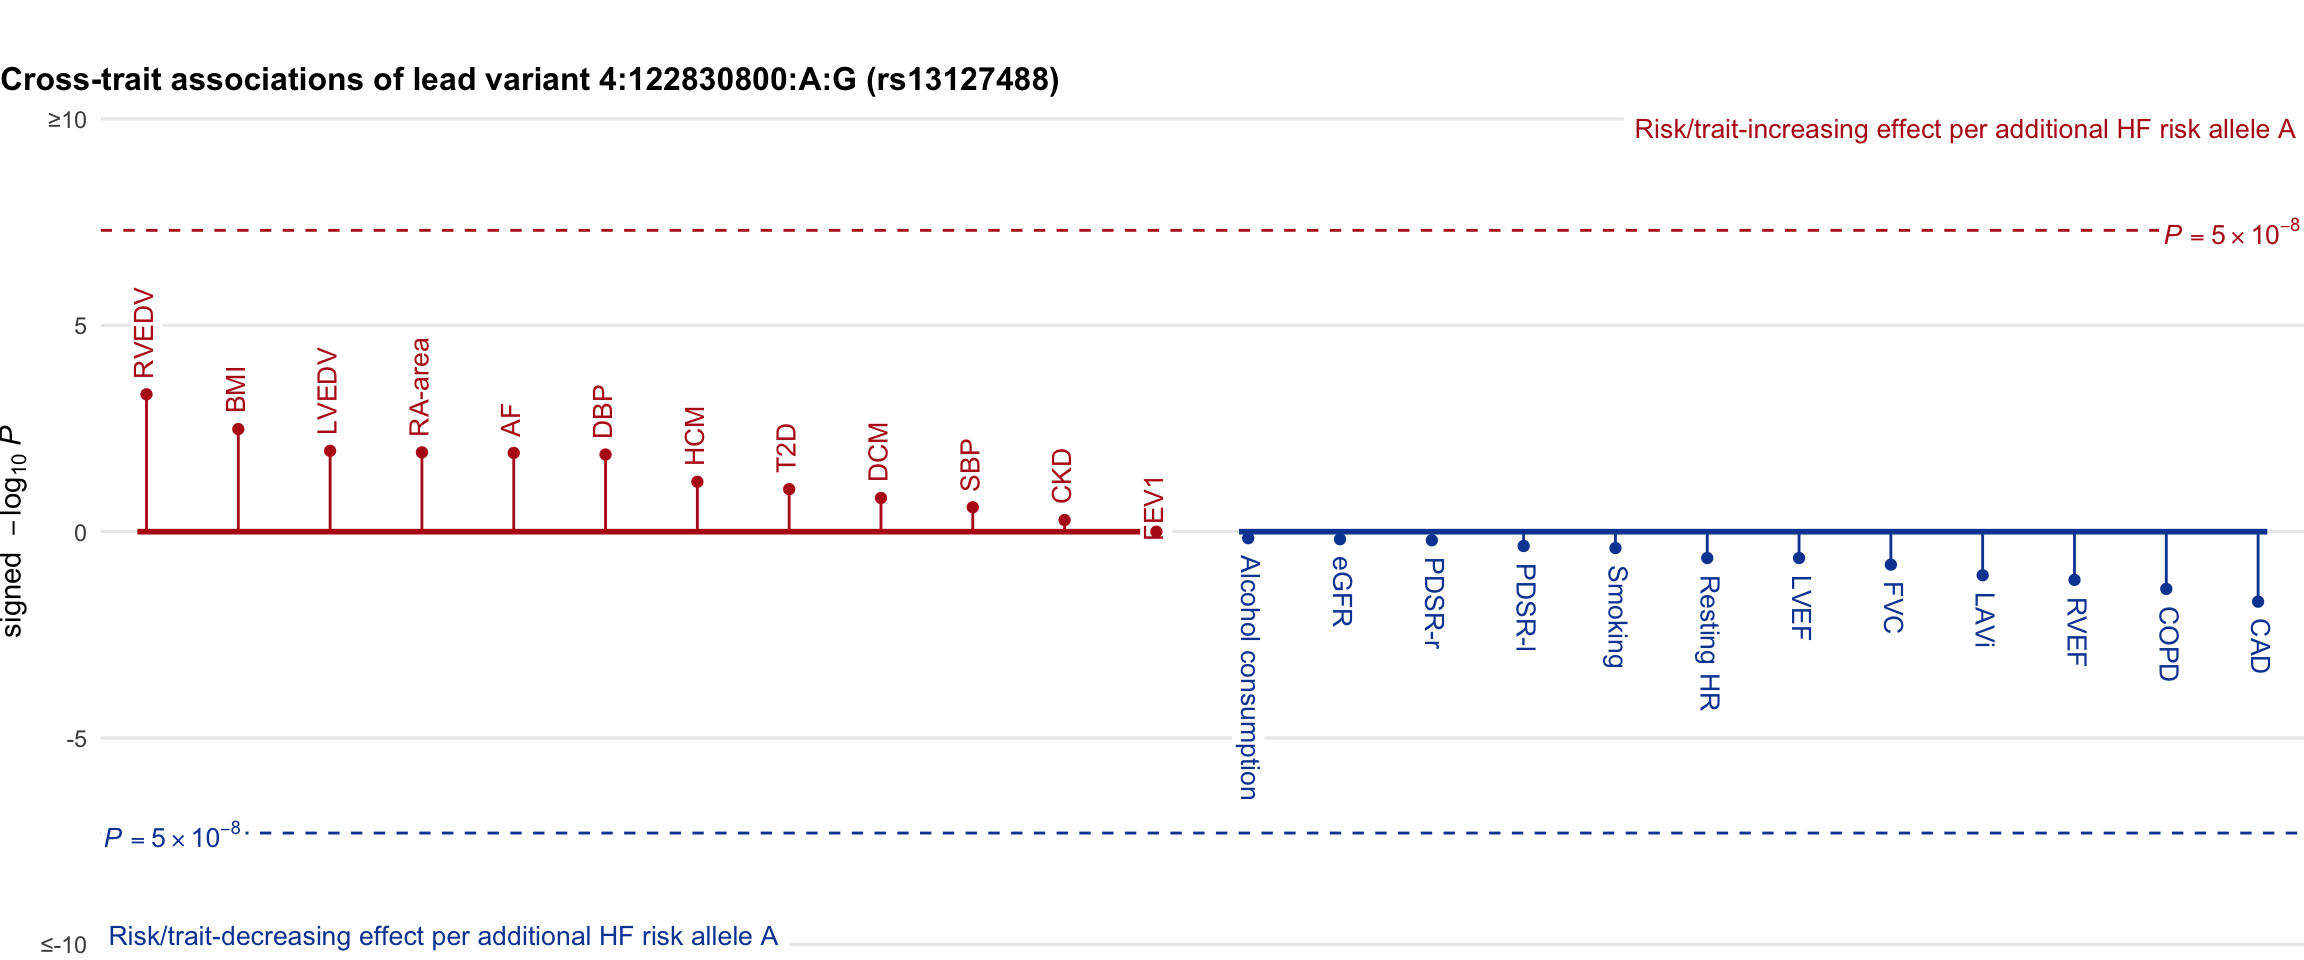
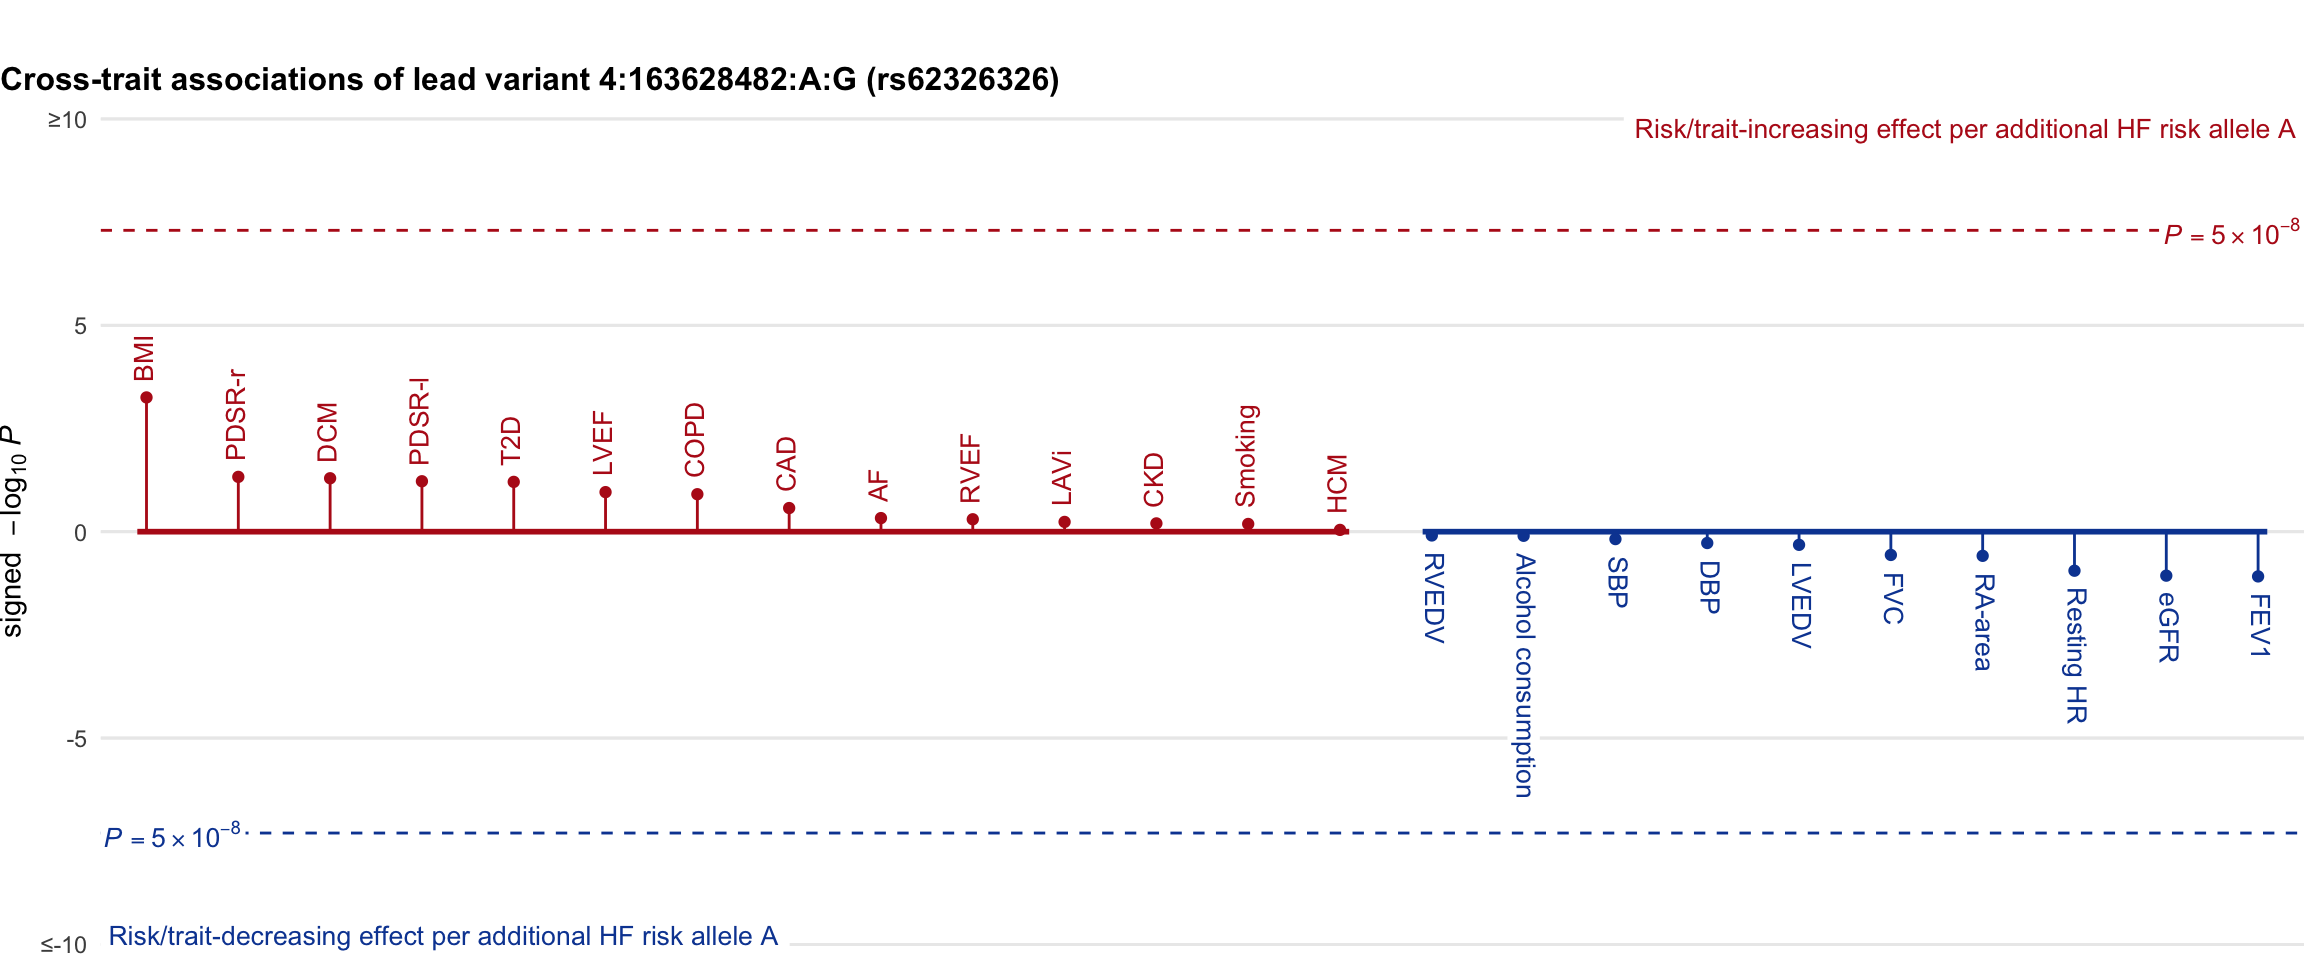
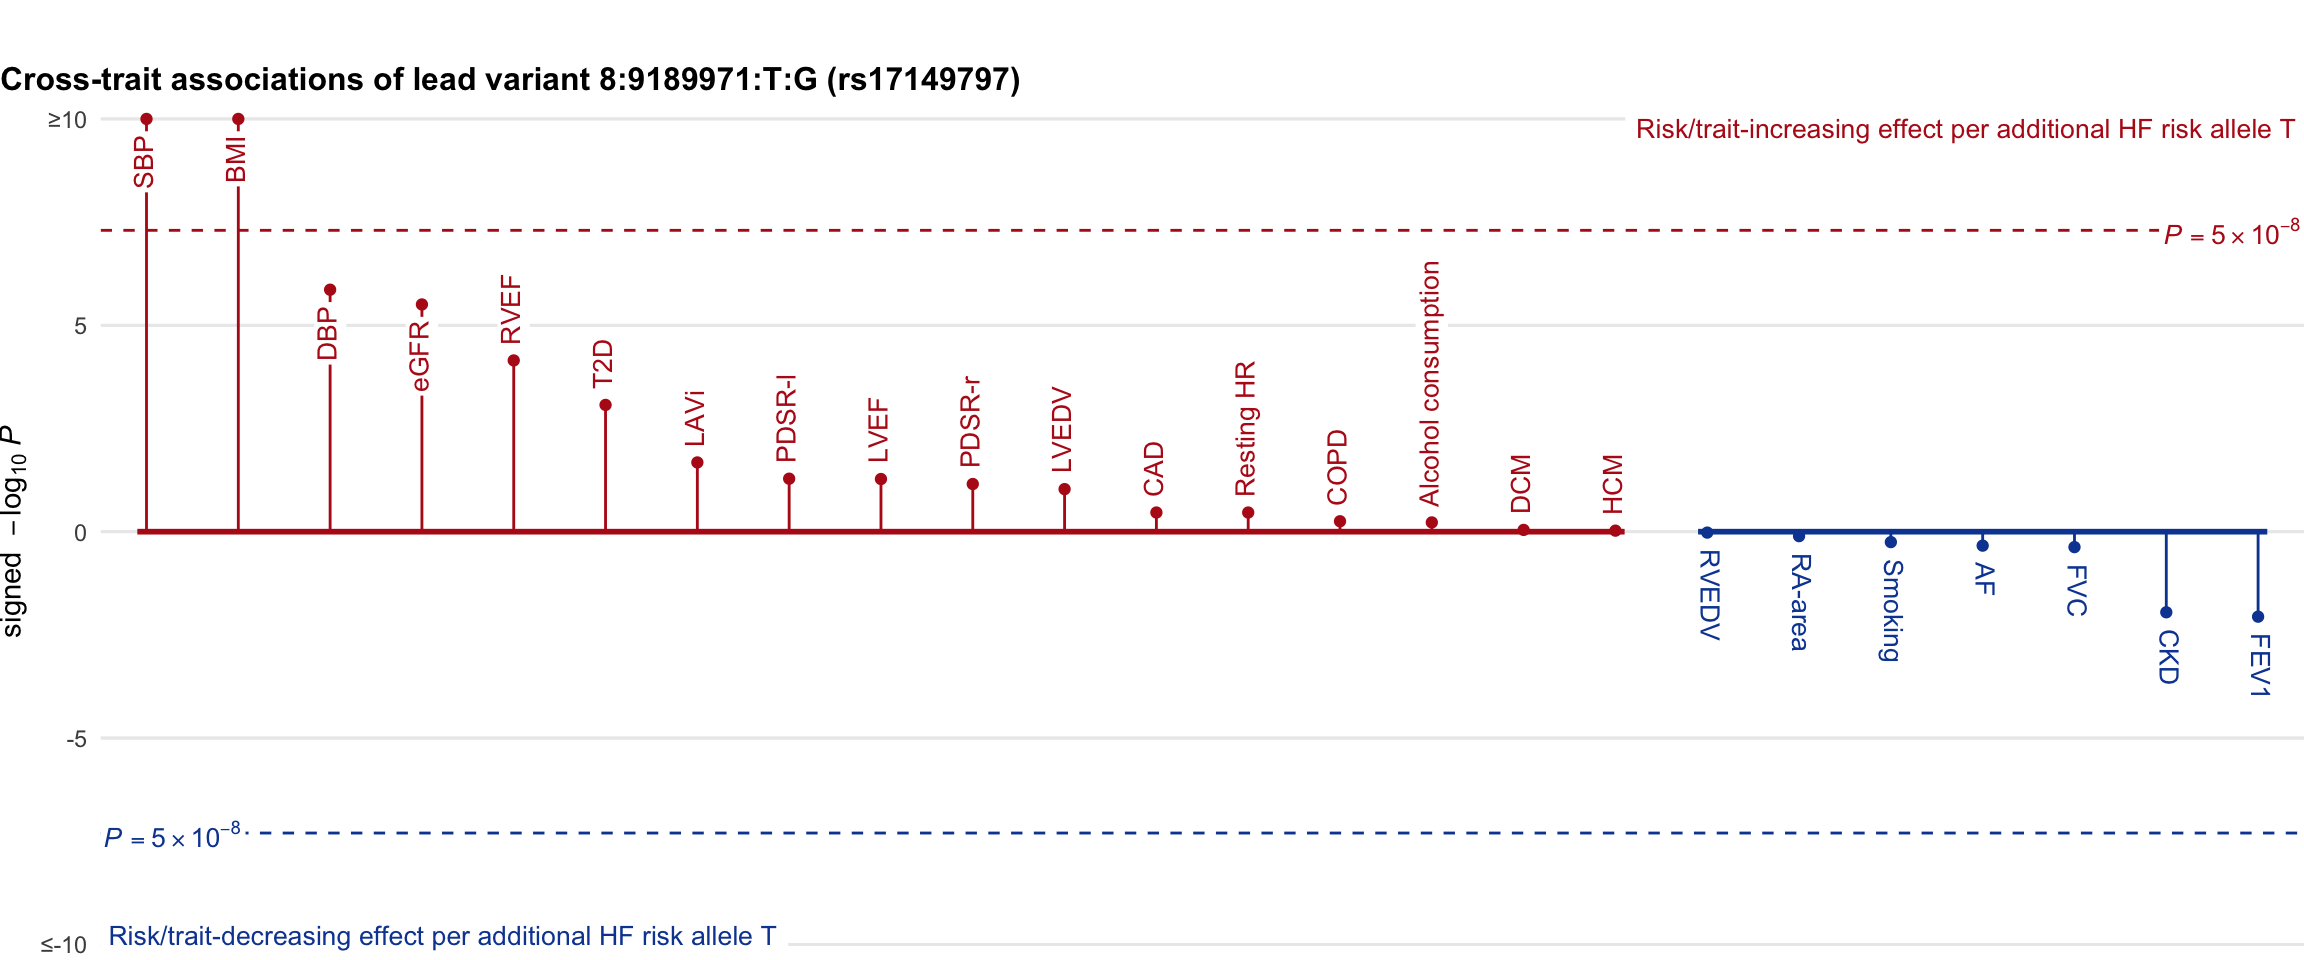
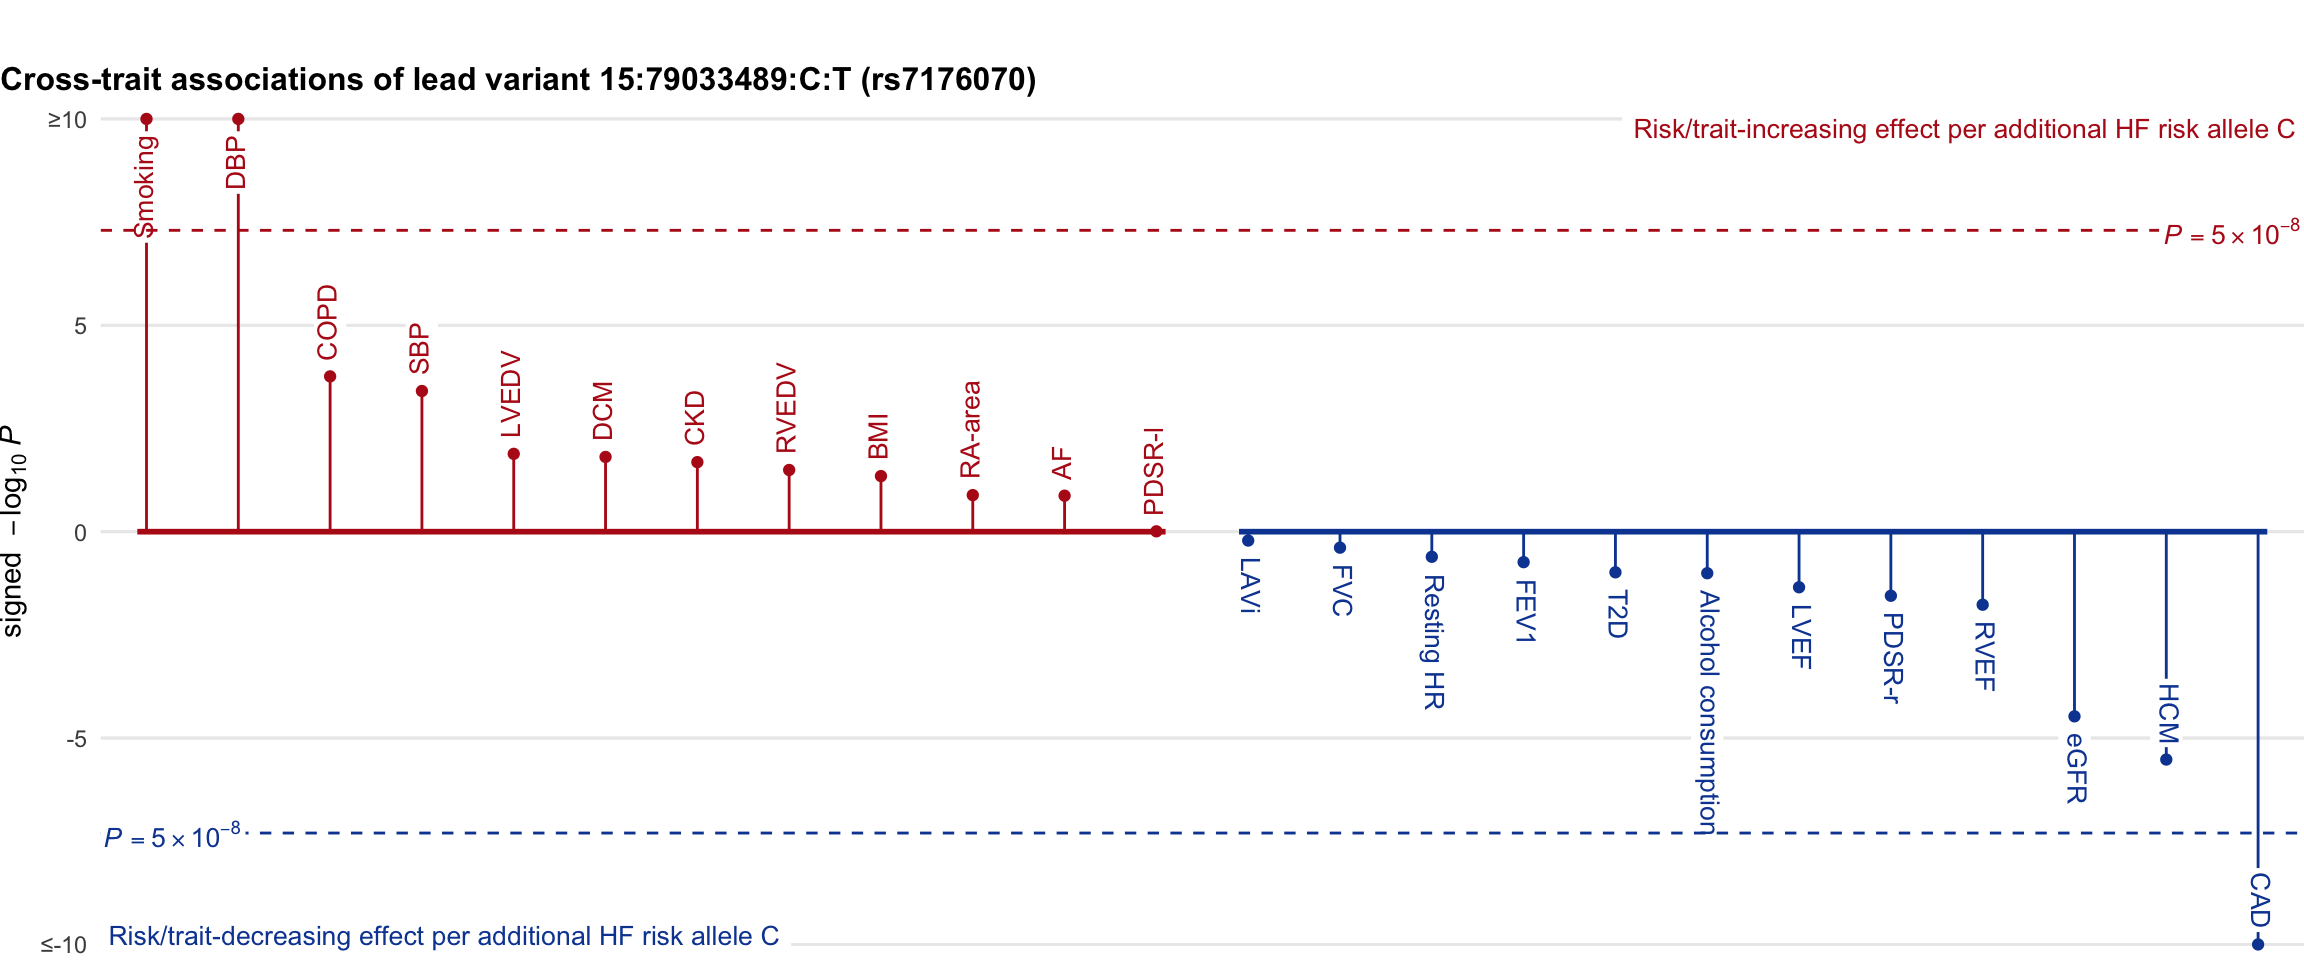
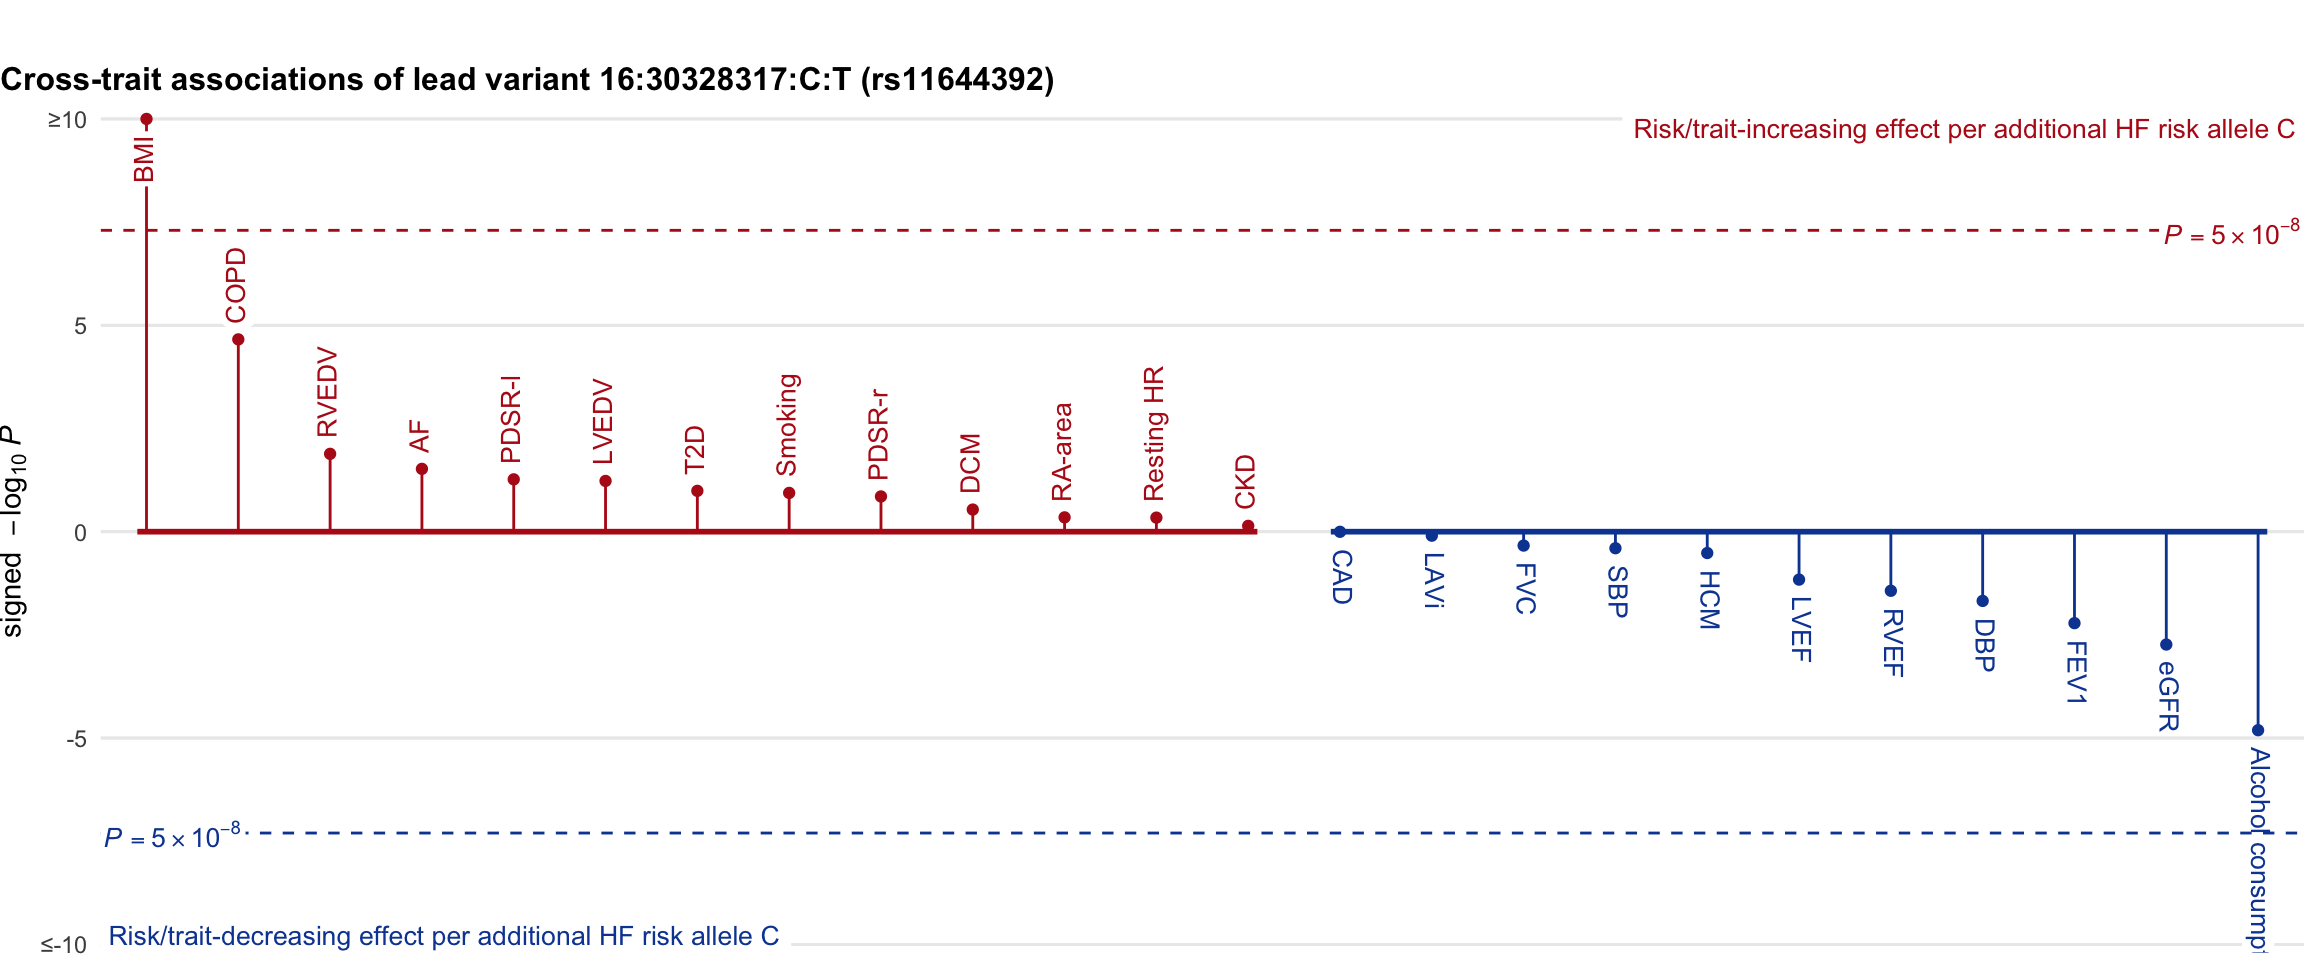
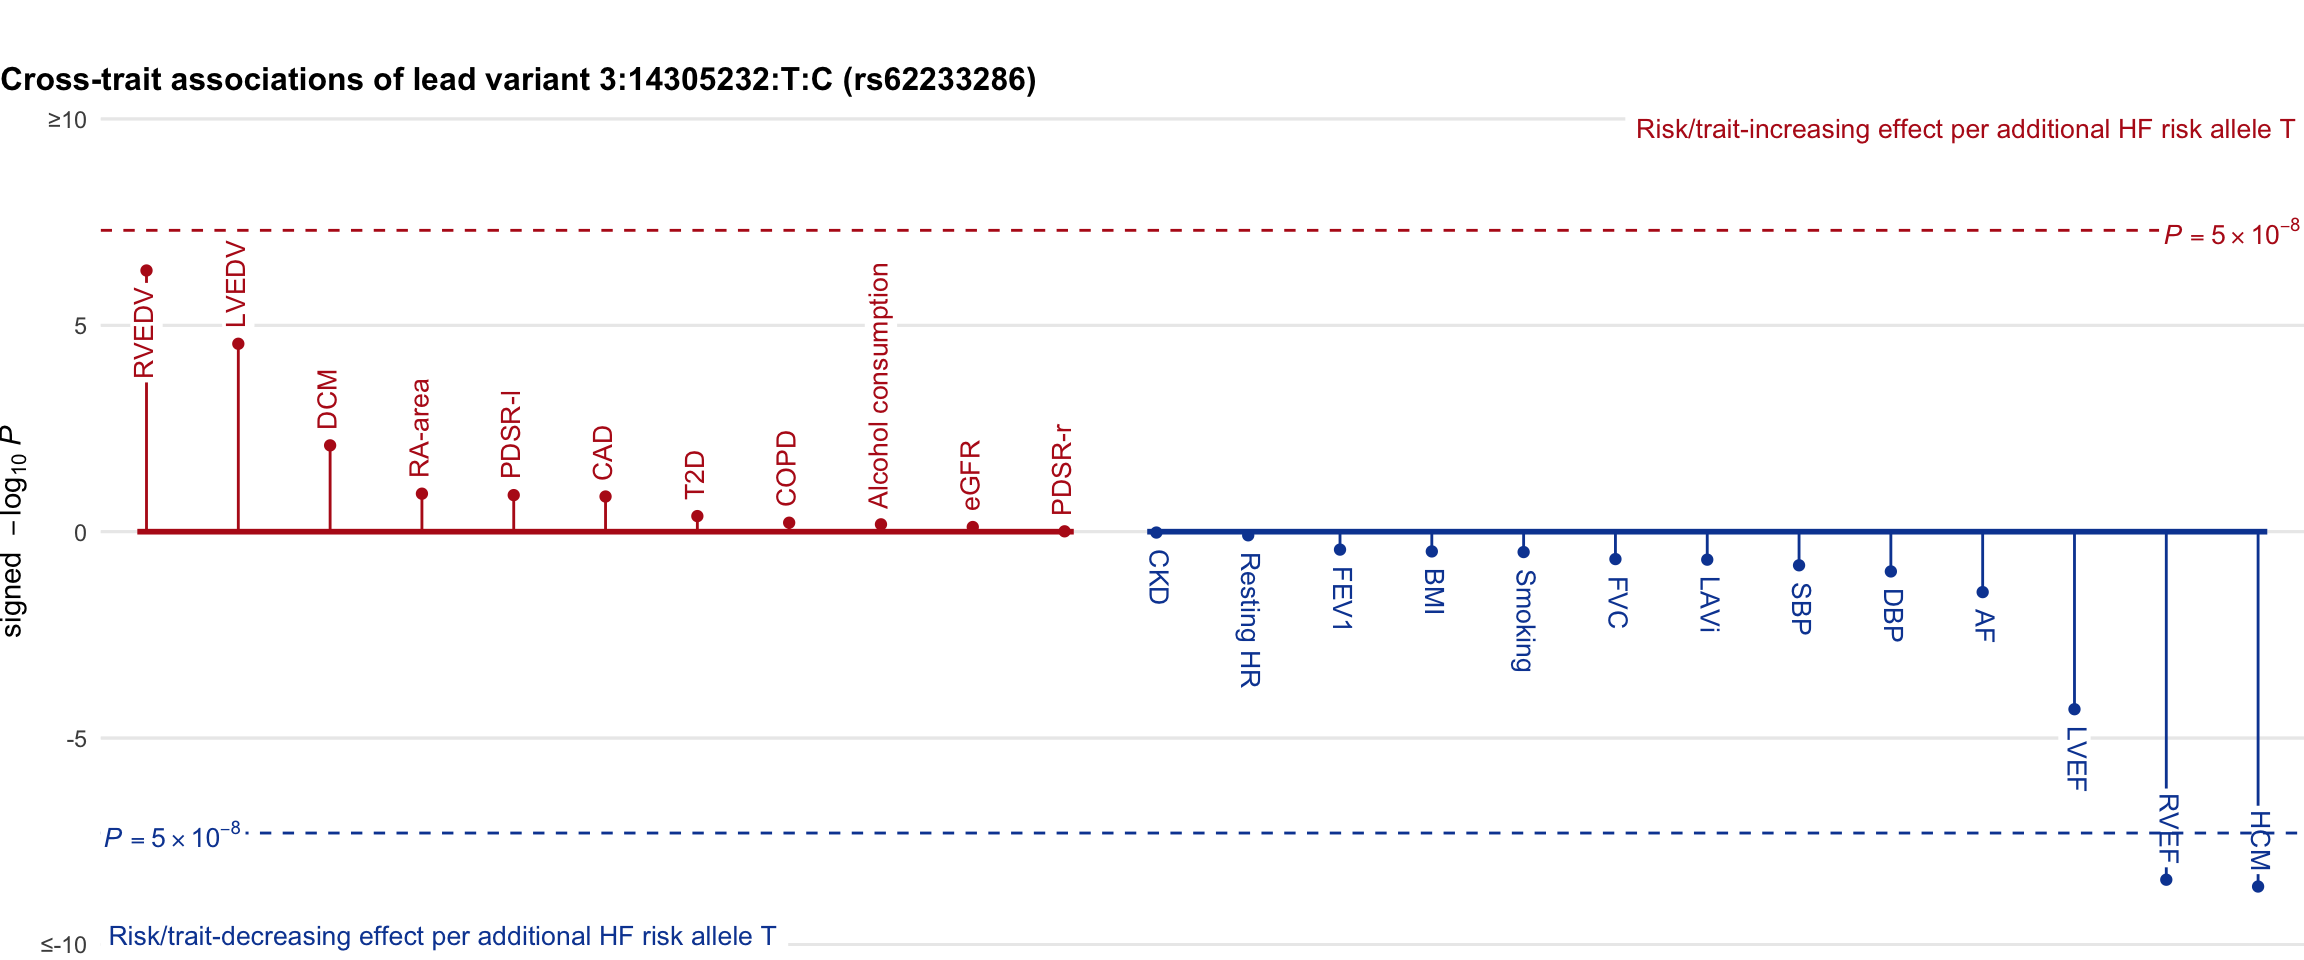
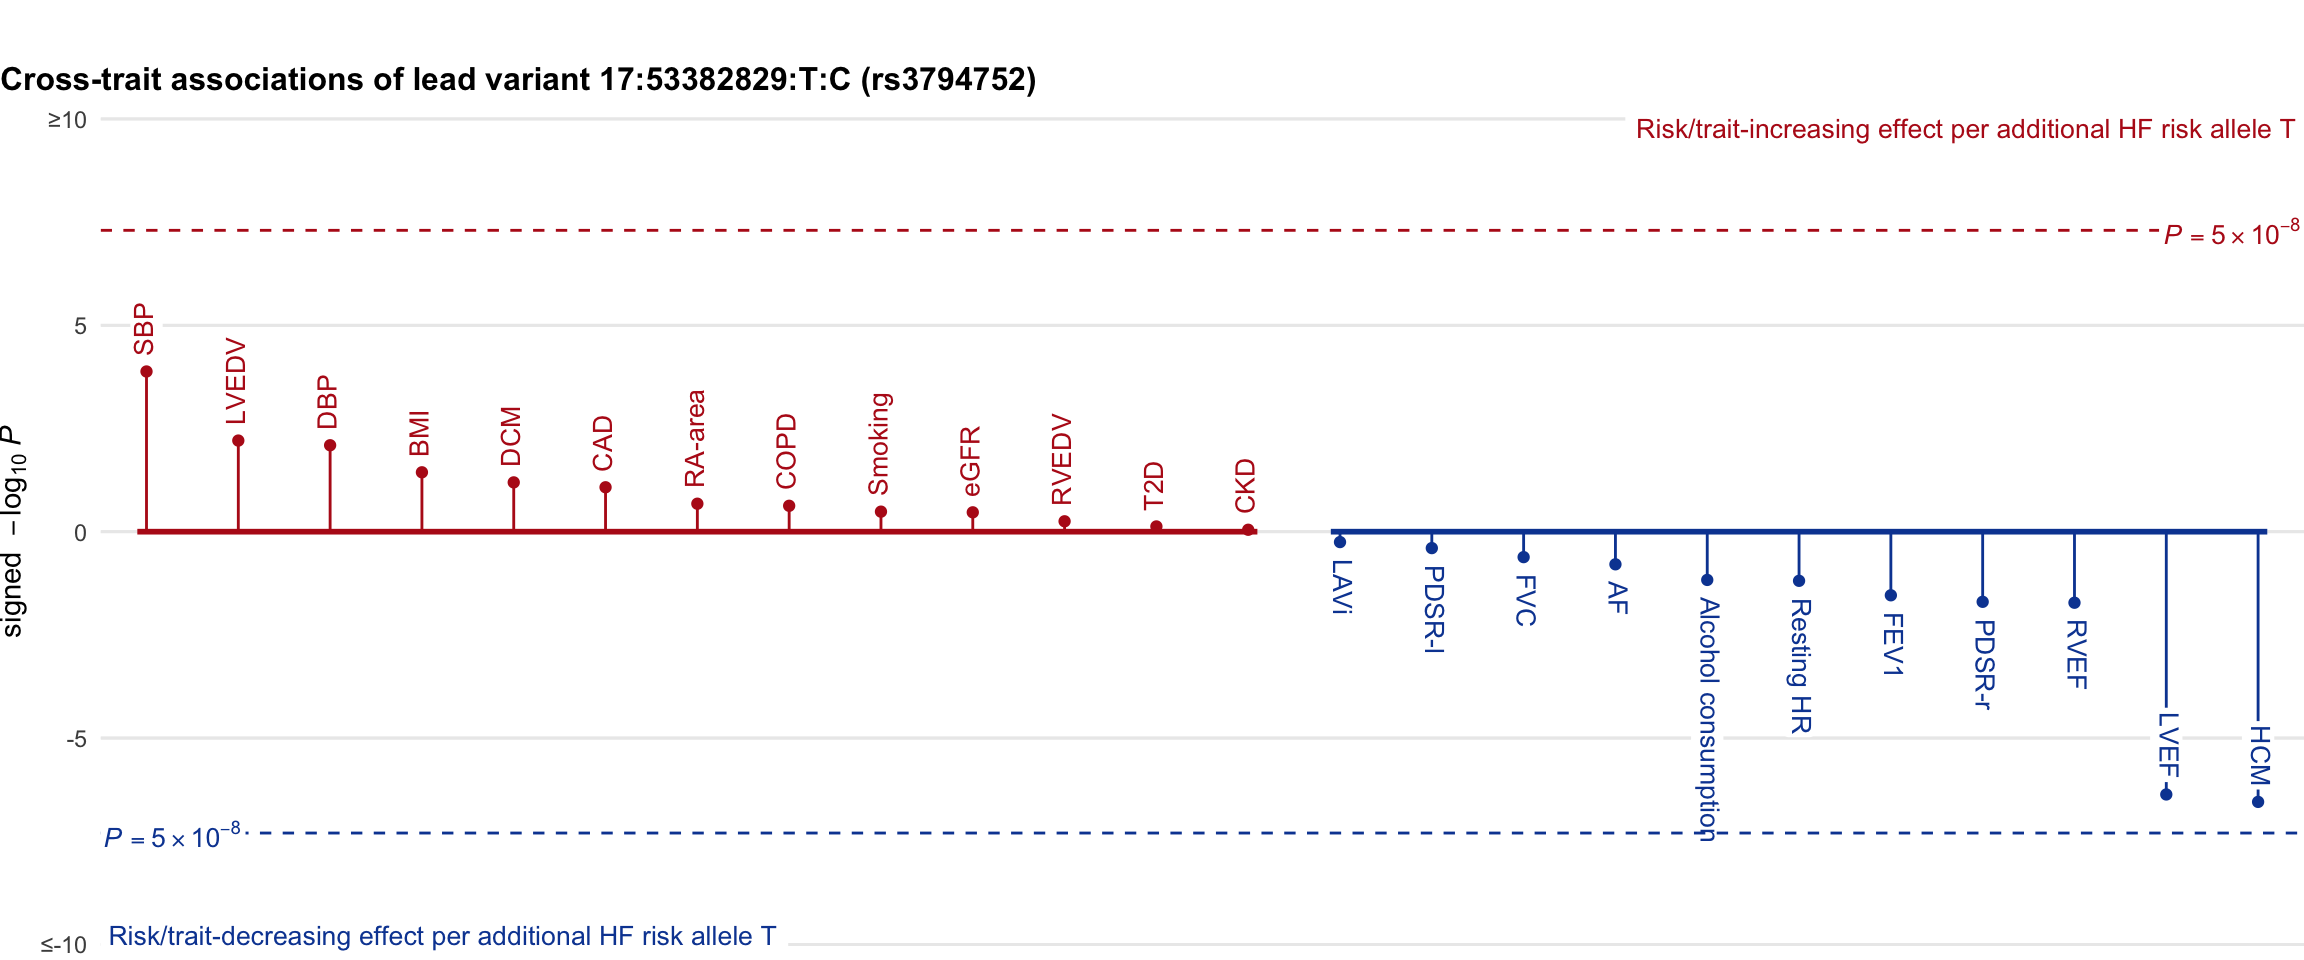
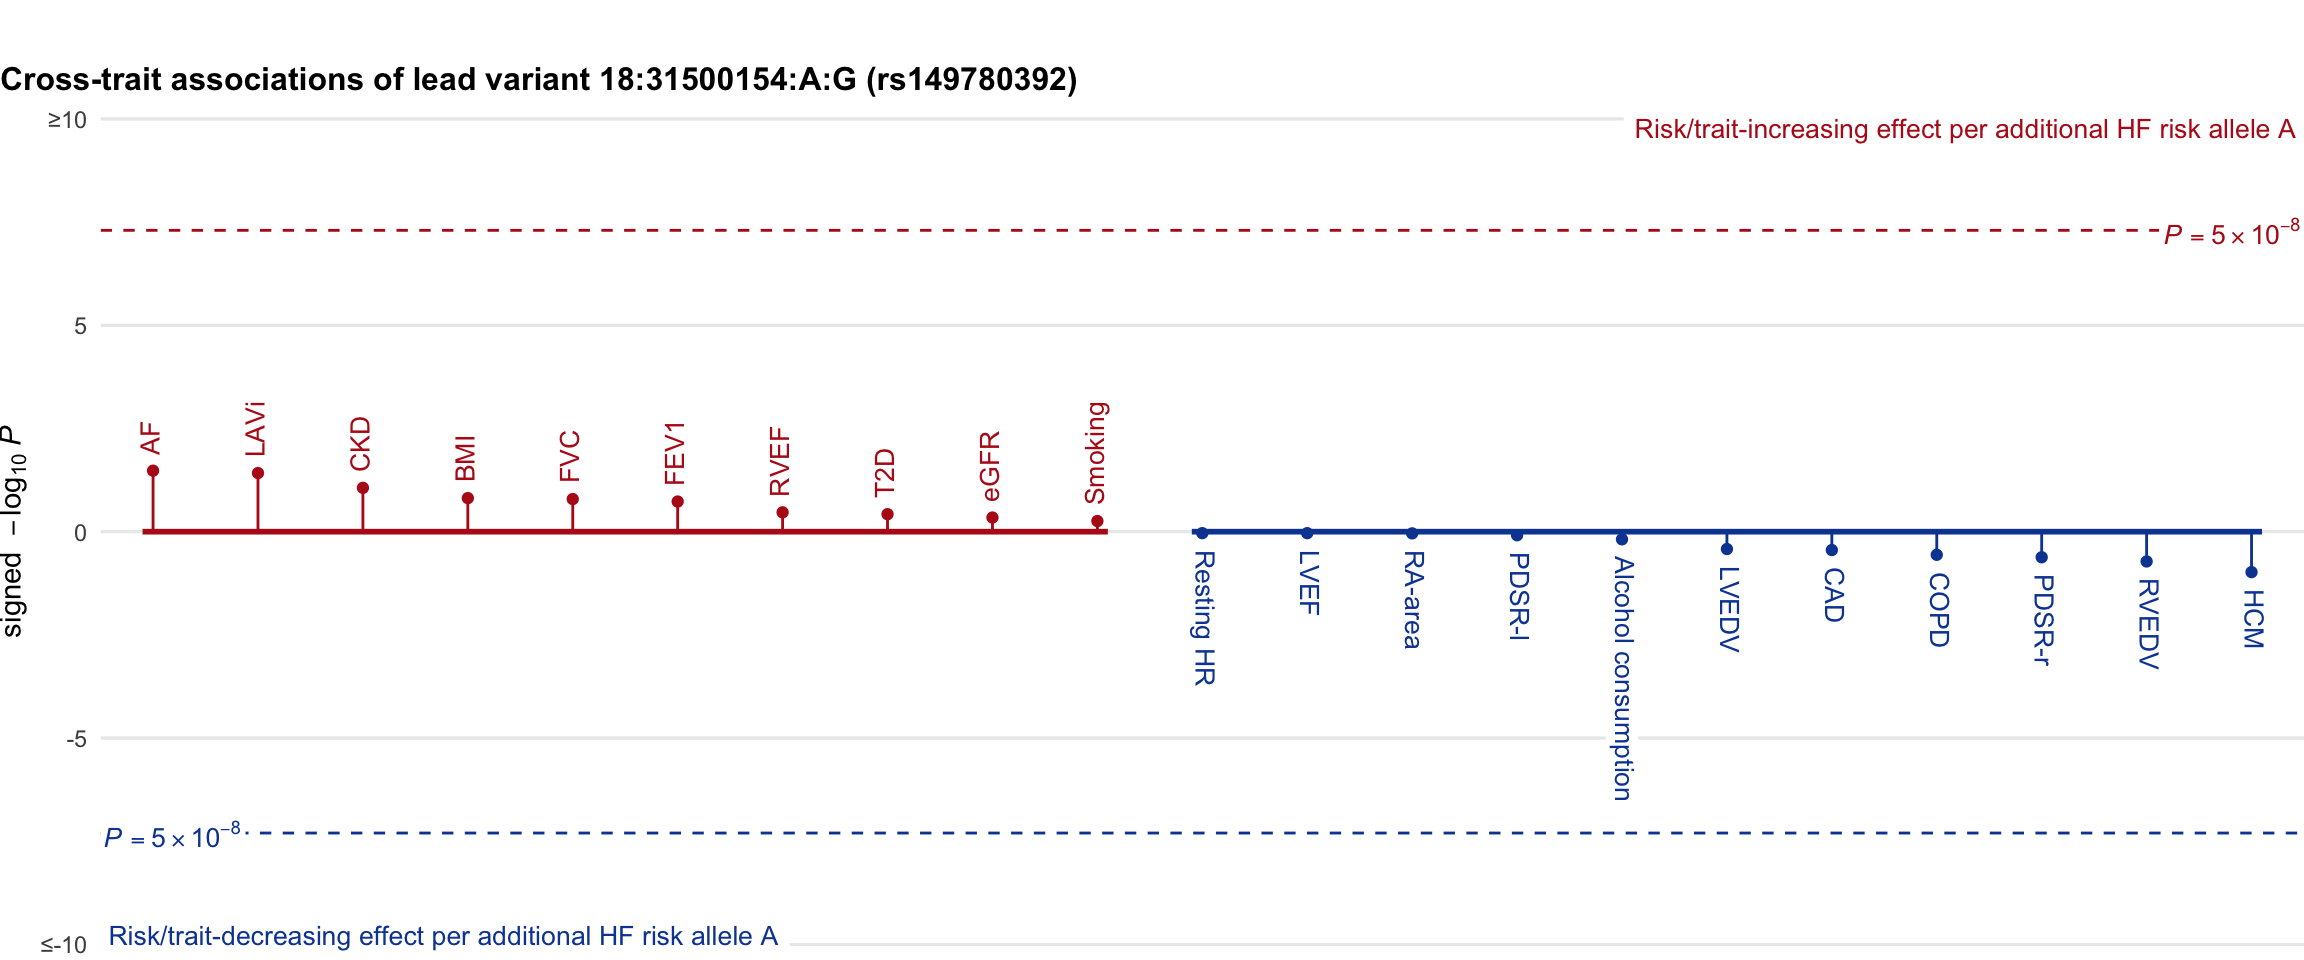
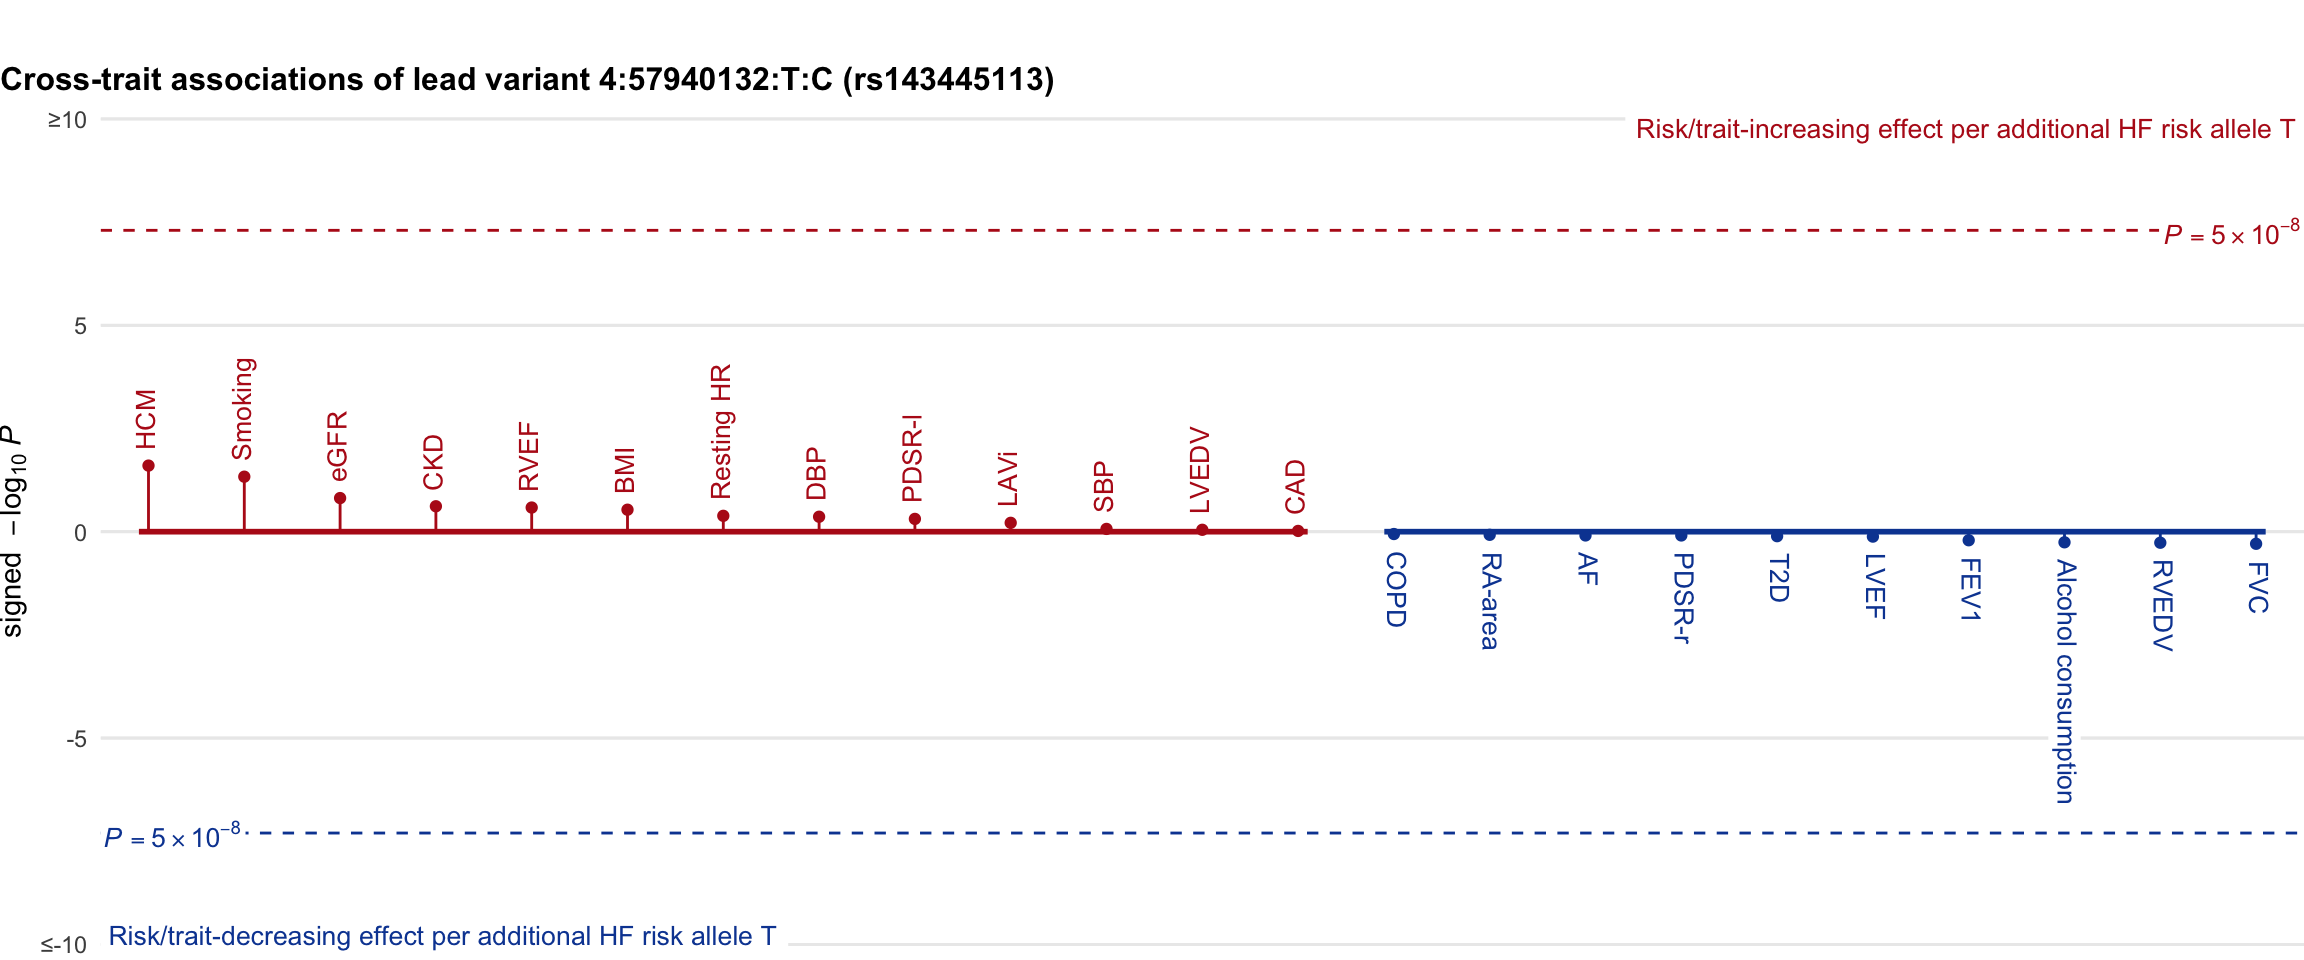
Cross-trait association
Genetic associations of lead variant with HF-related traits, sorted in descending order by \(-log_{10}P \times sign(\beta)\); where \(P\) represents \(P\) value for genetic association with risk / trait, and \(\beta\) represents effect size per additional HF risk allele. Where lead variant is absent in the trait GWAS, a proxy variant (LD \(R^2\) > 0.8 with & distance < 250kb from the lead variant) is used.
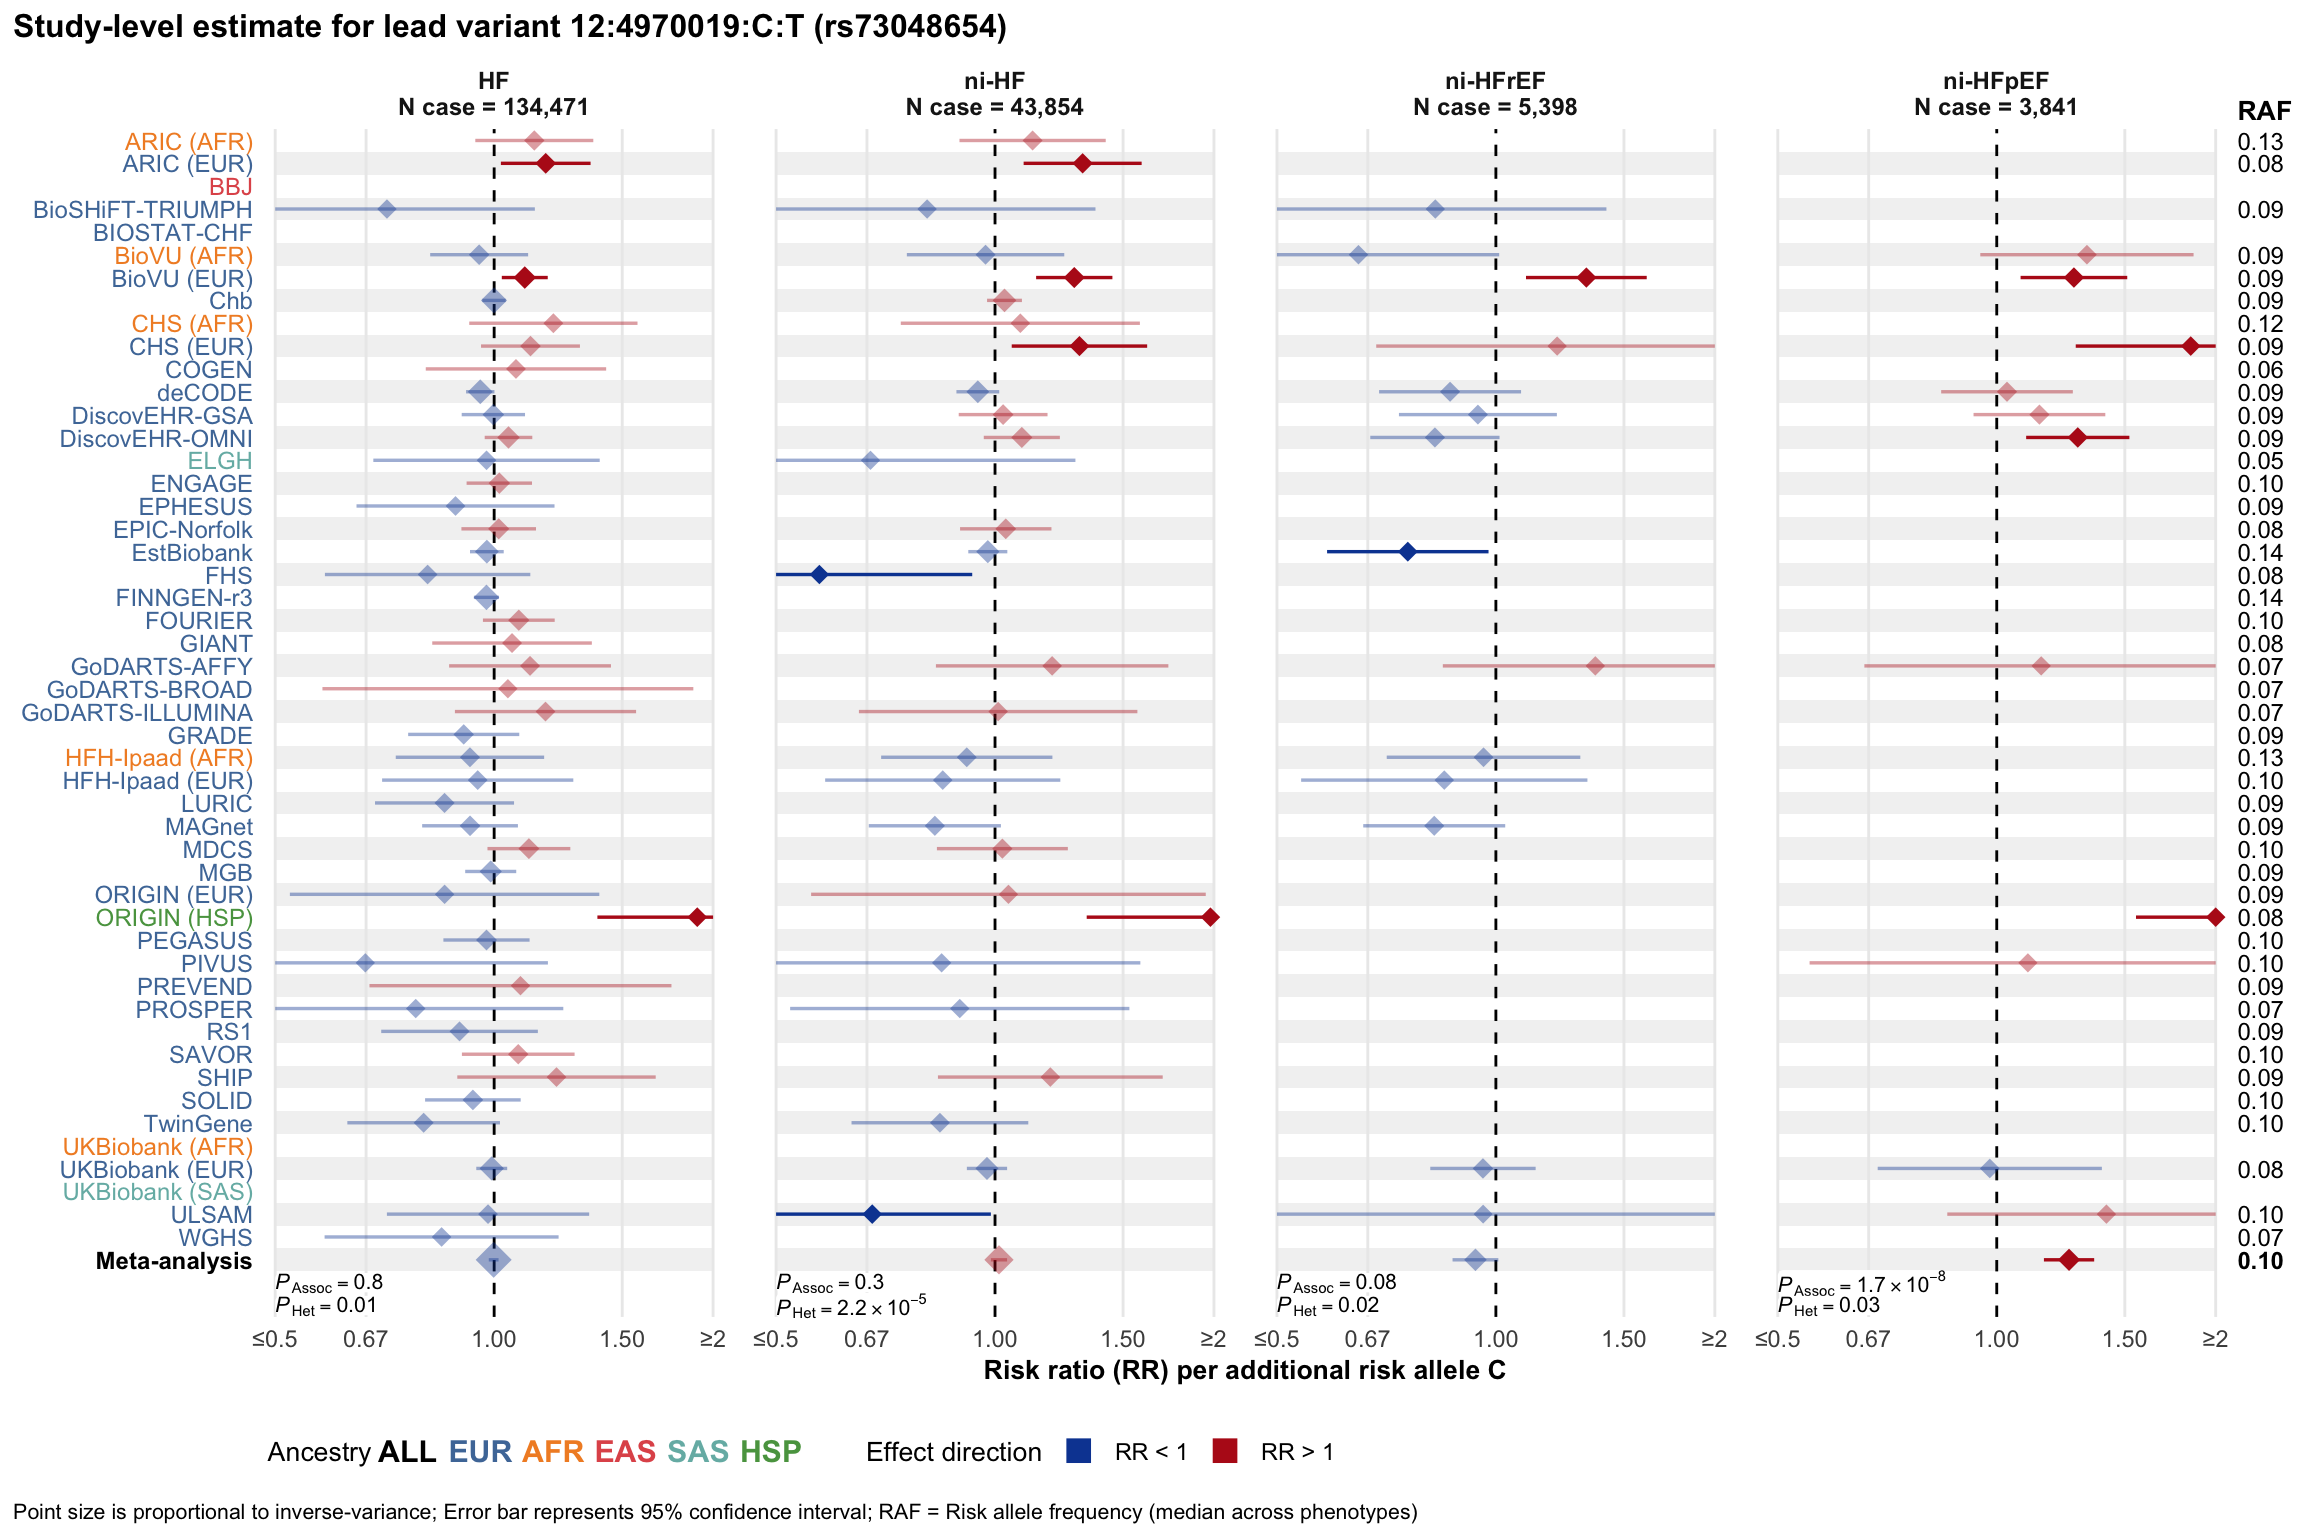
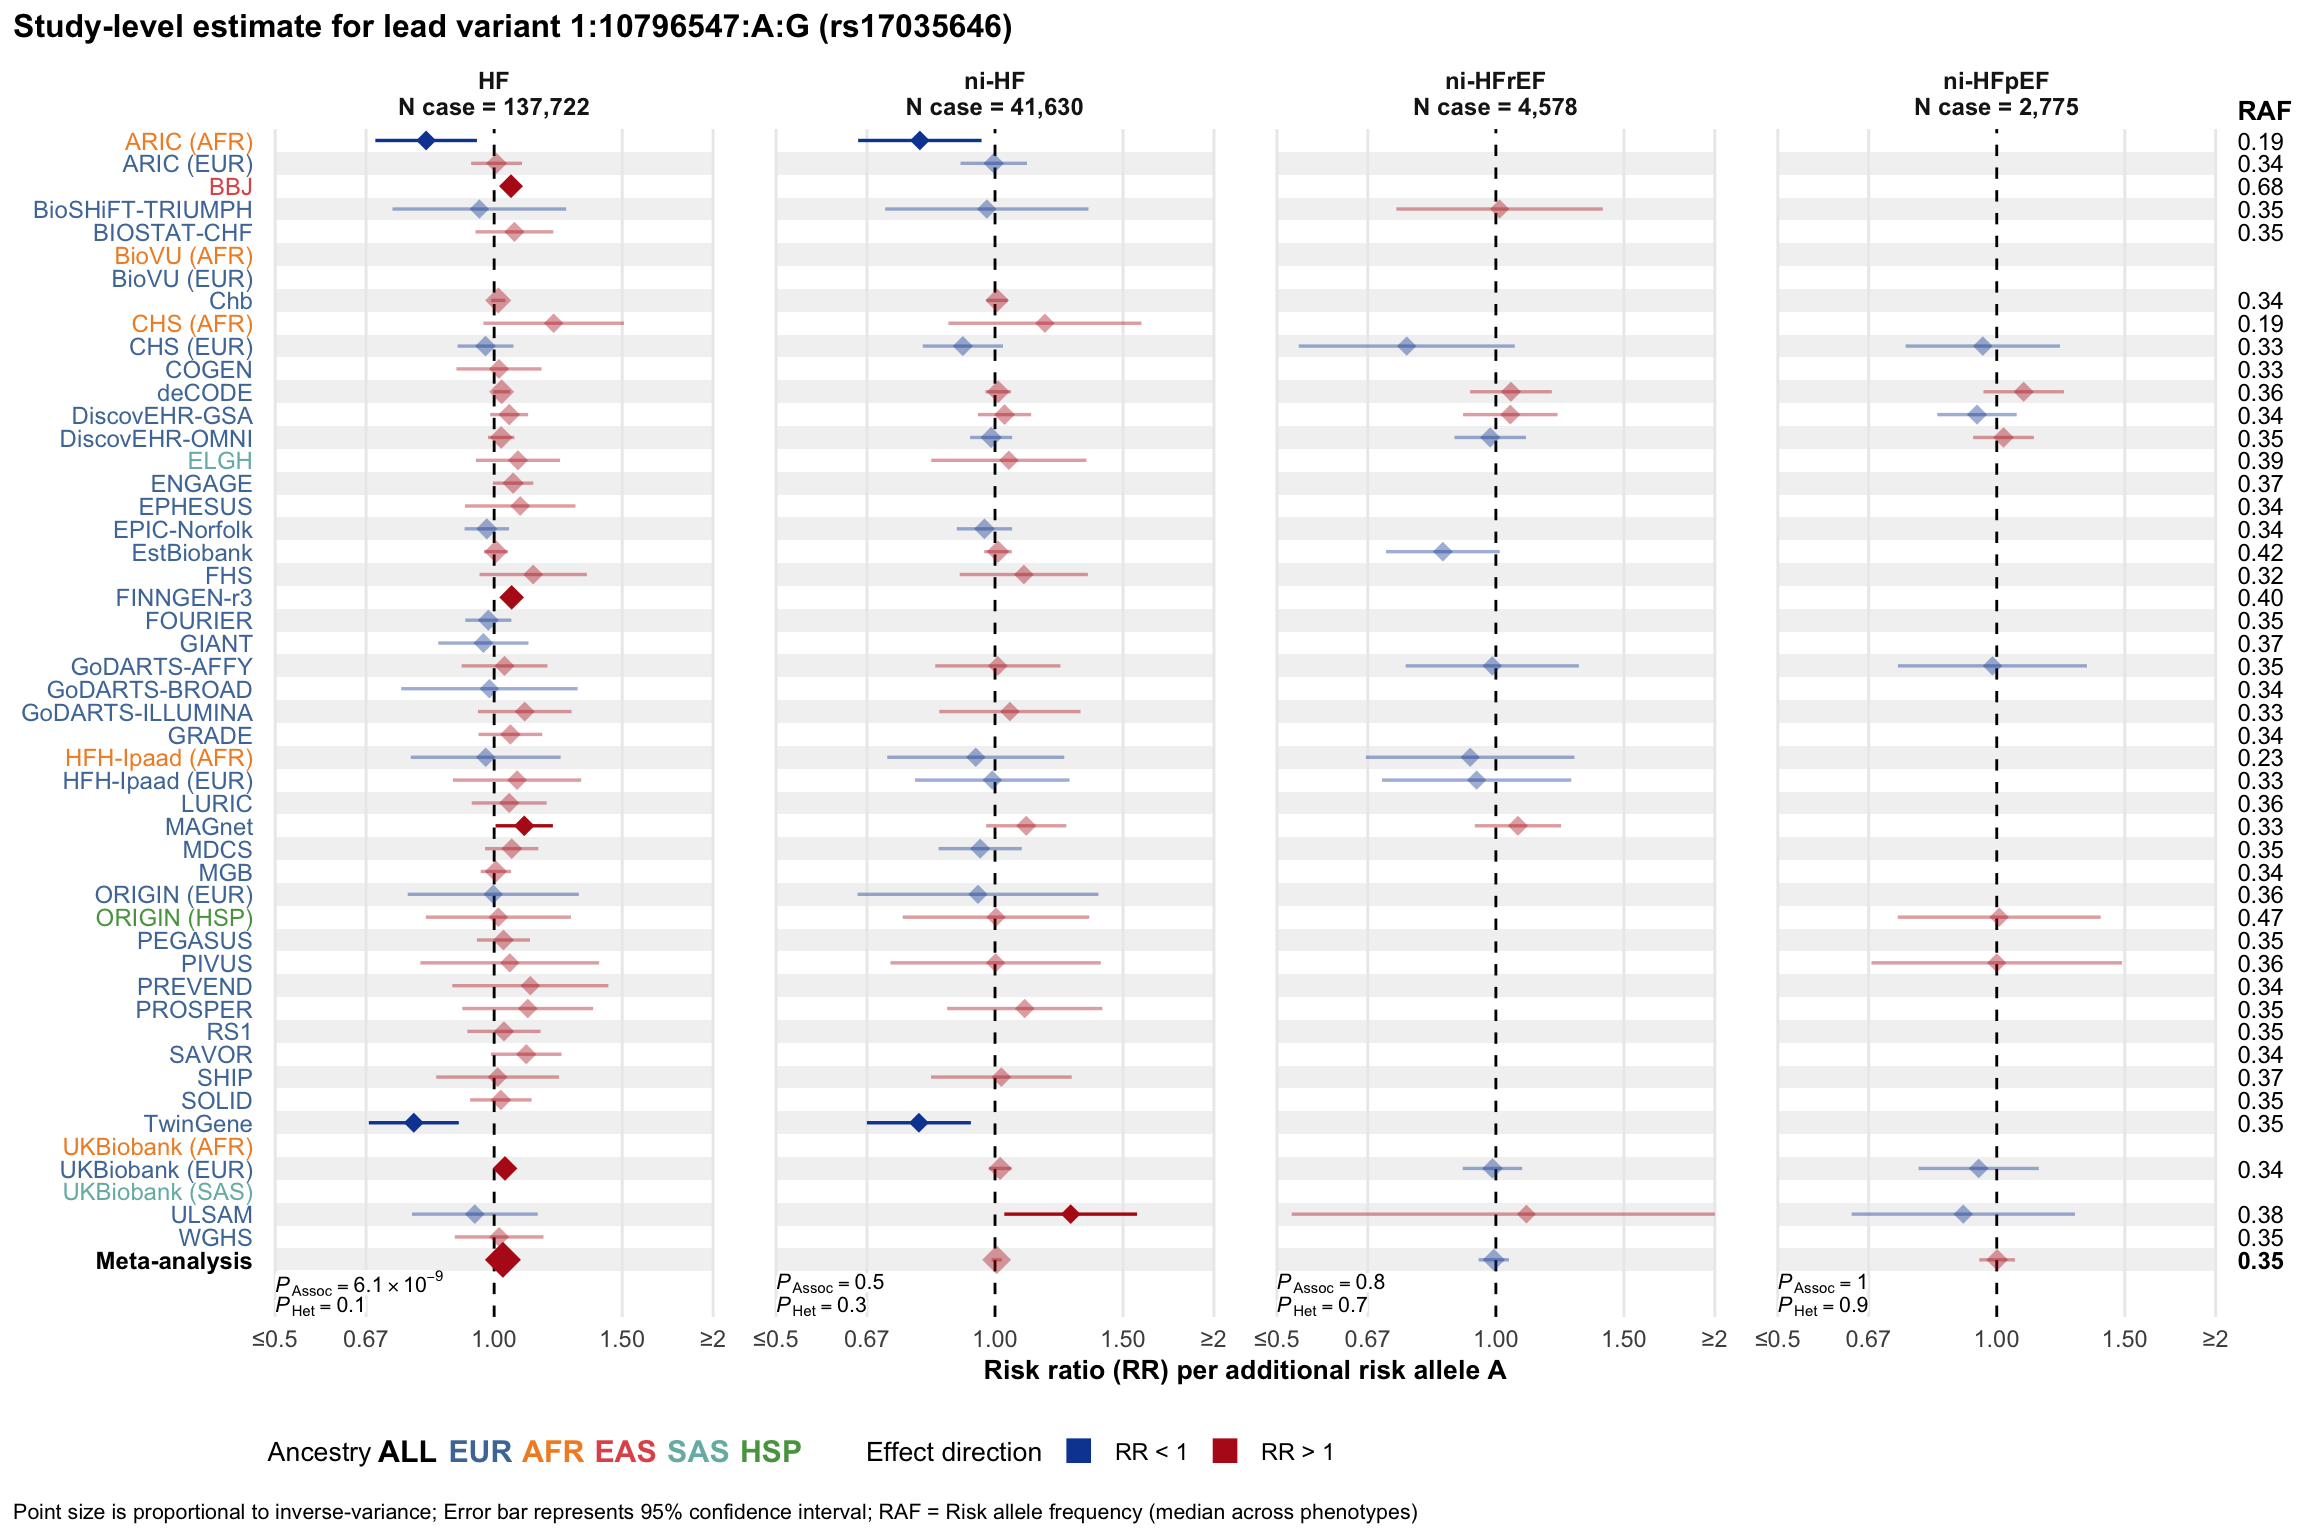
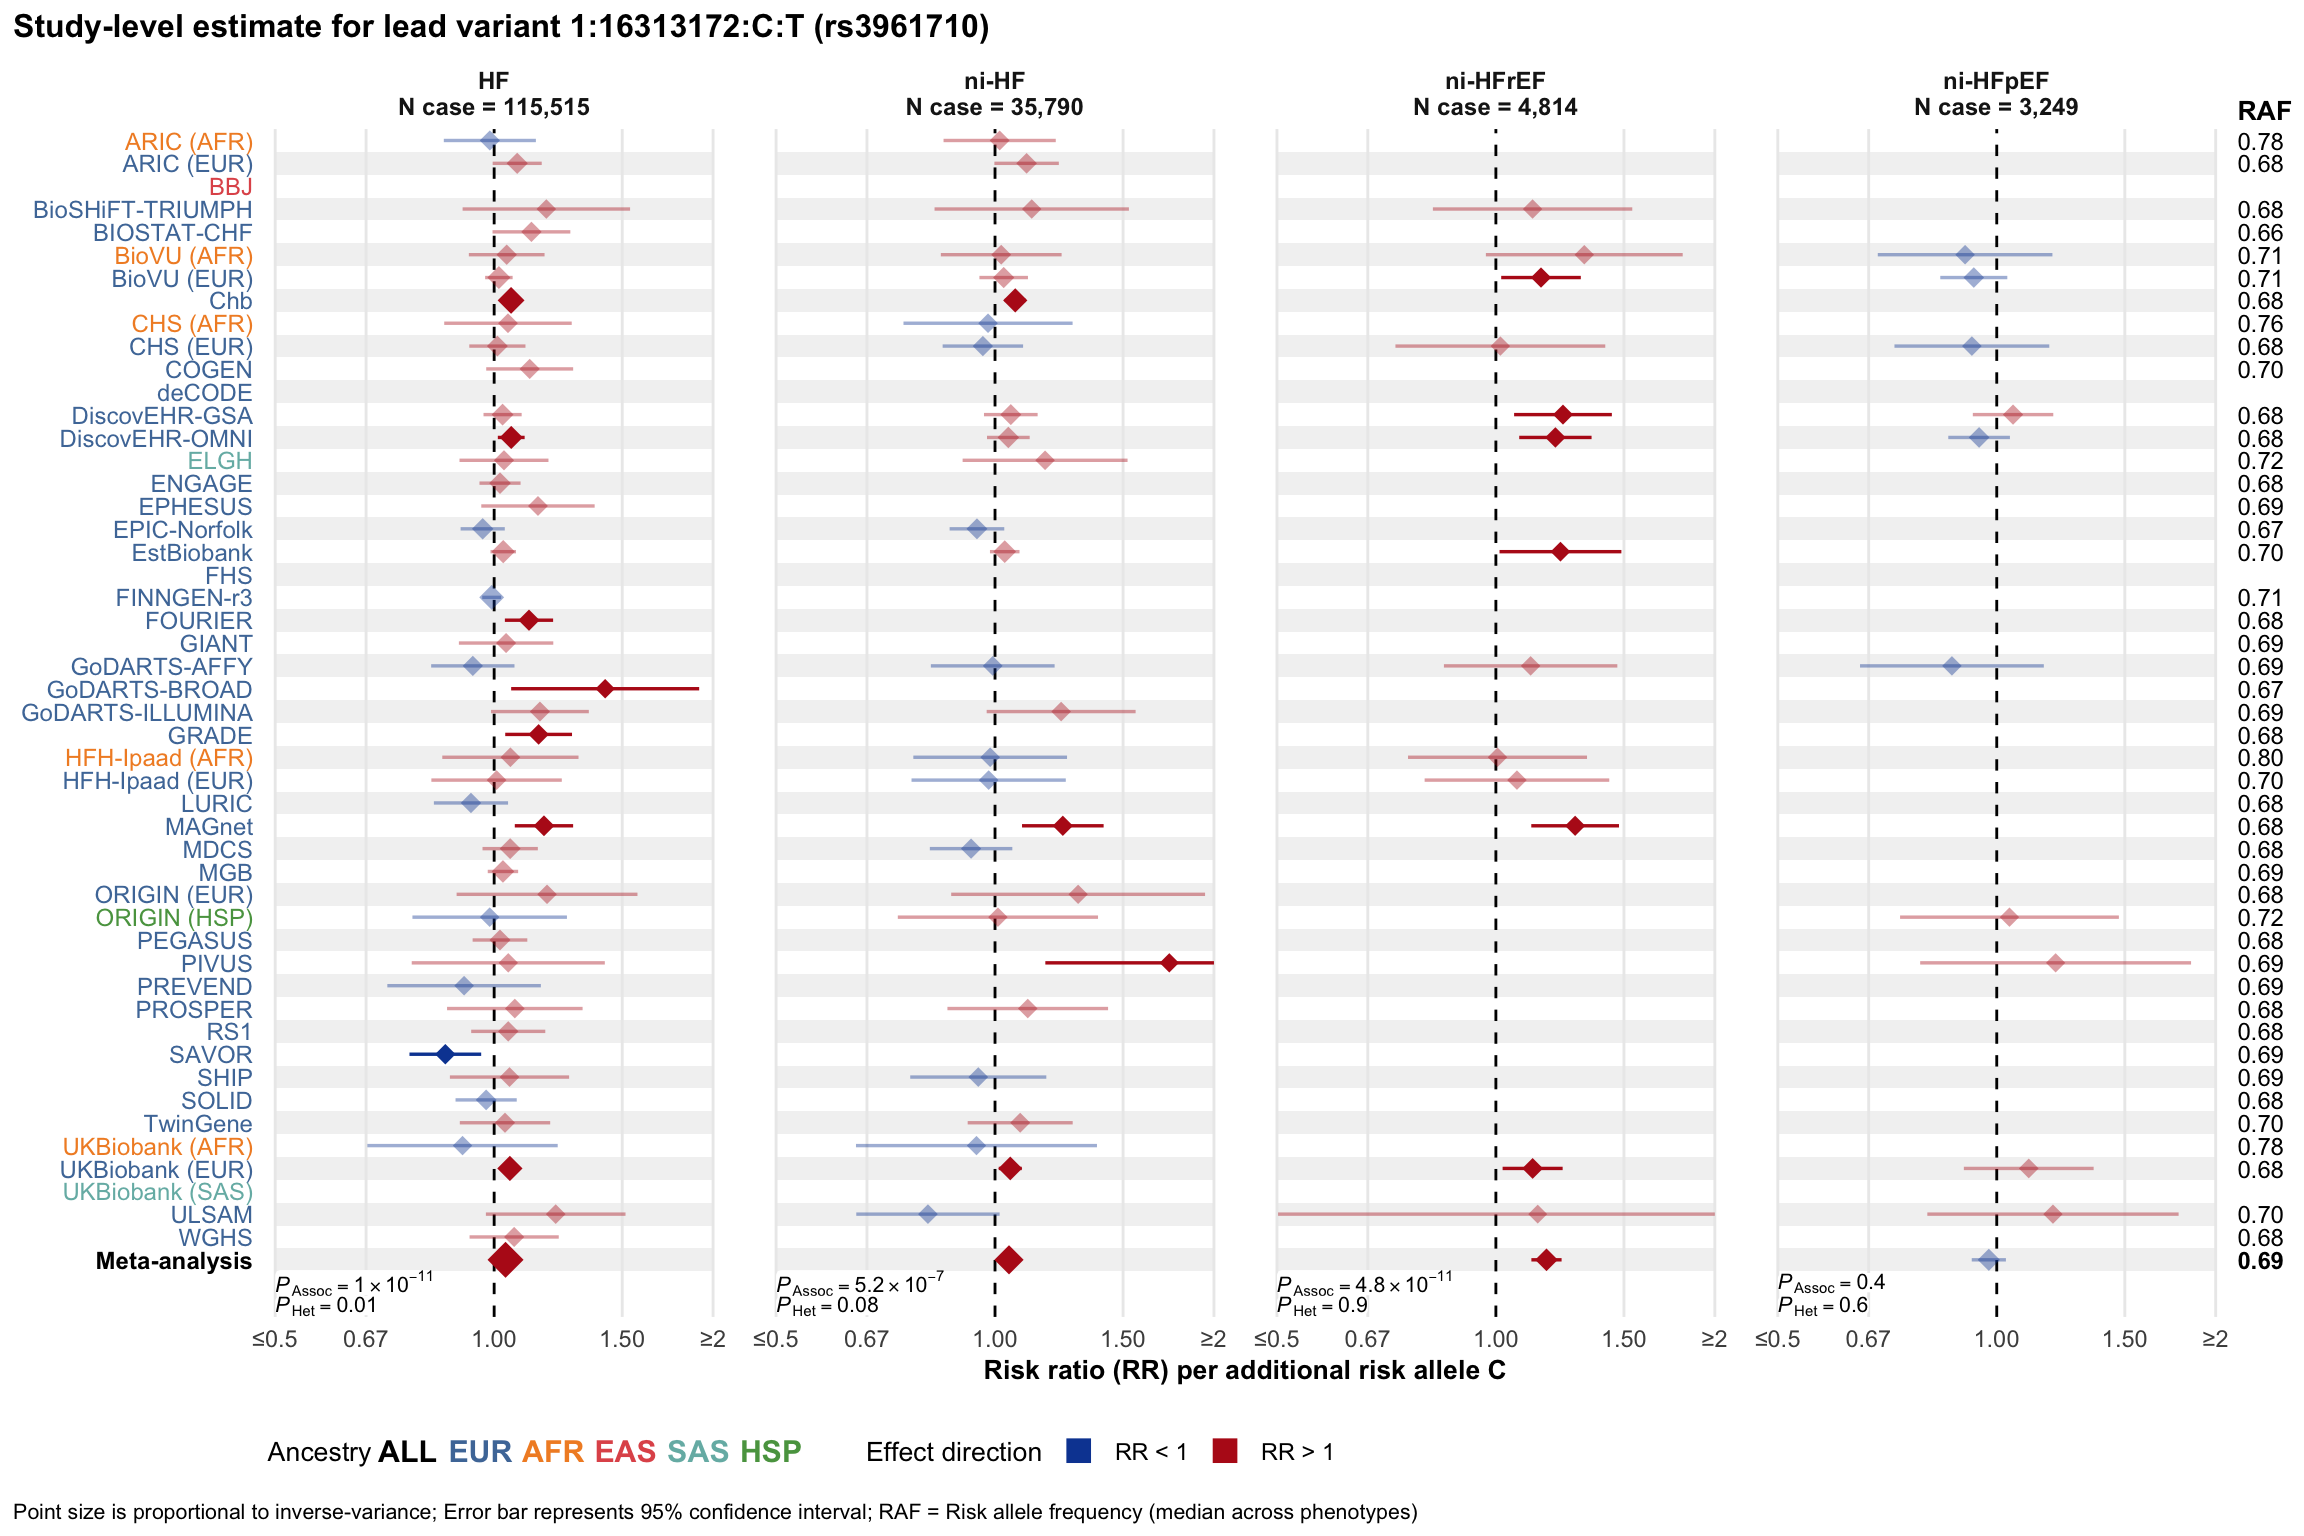
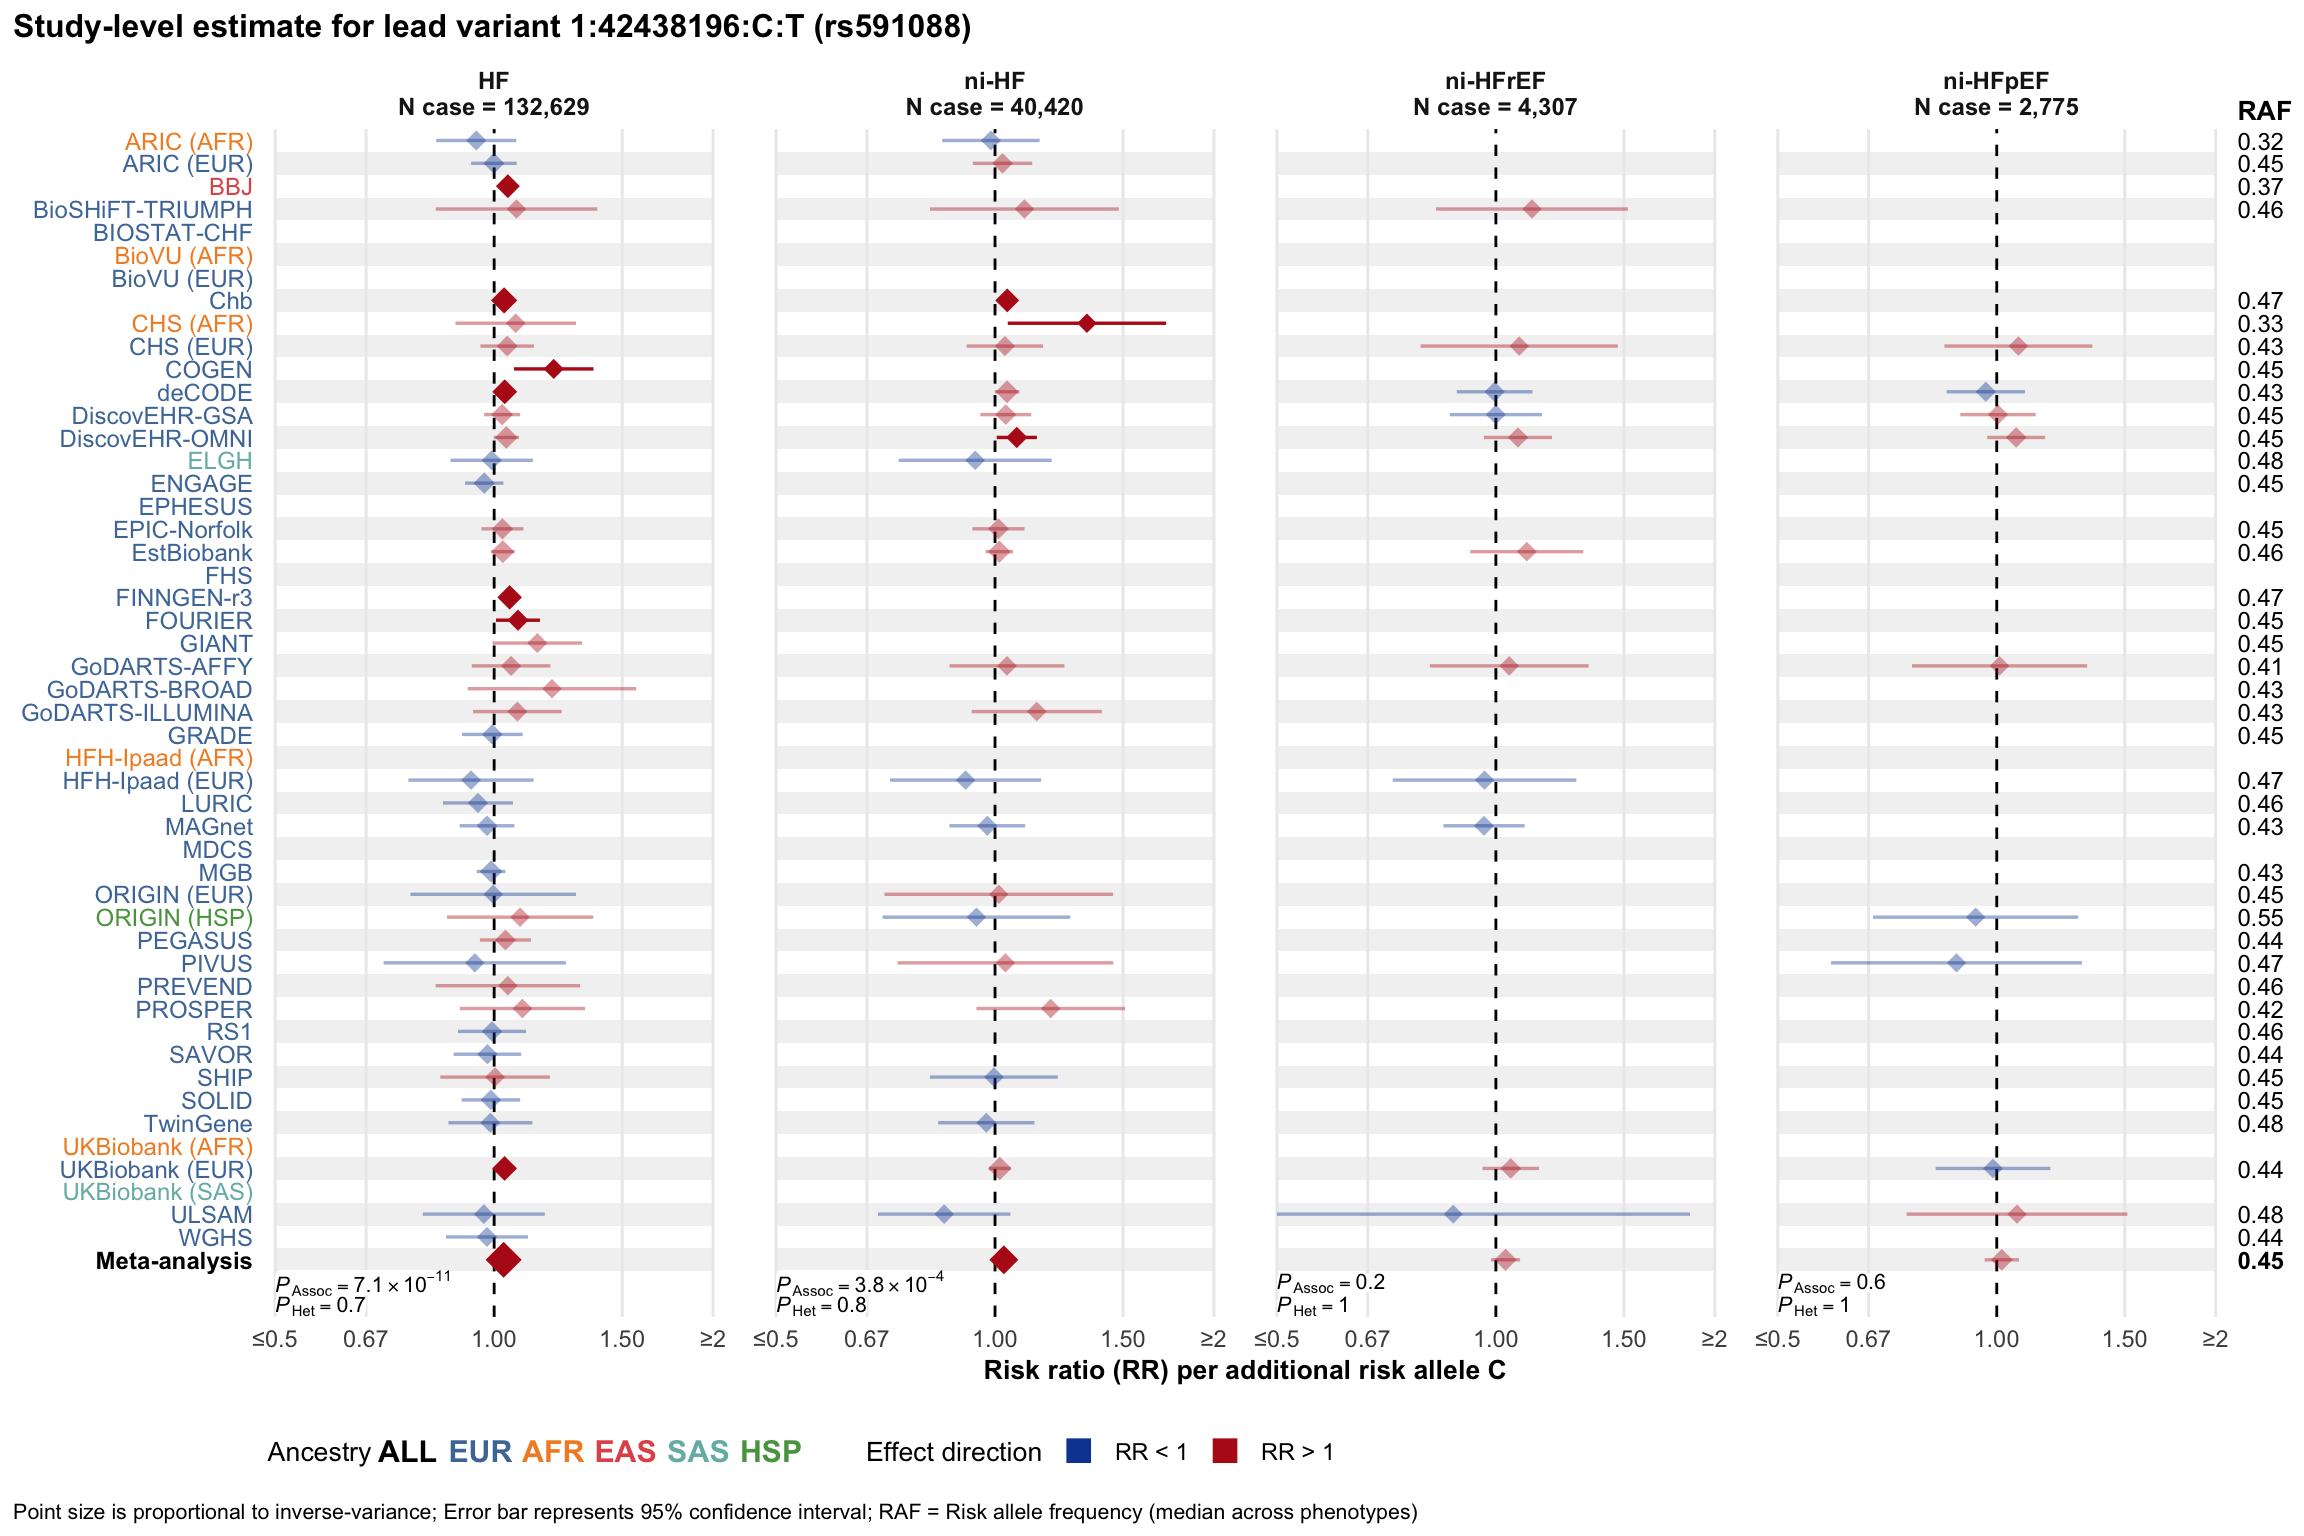
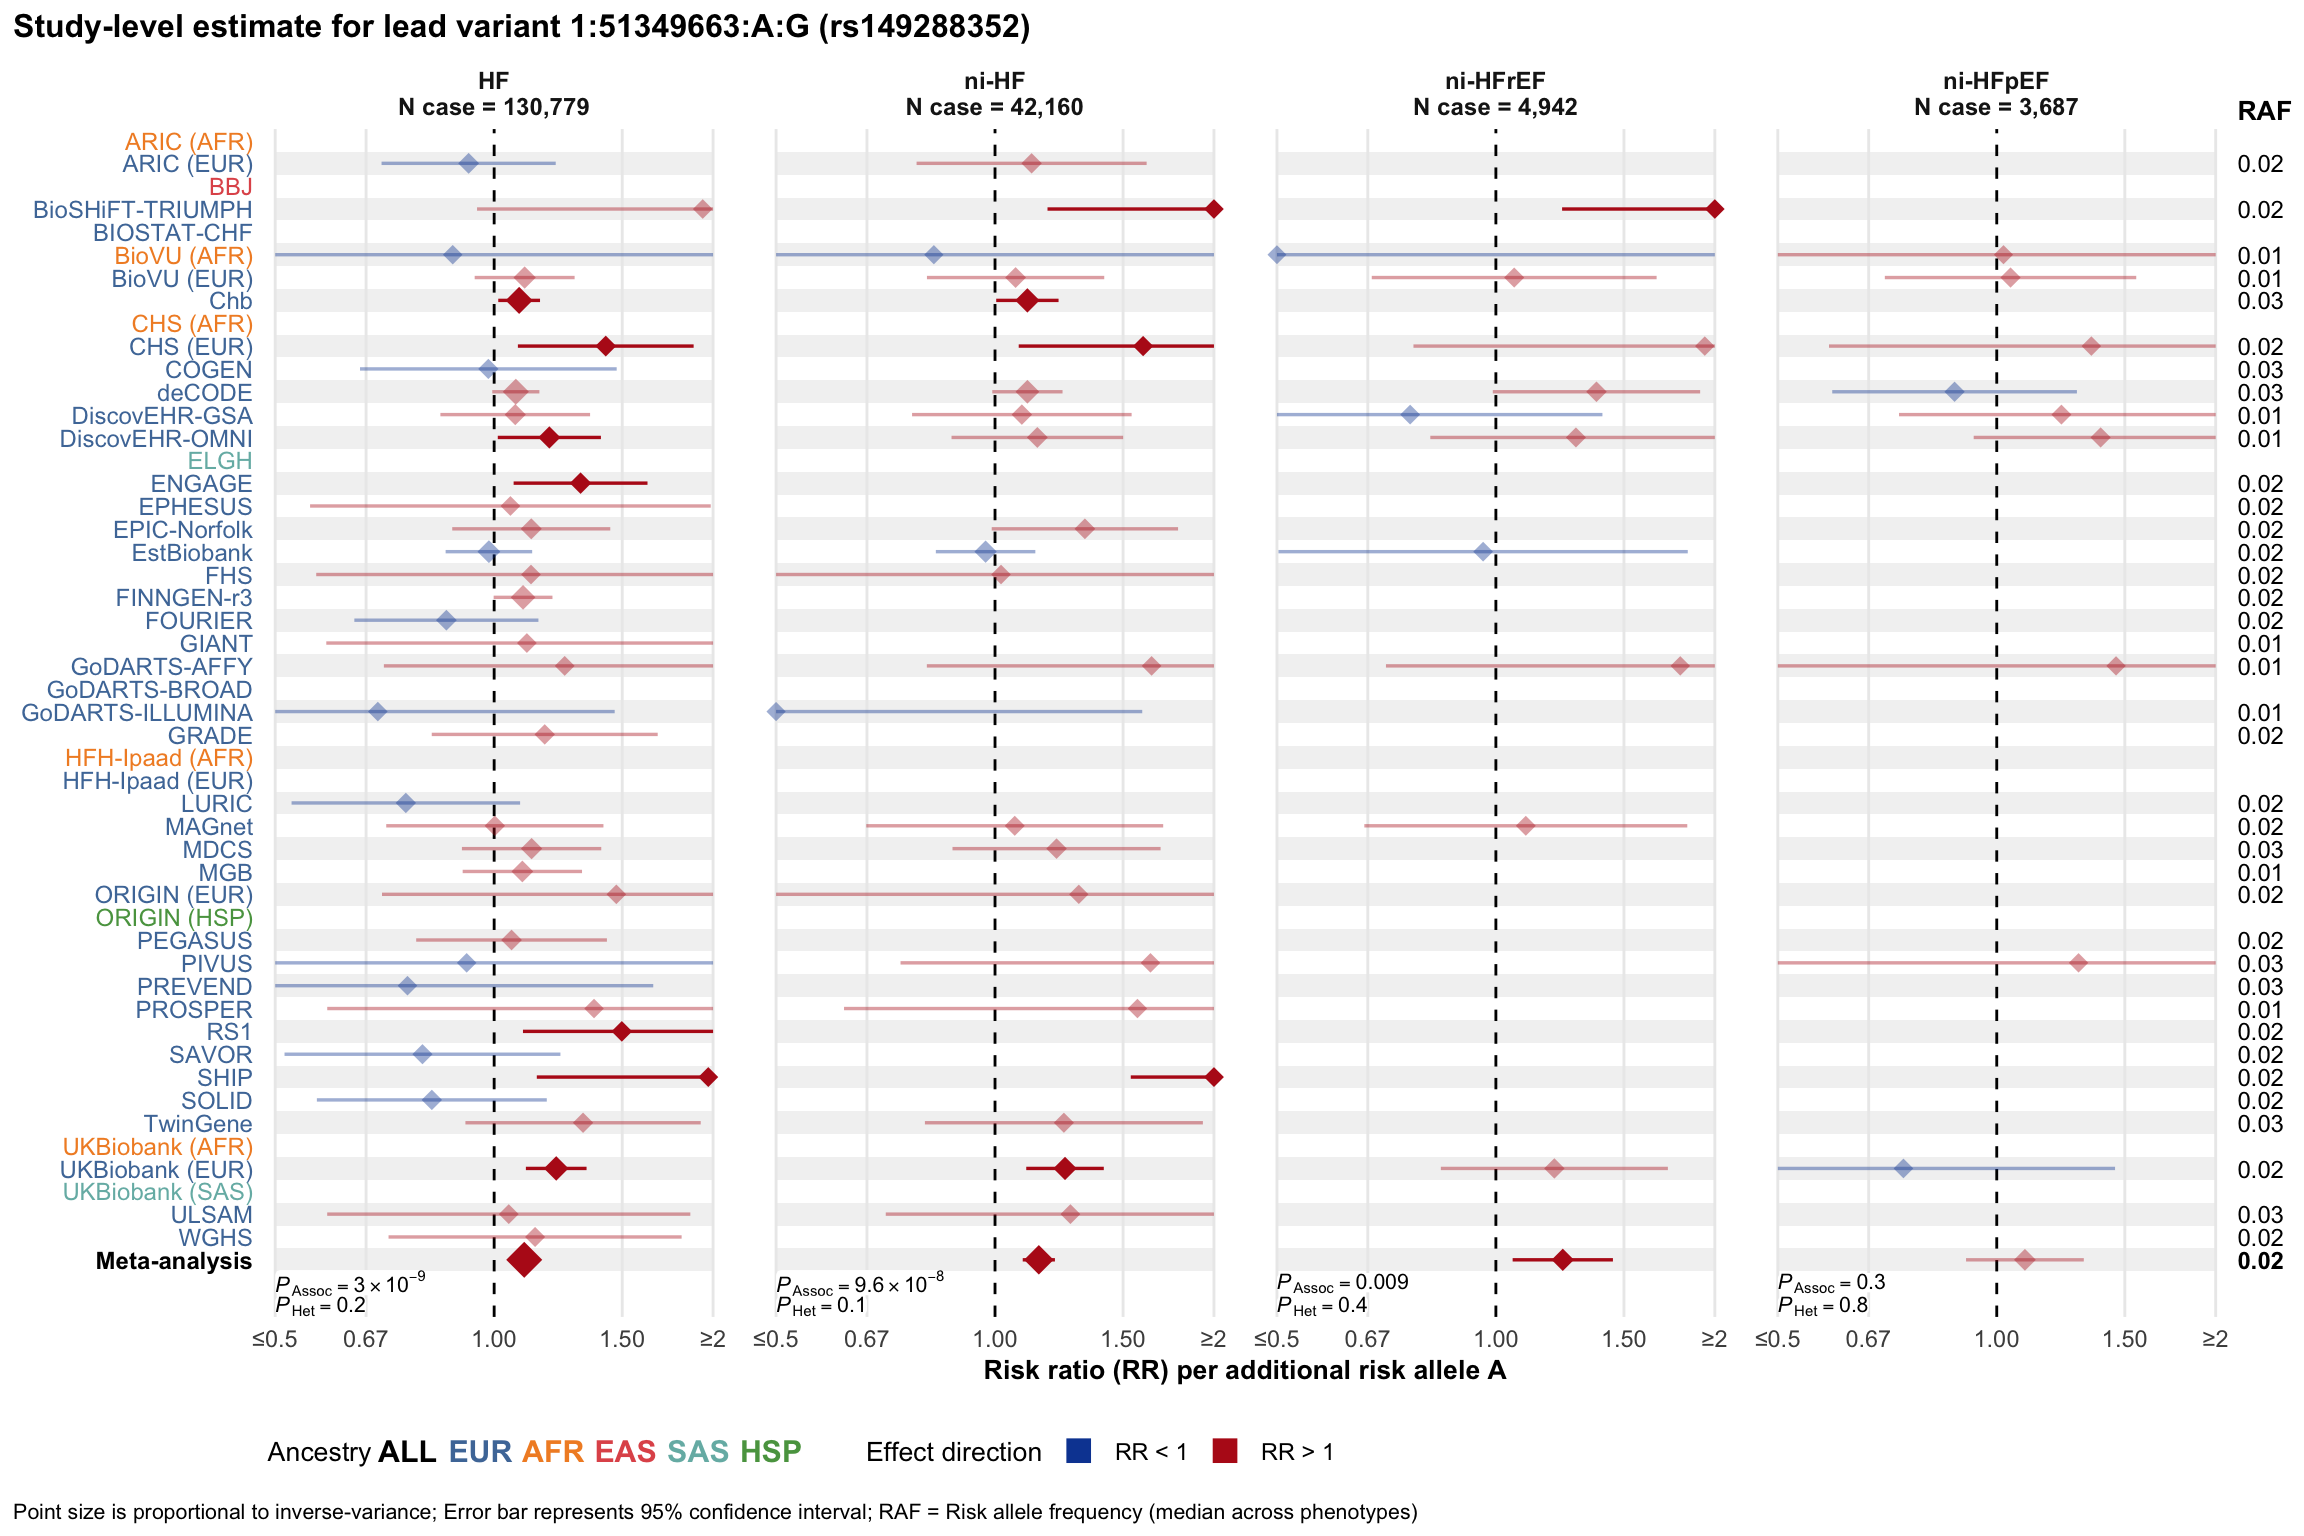
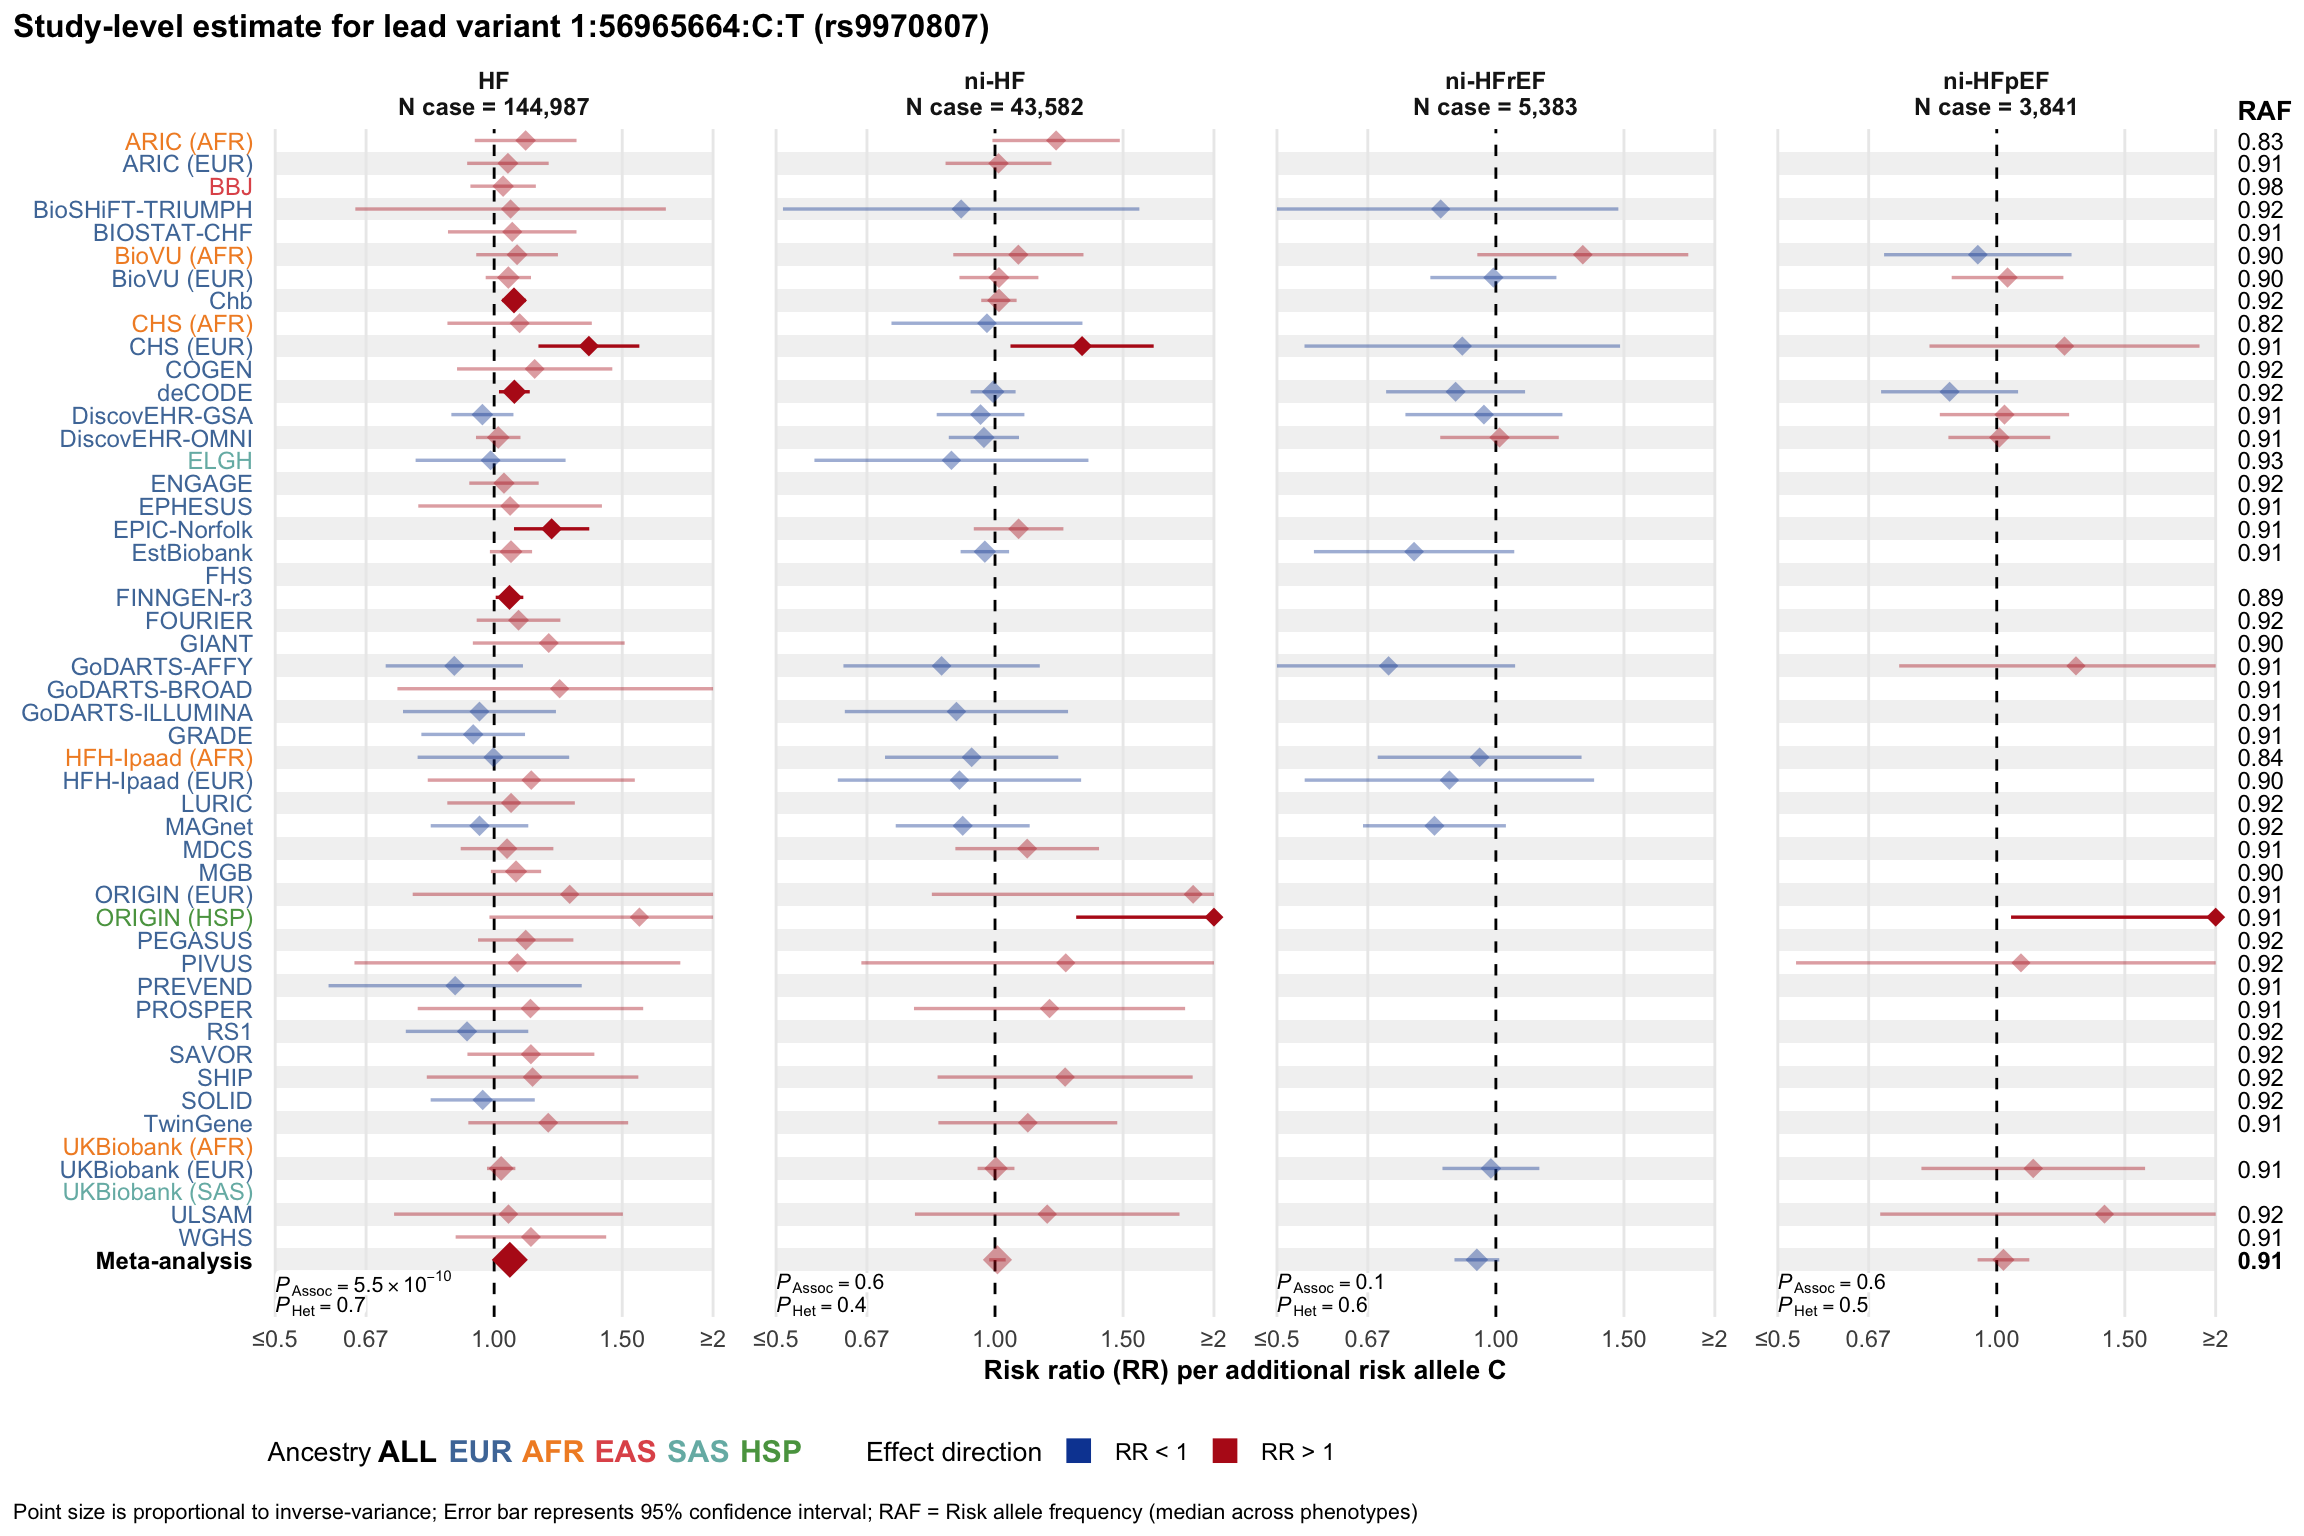
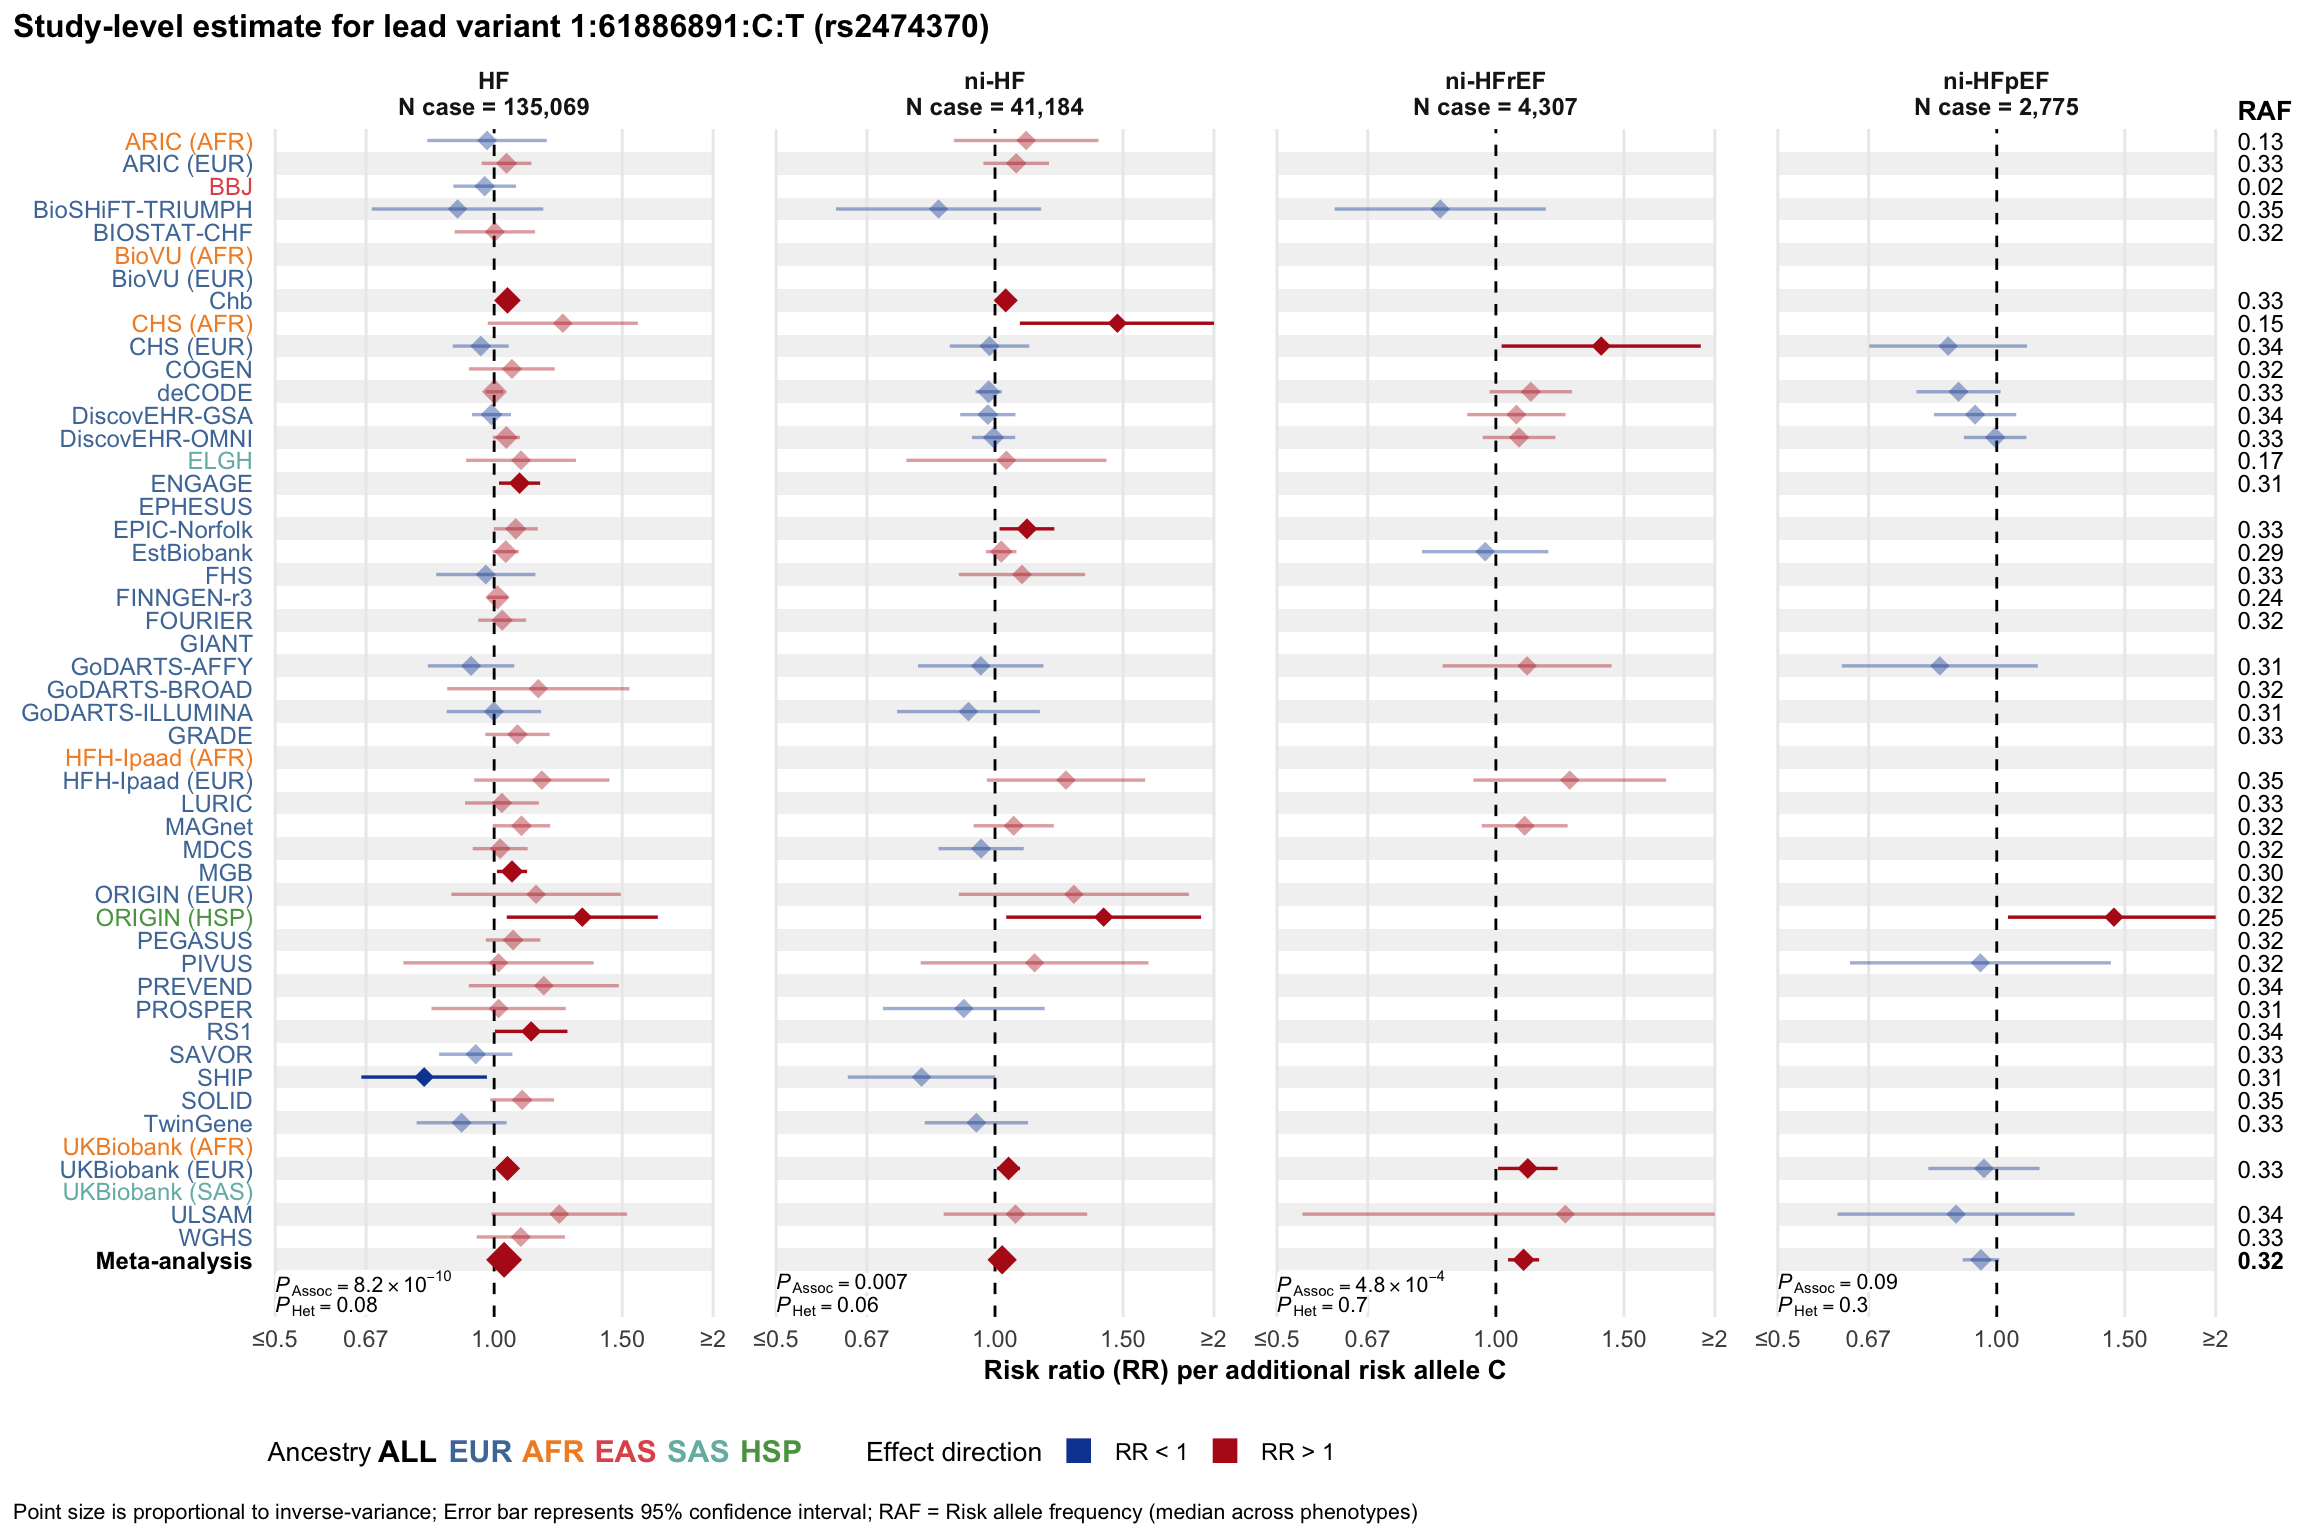
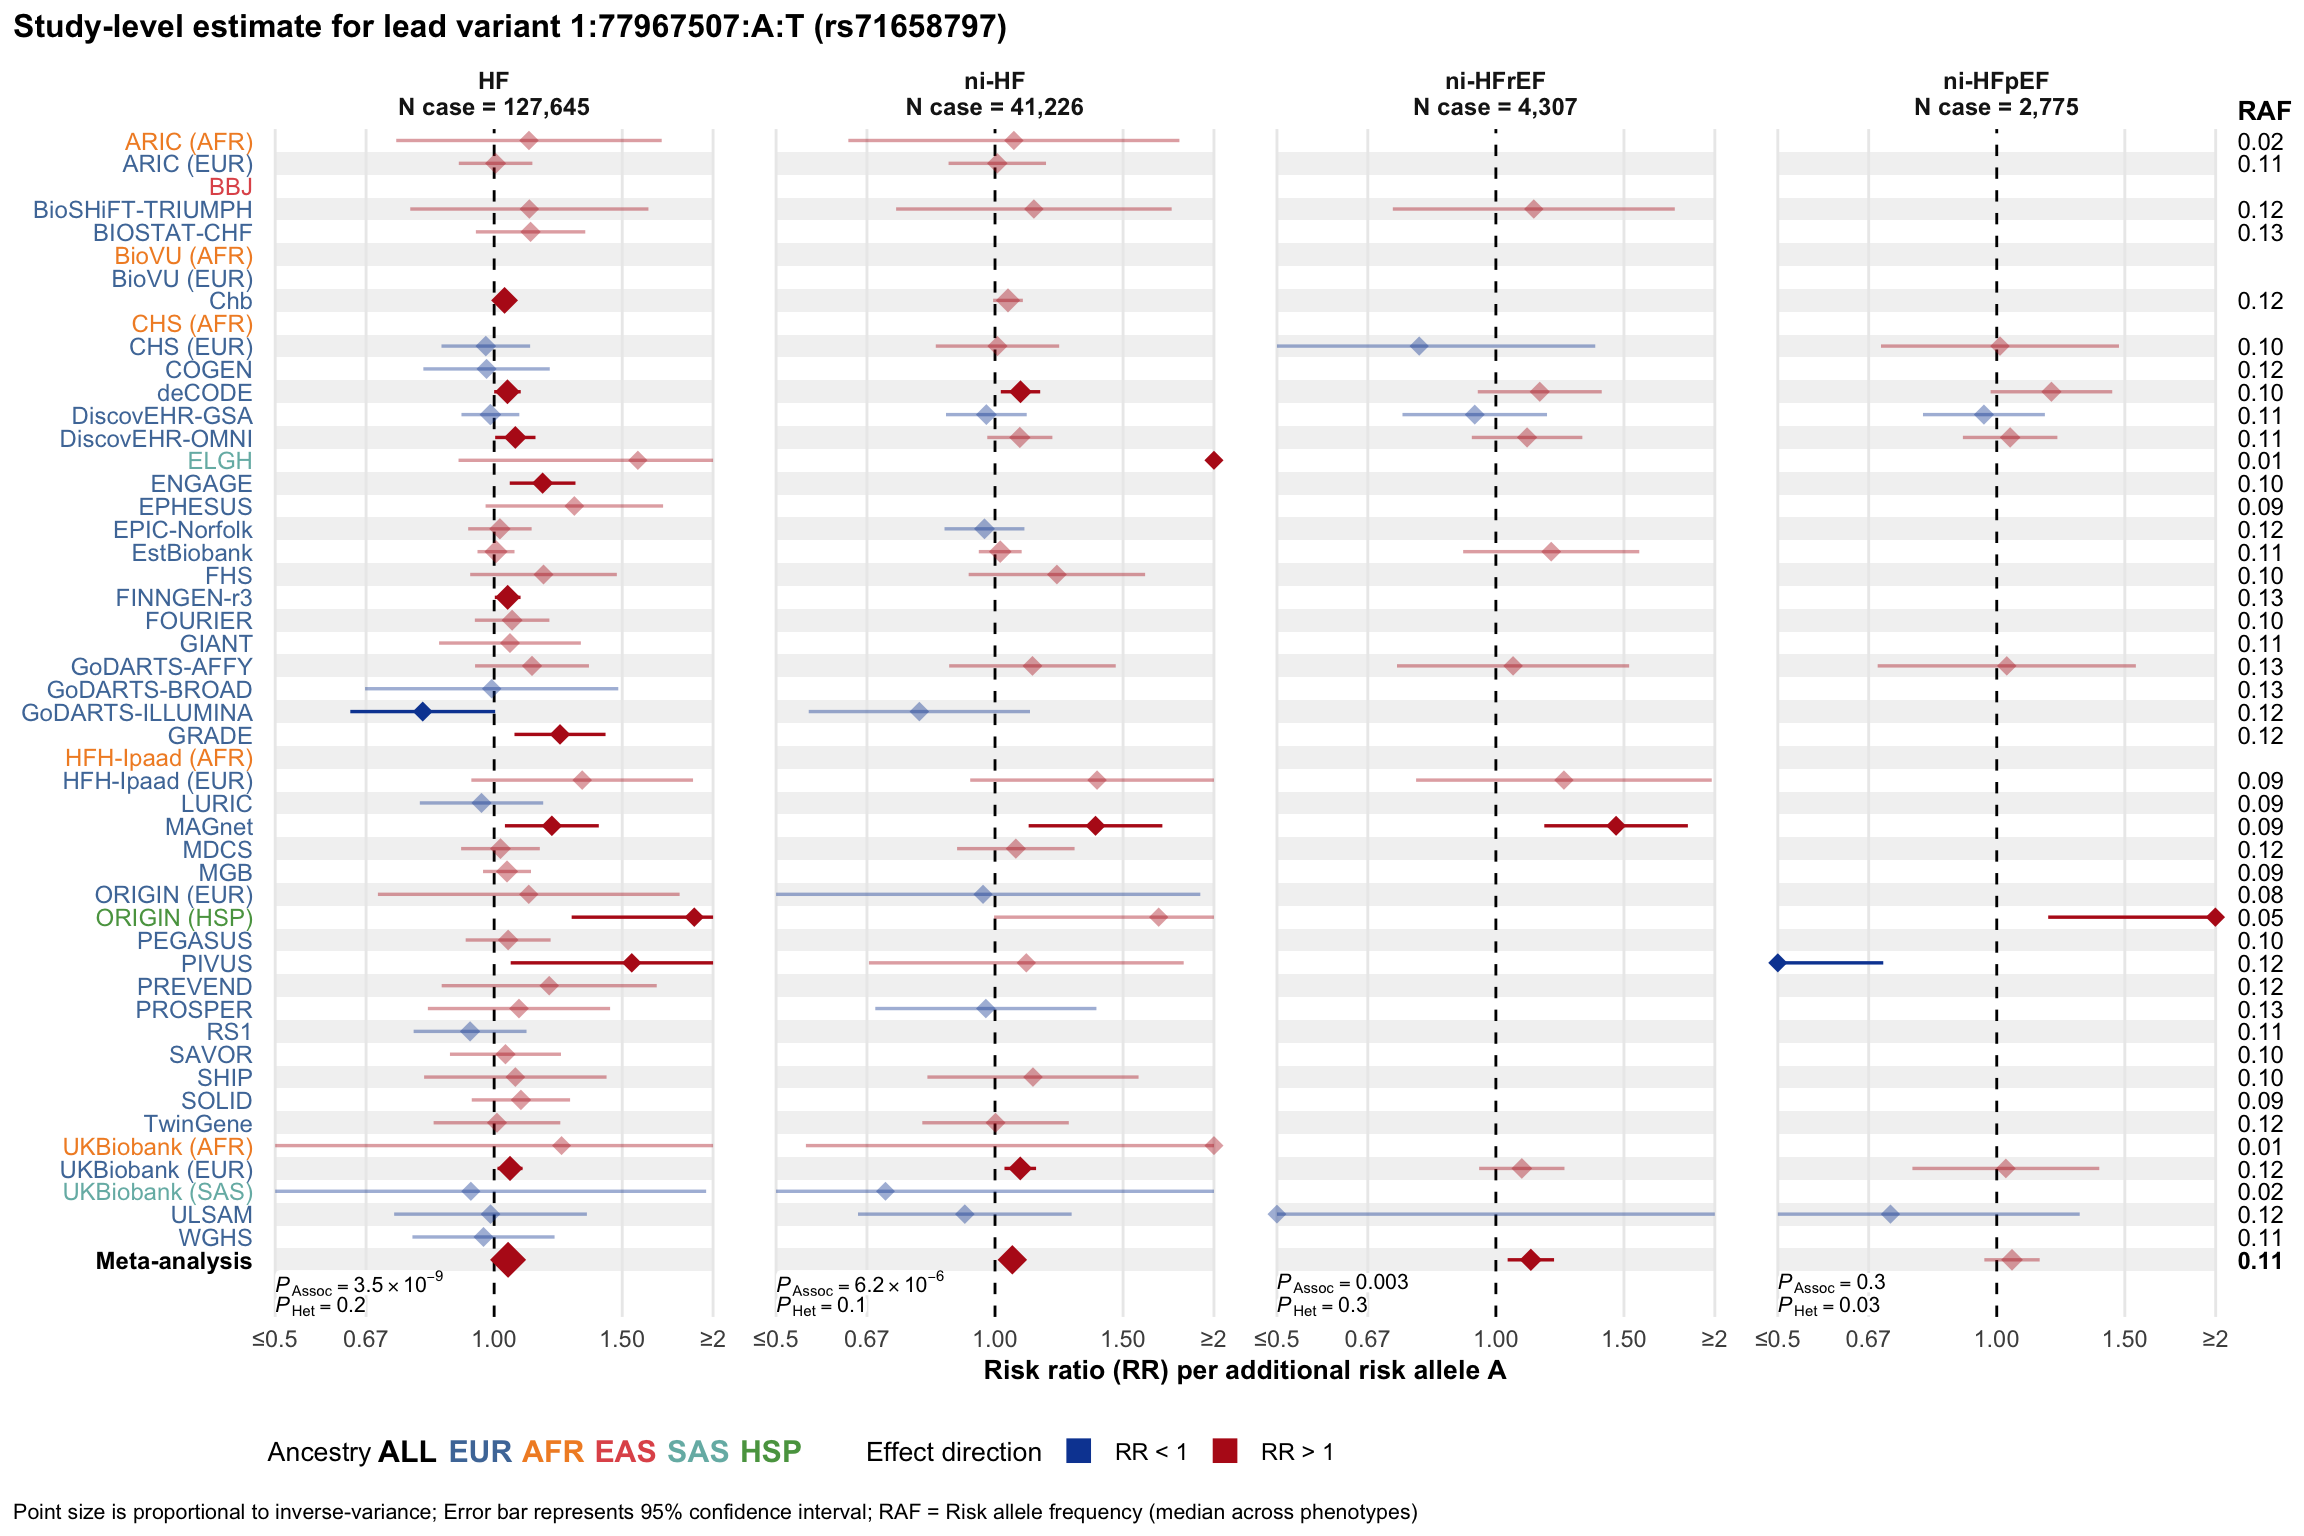
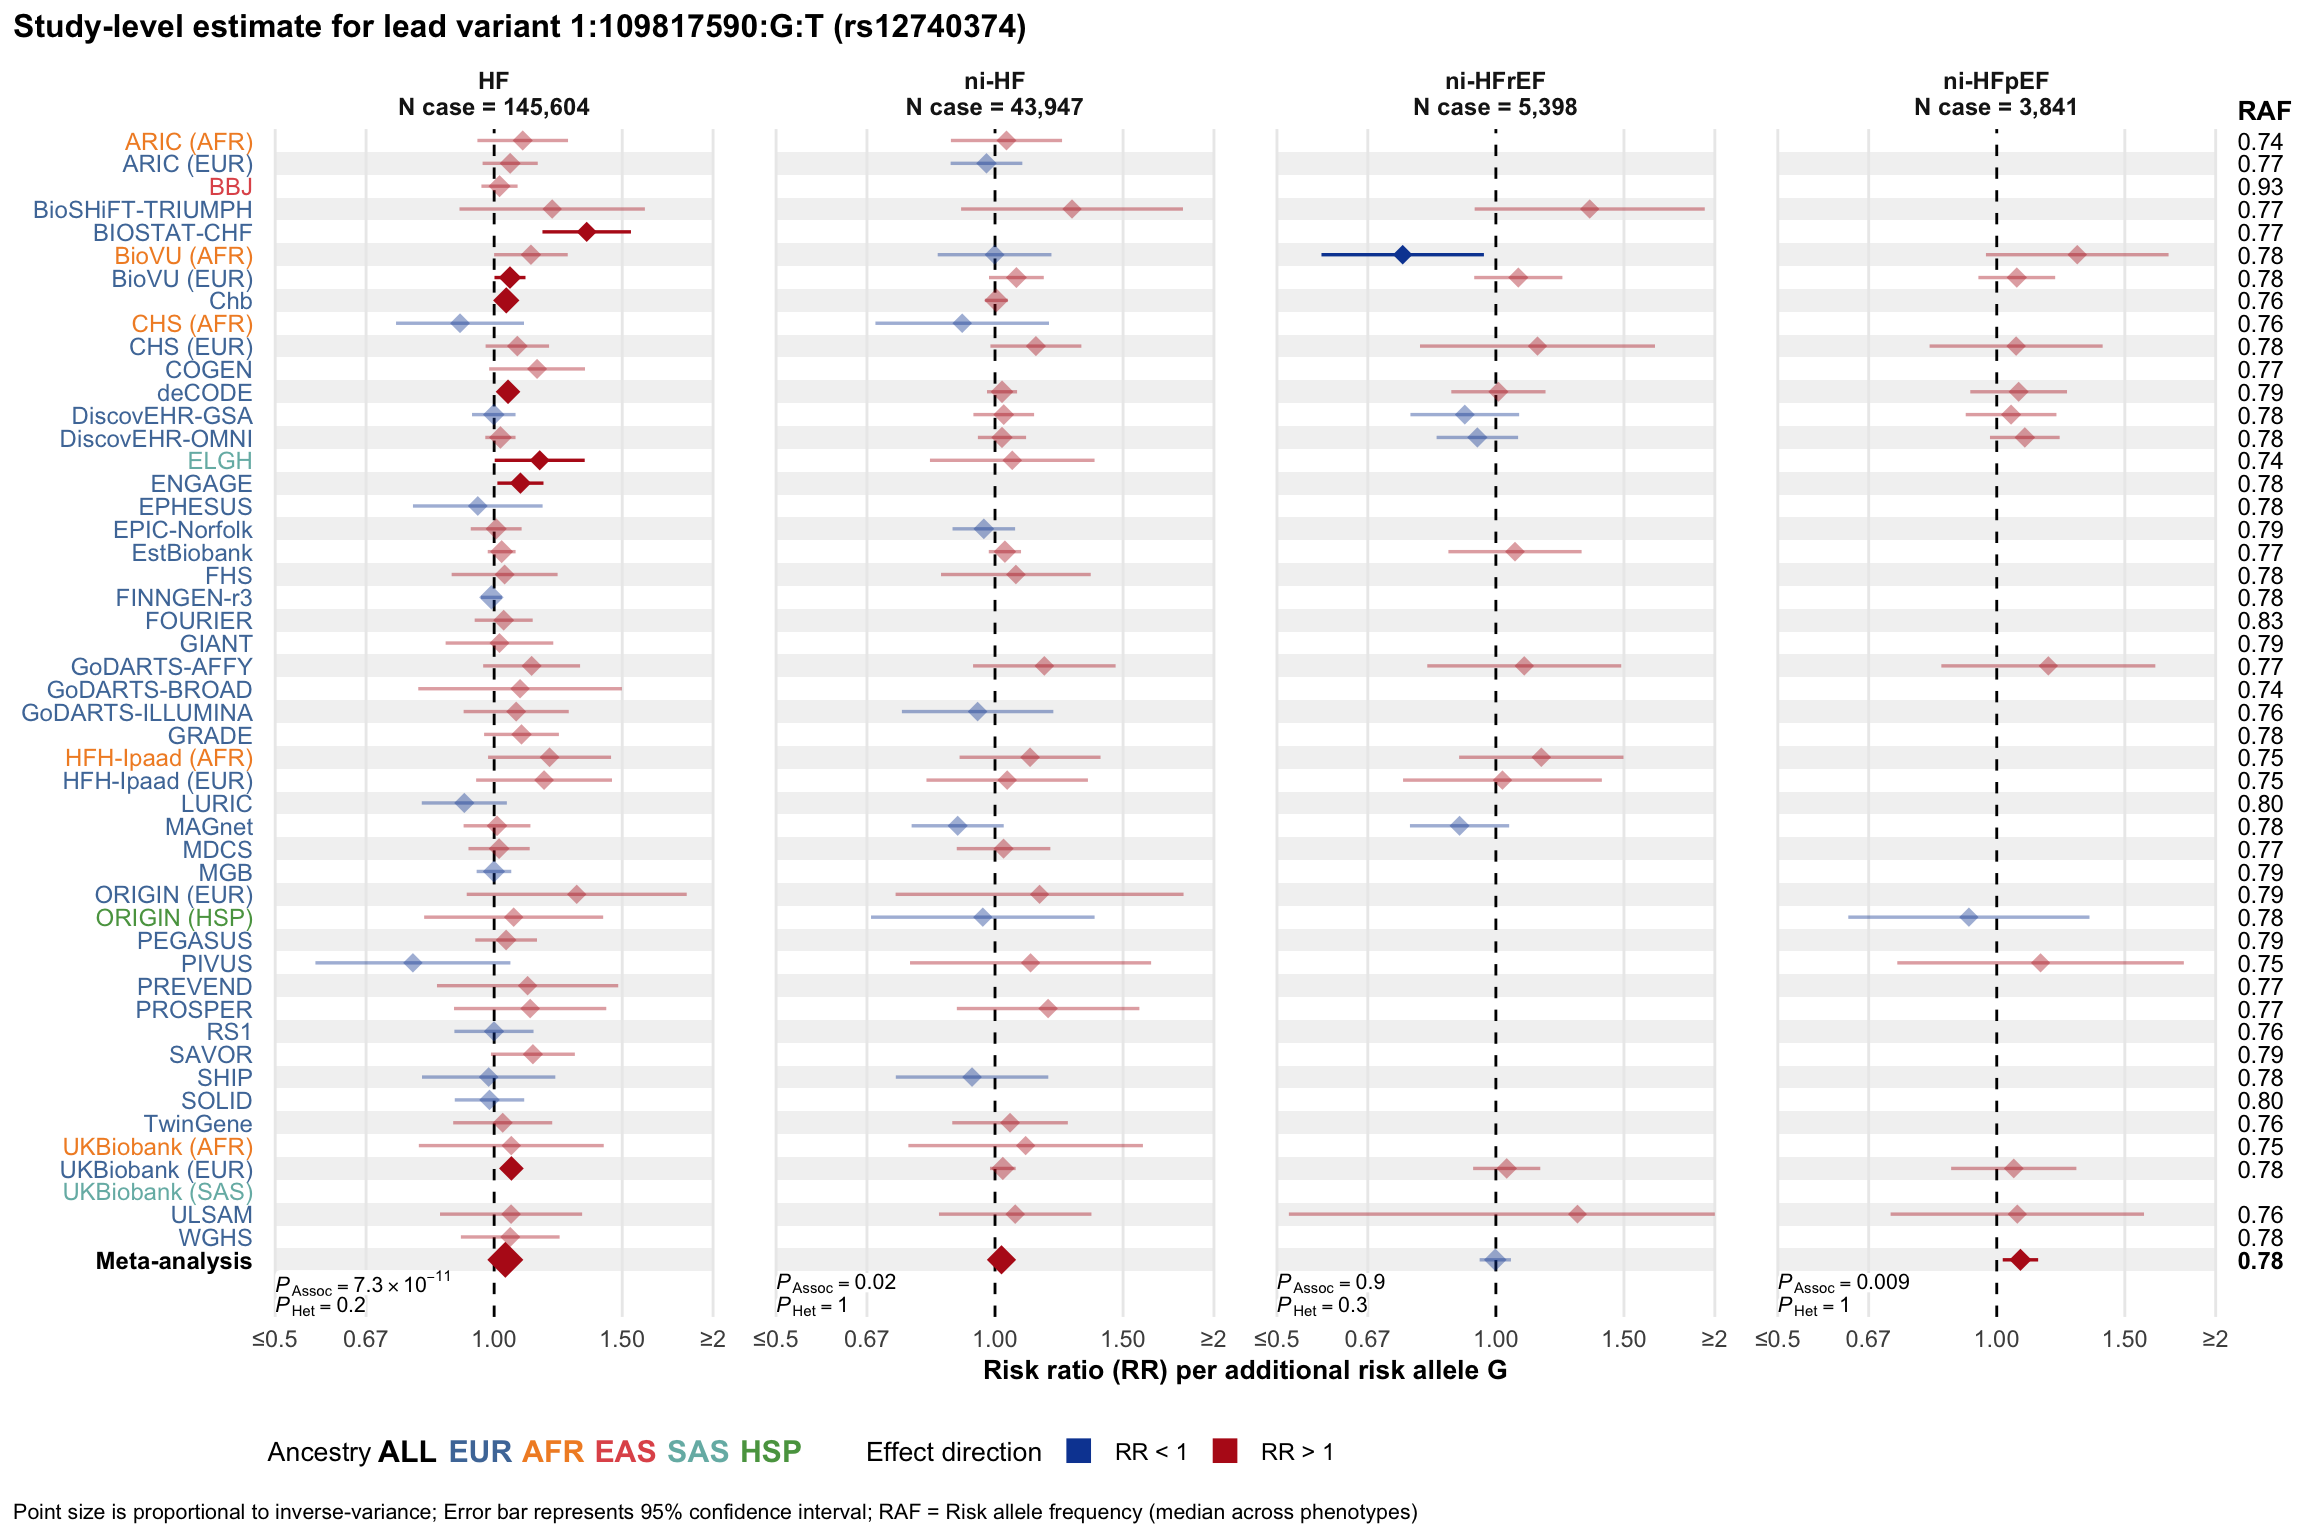
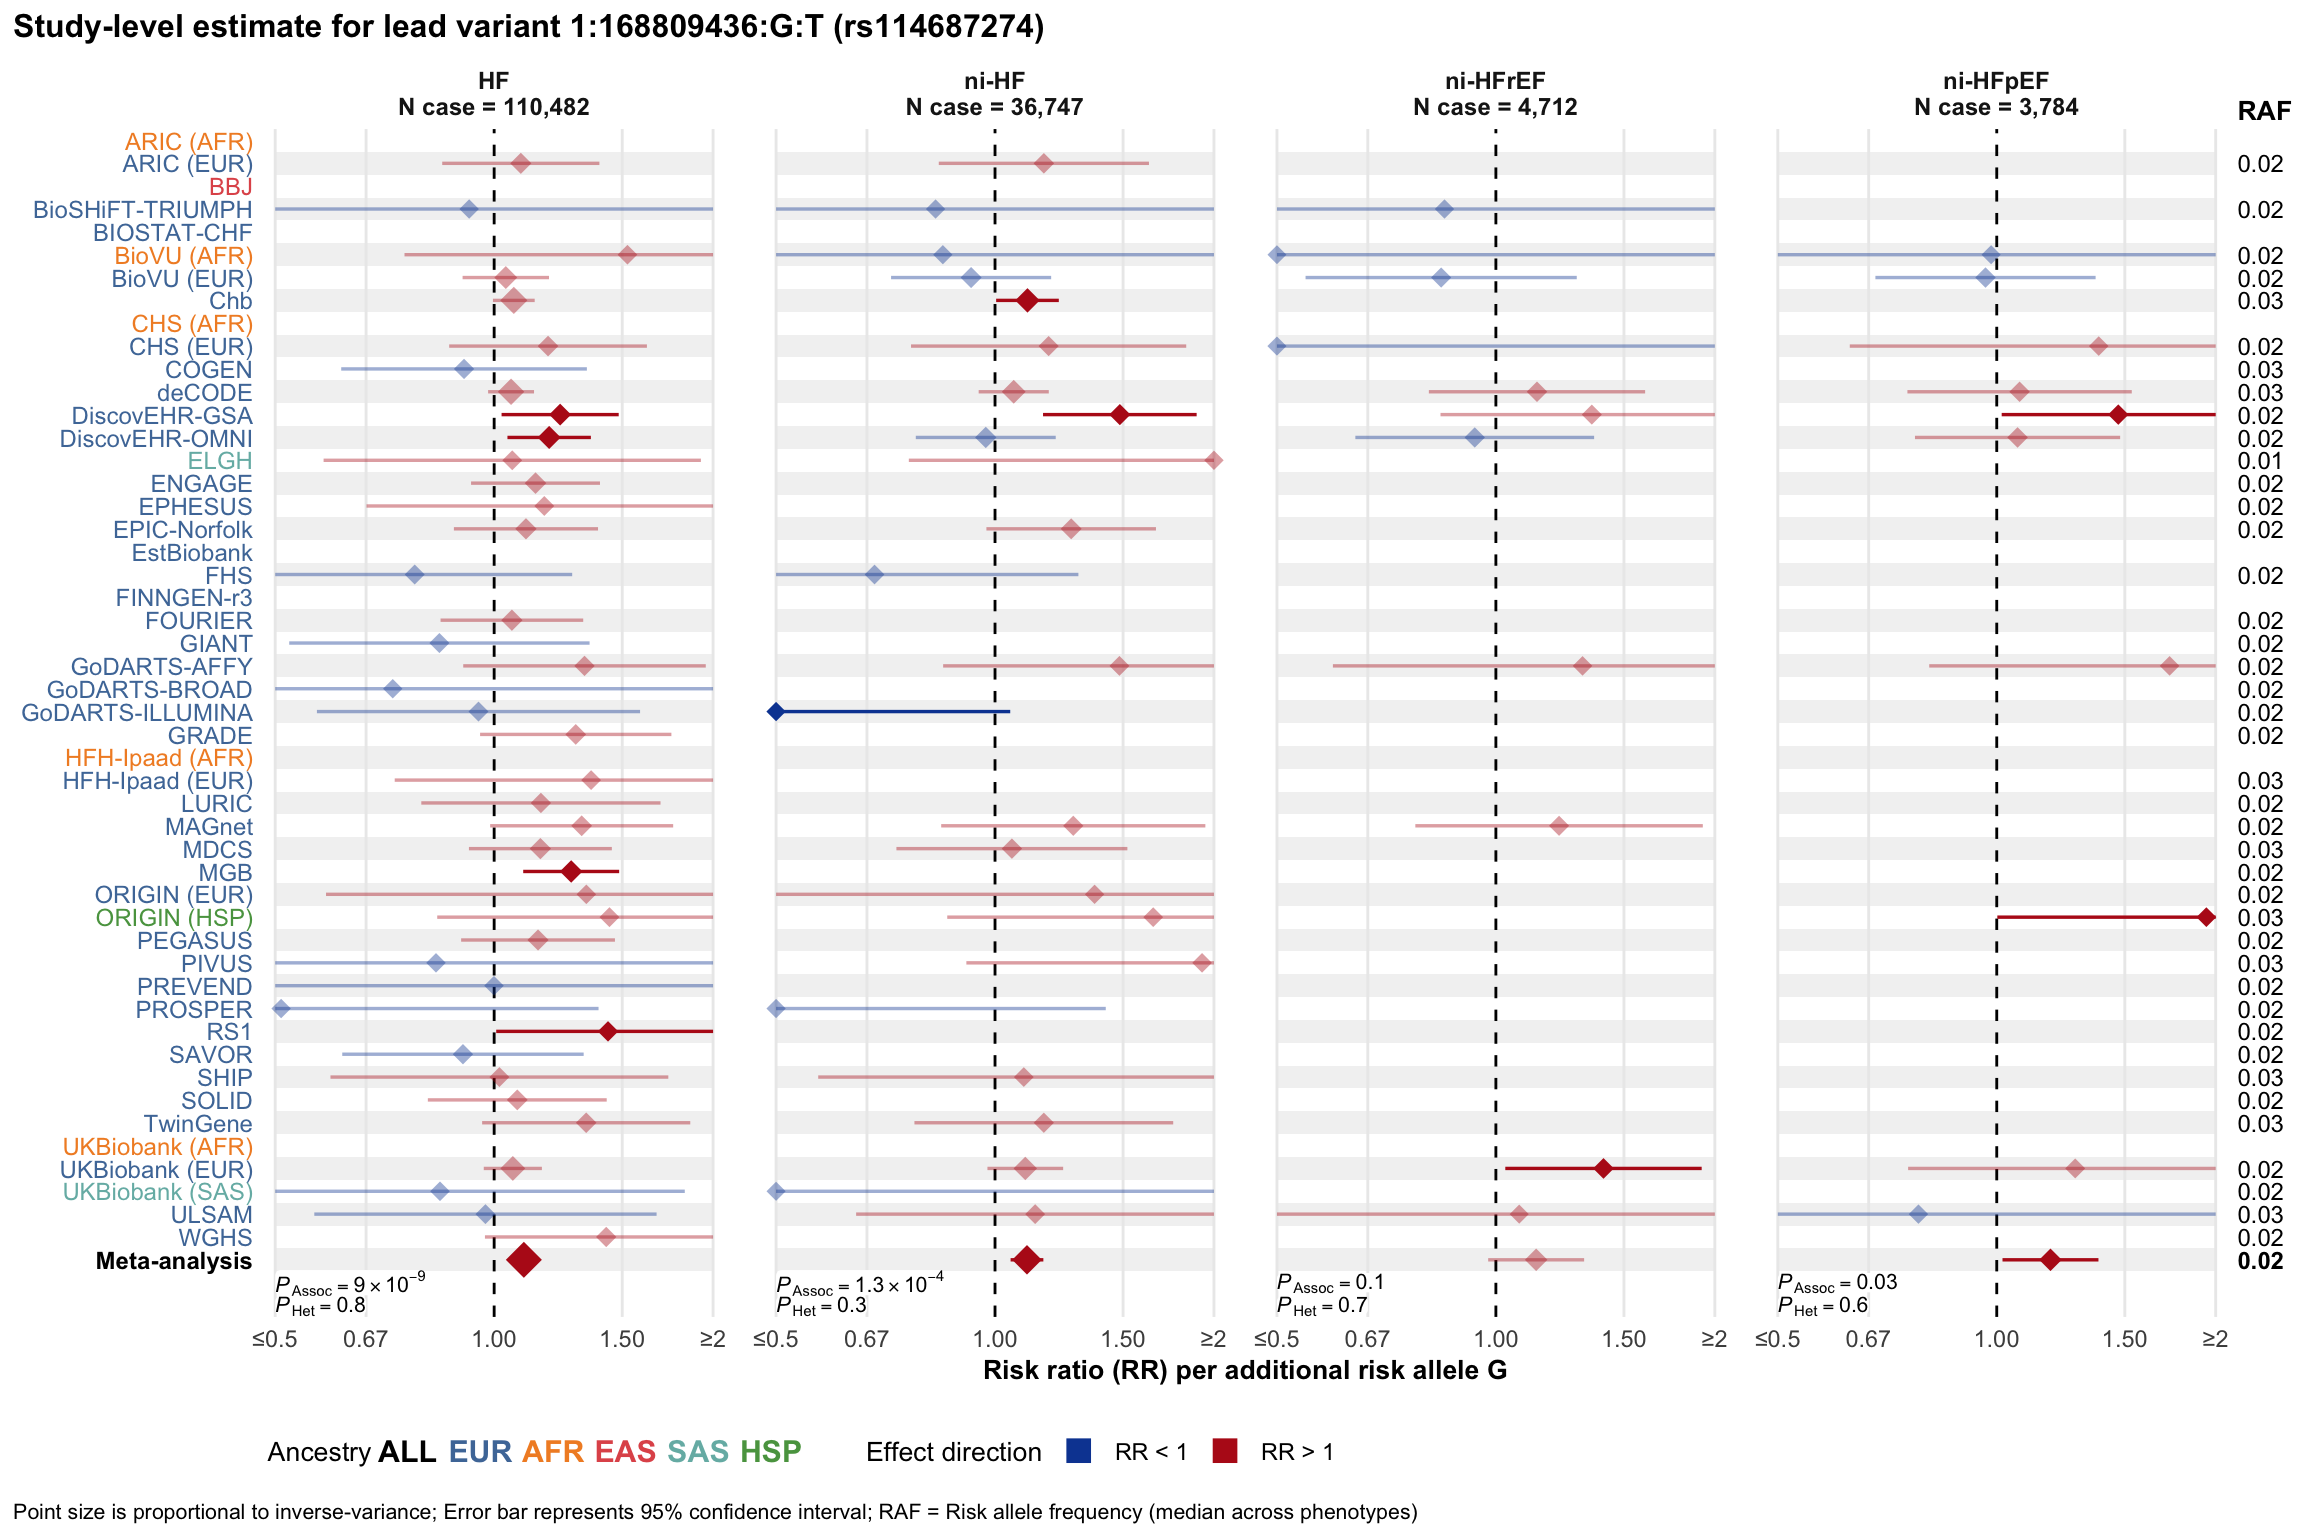
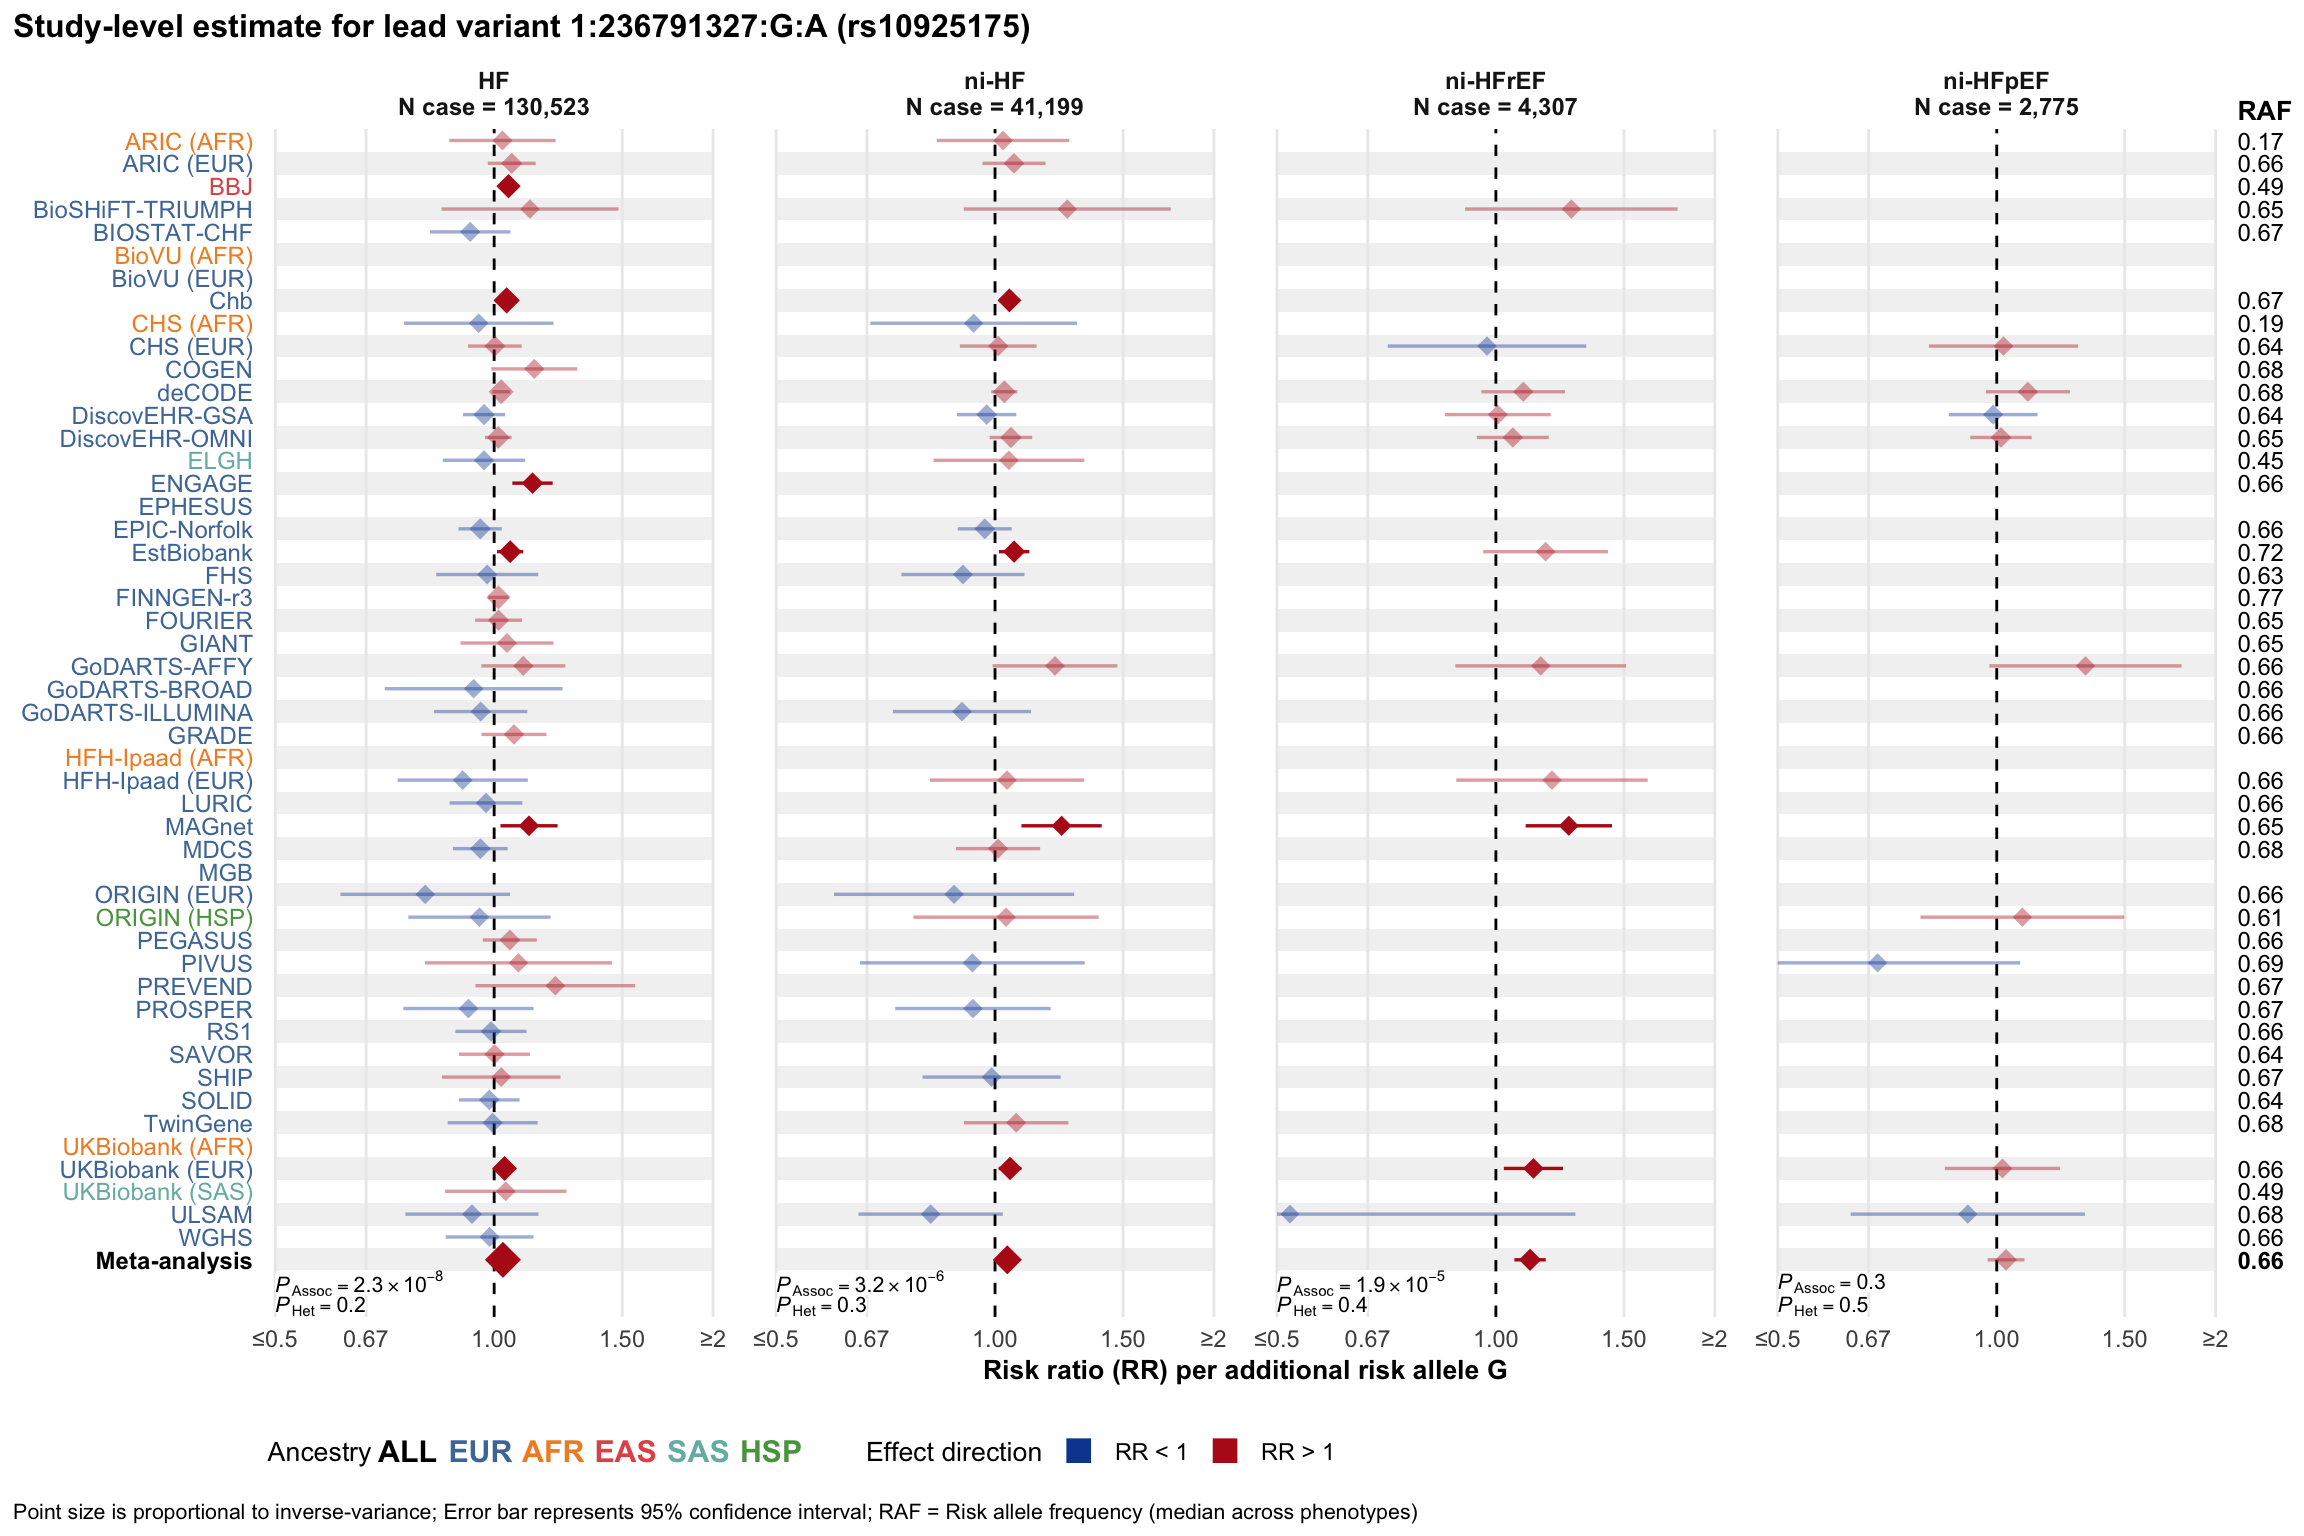
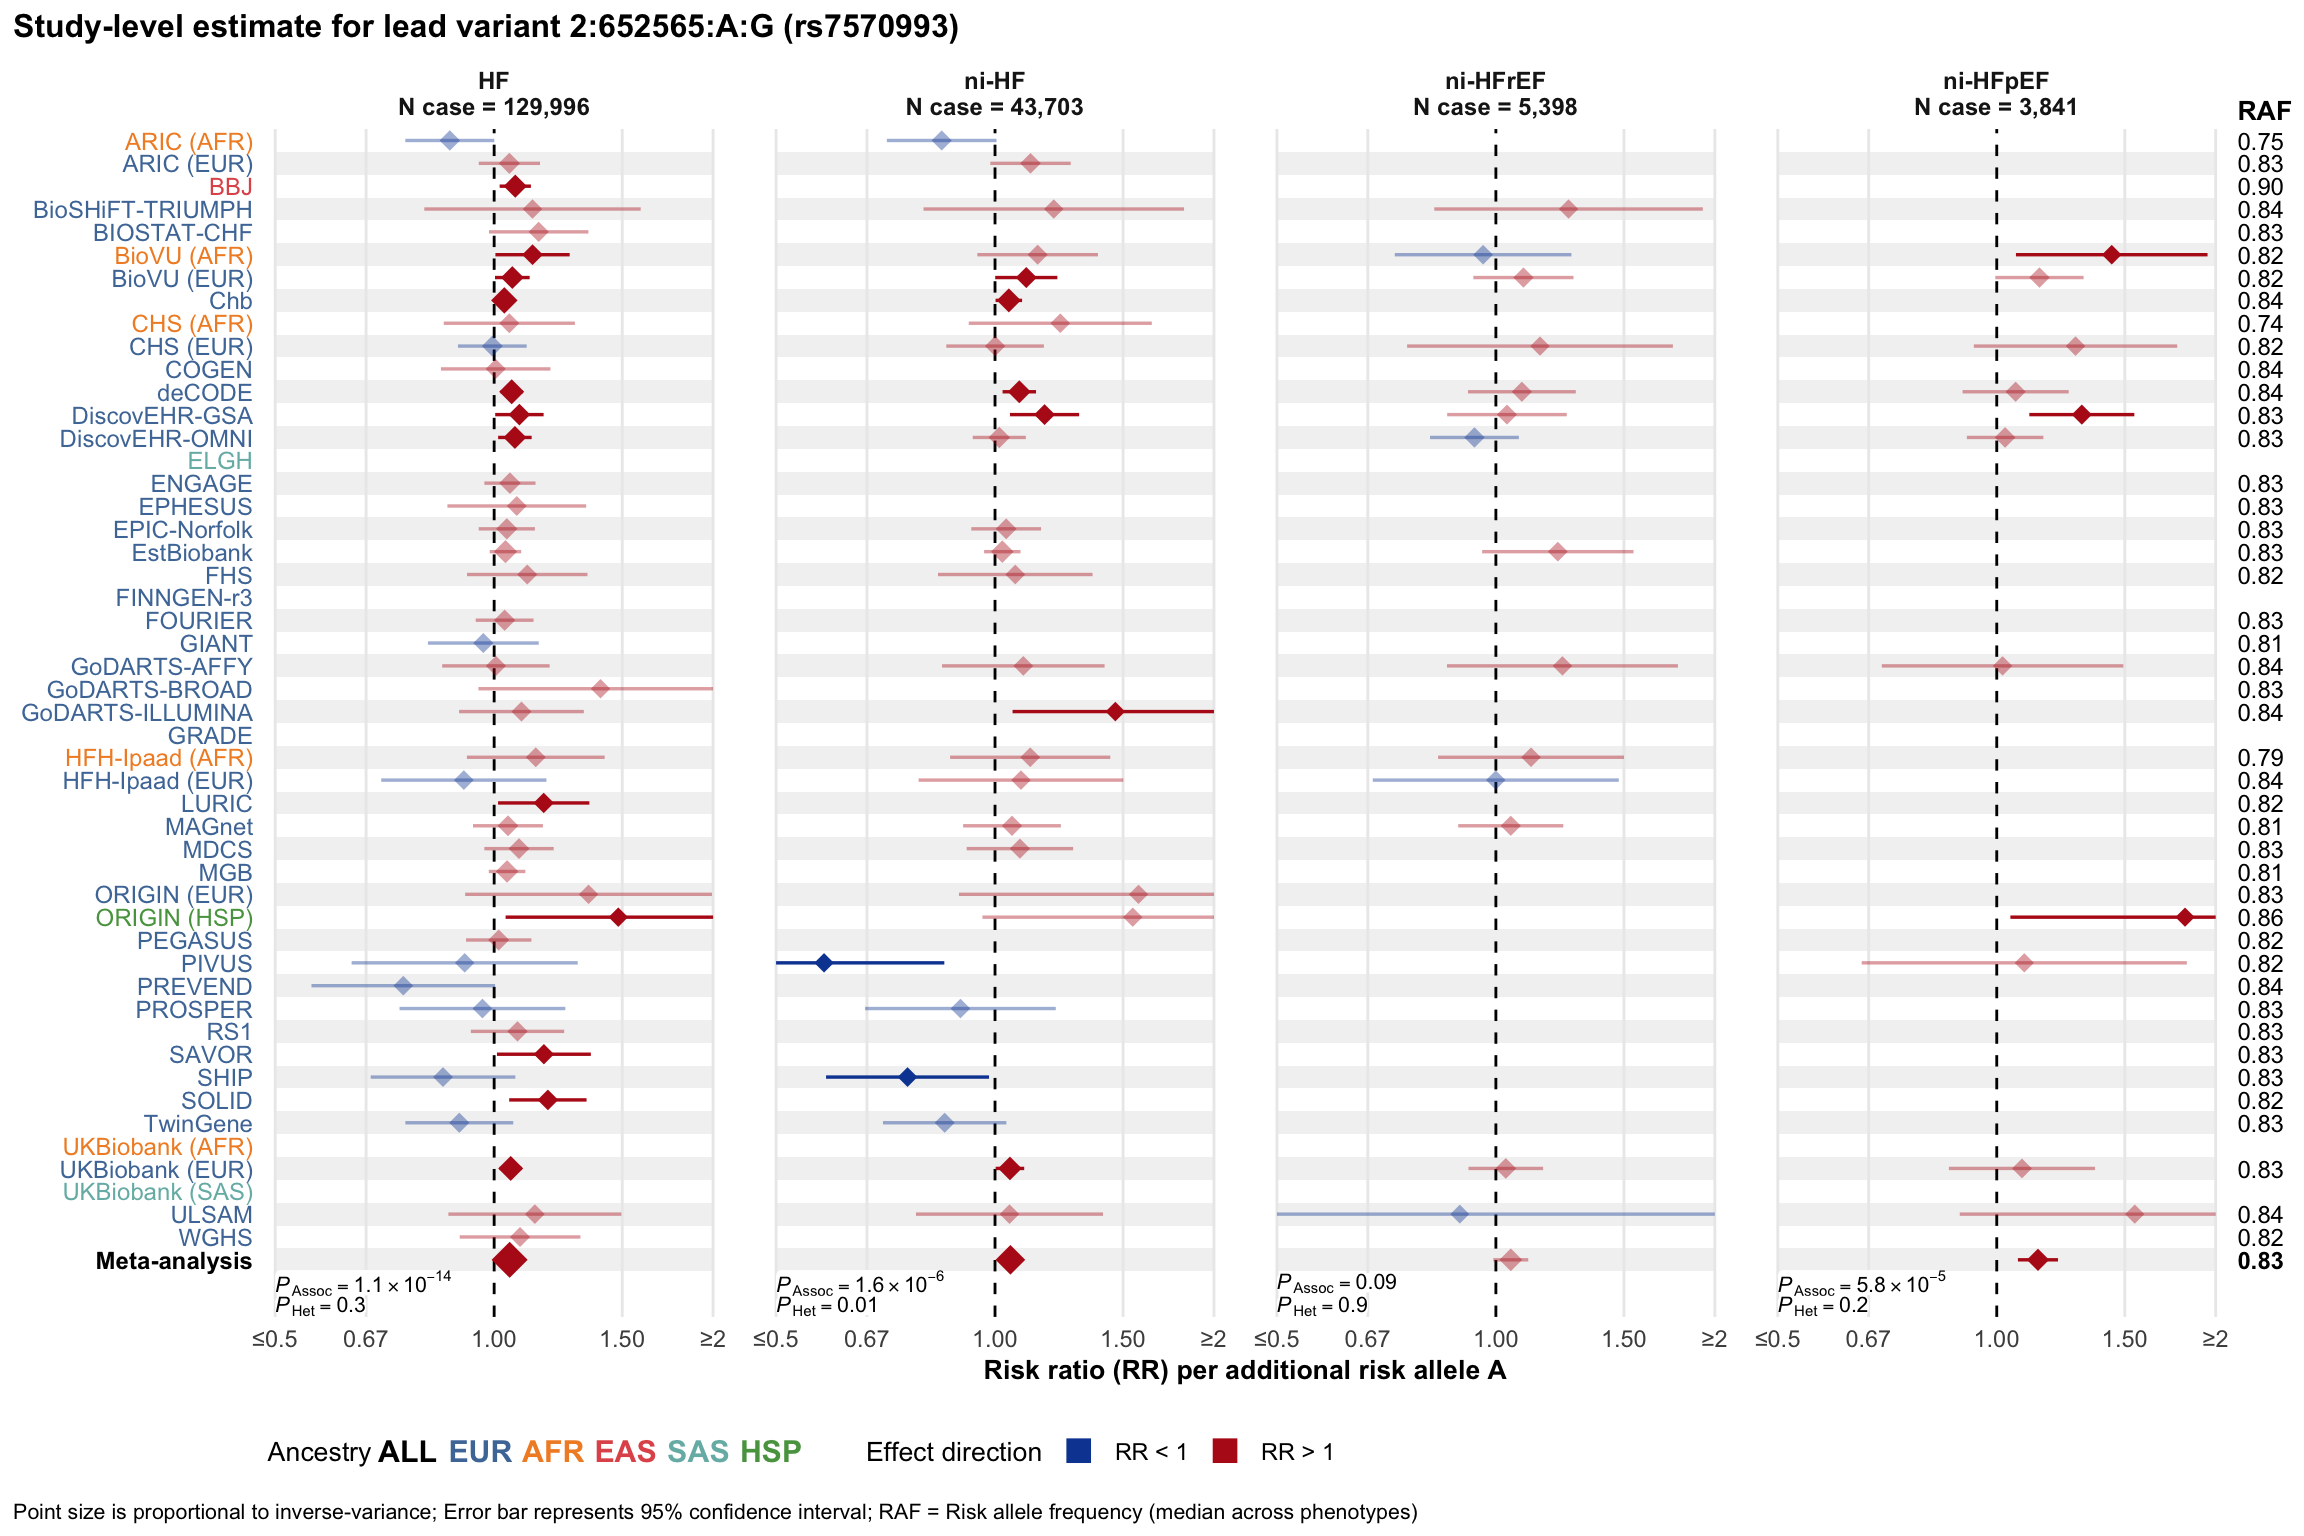
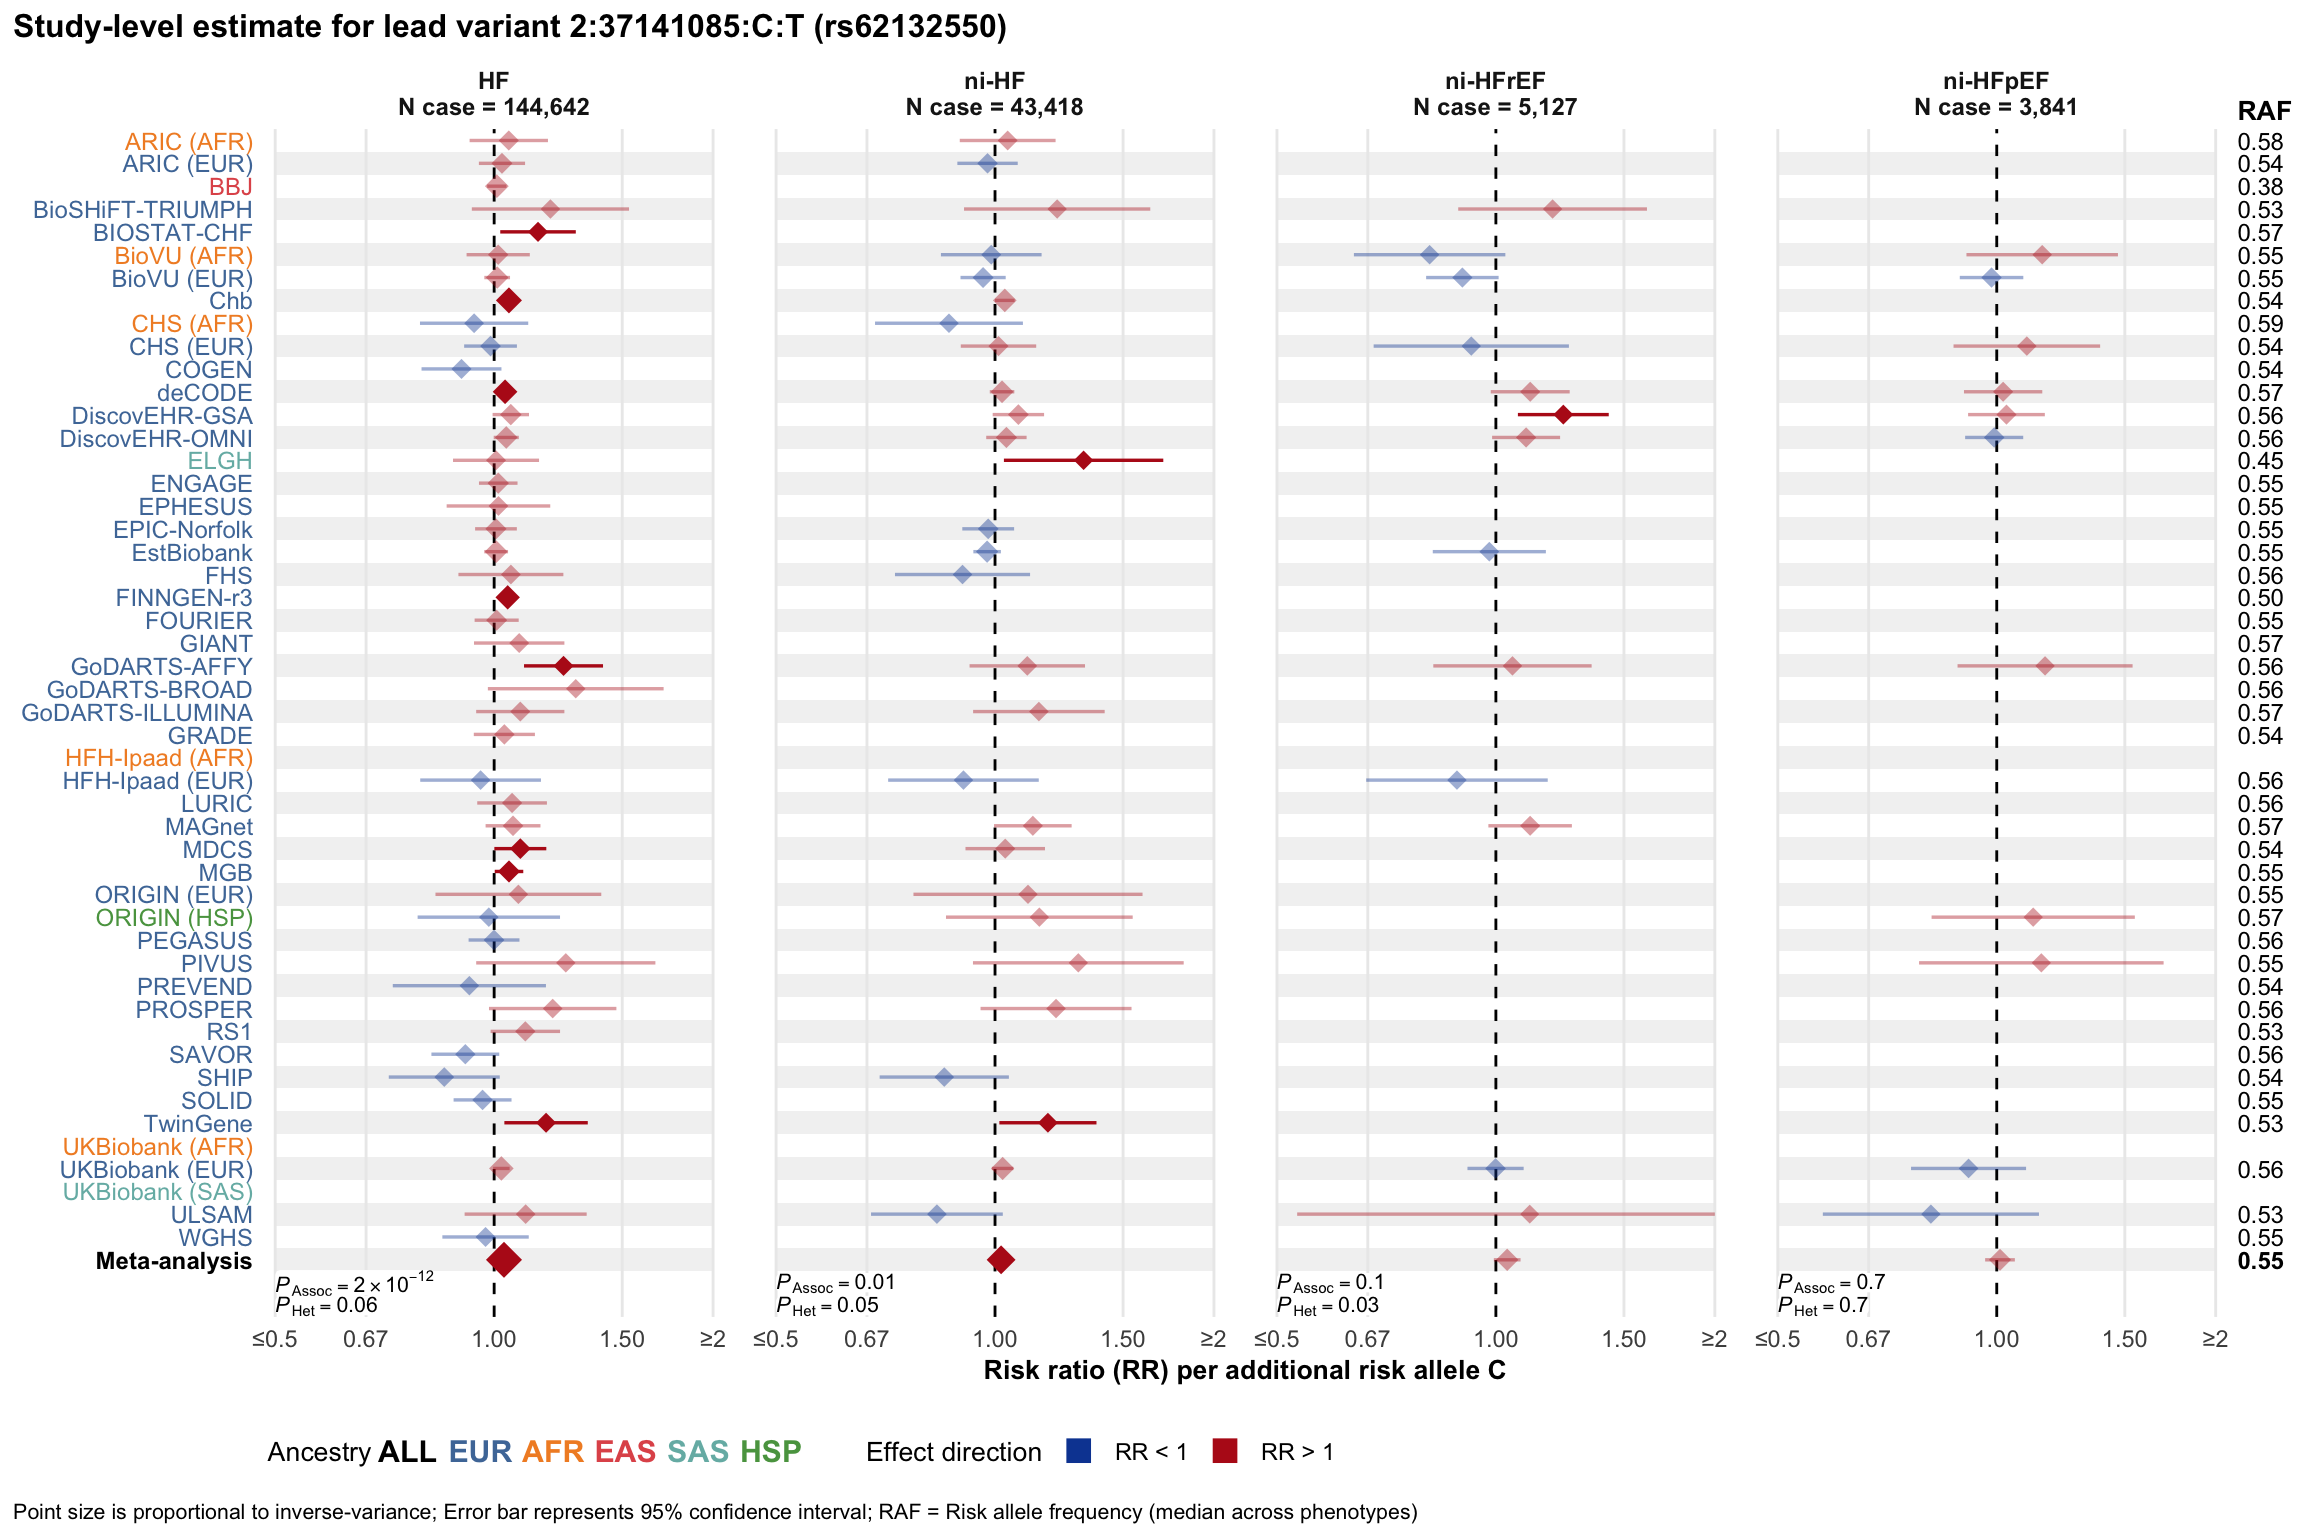
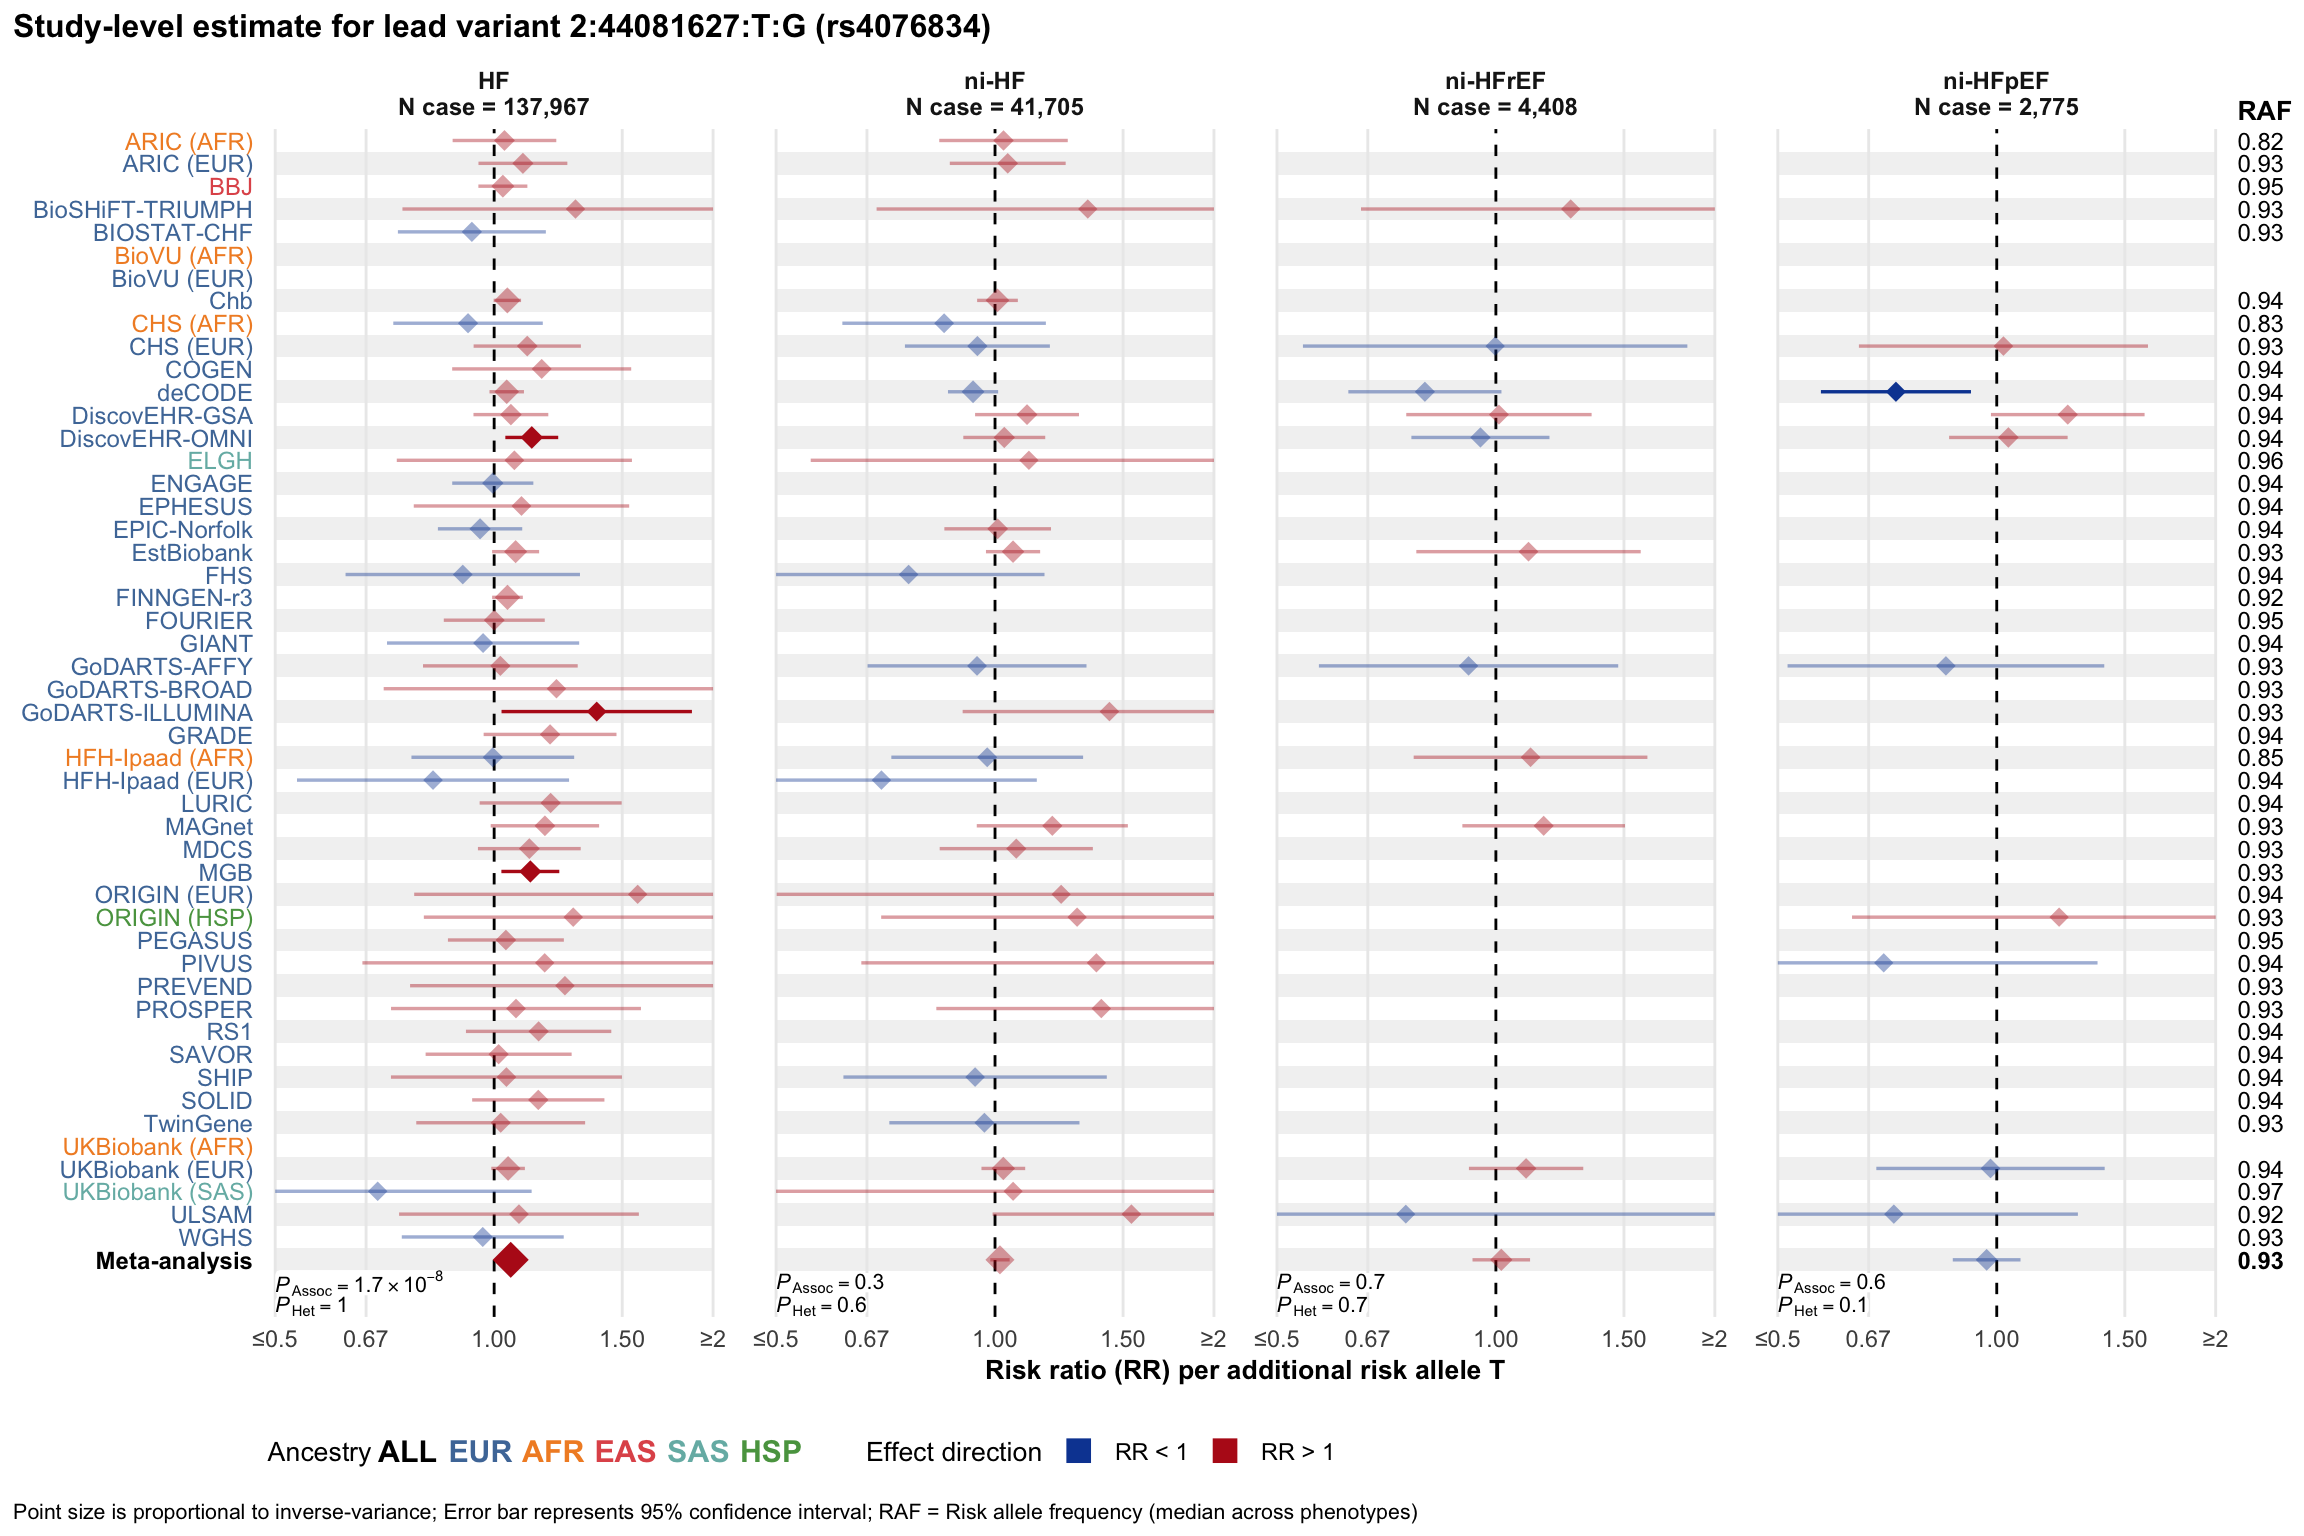
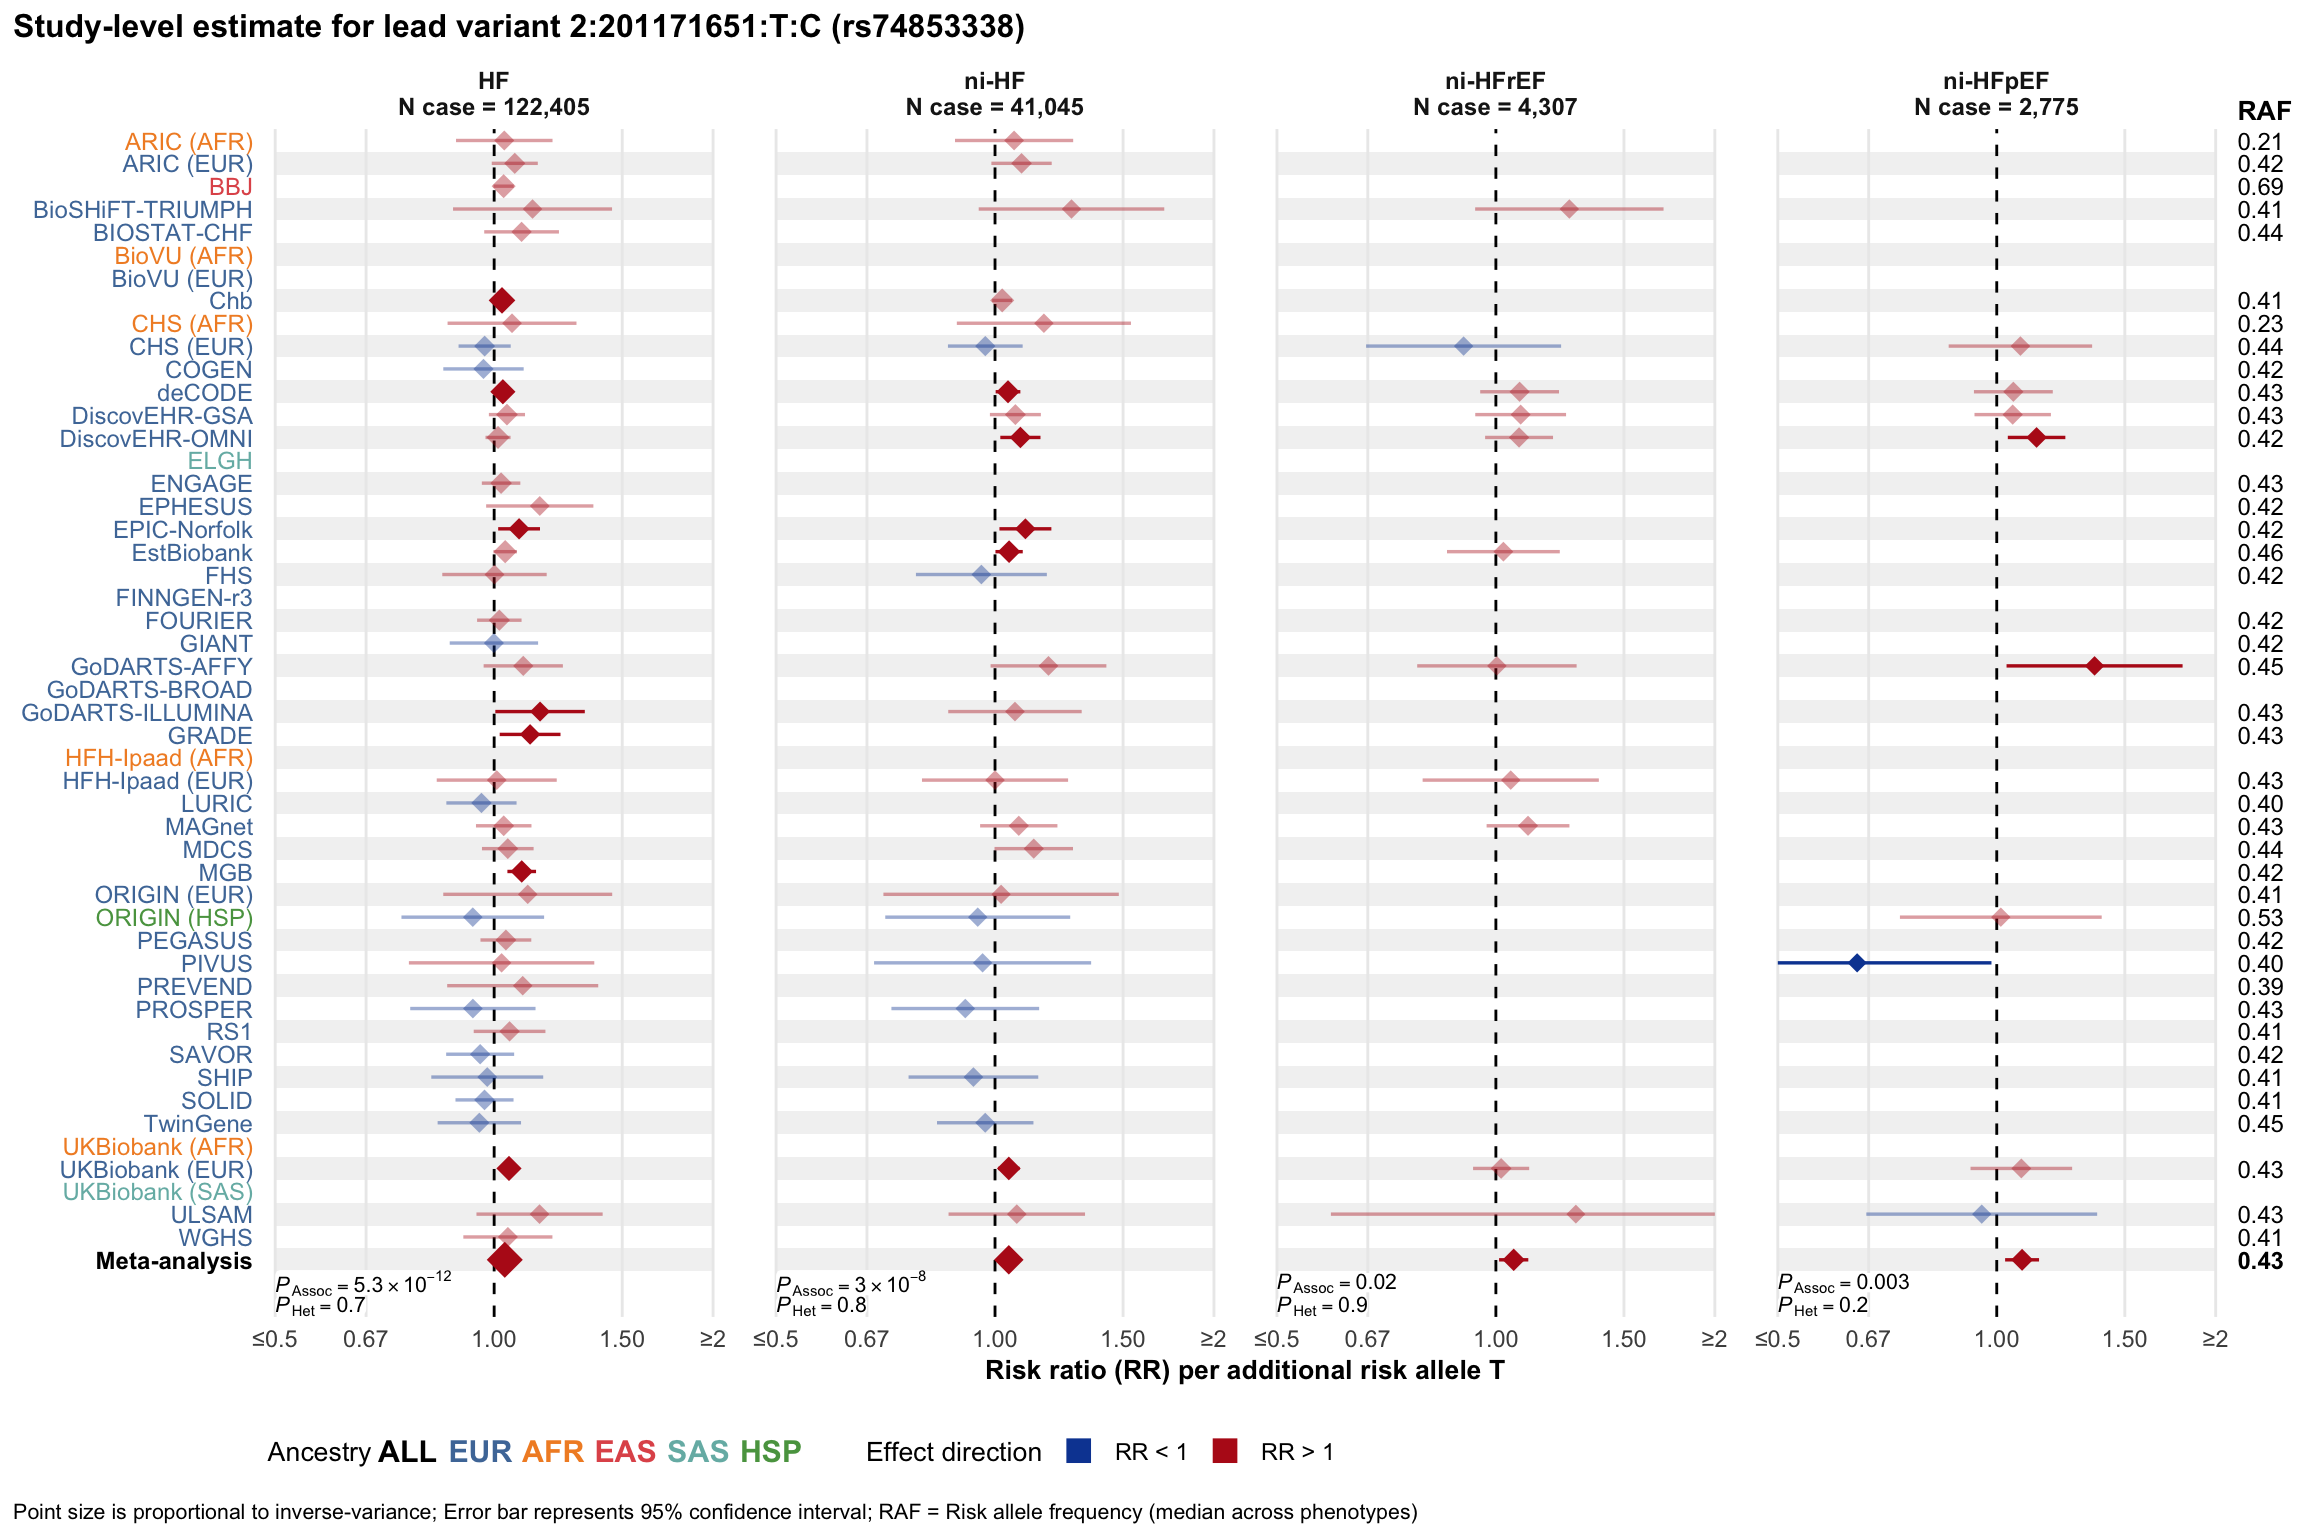
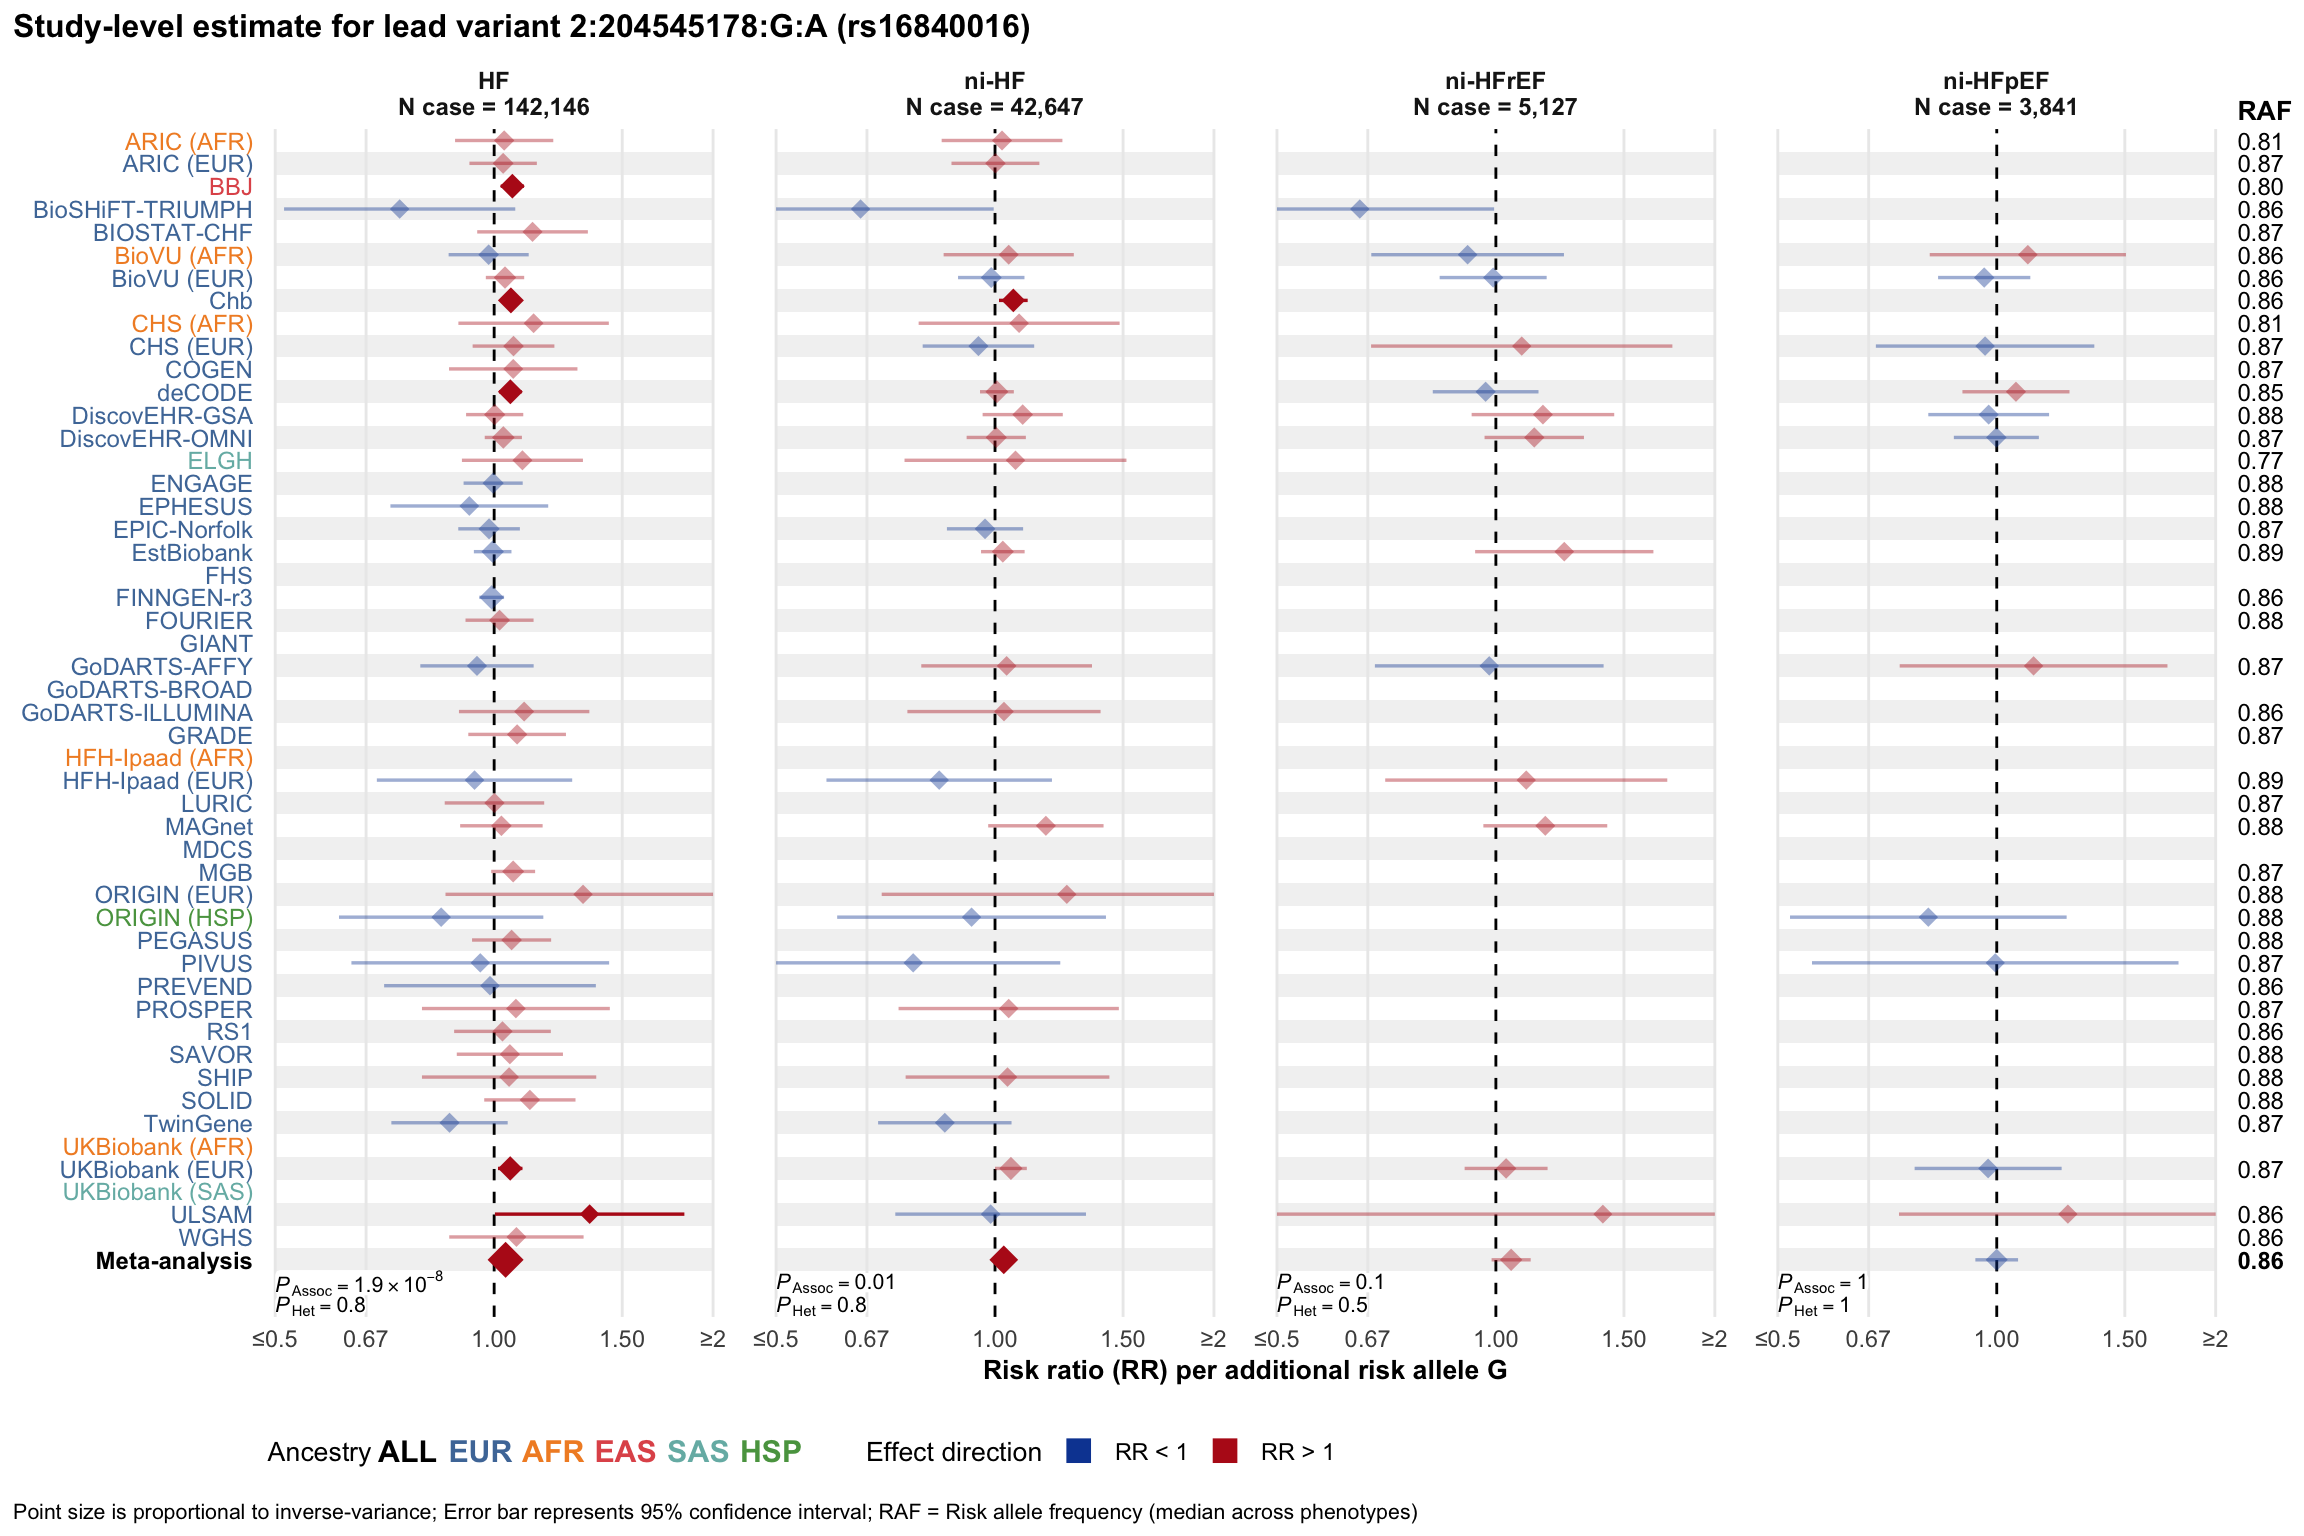
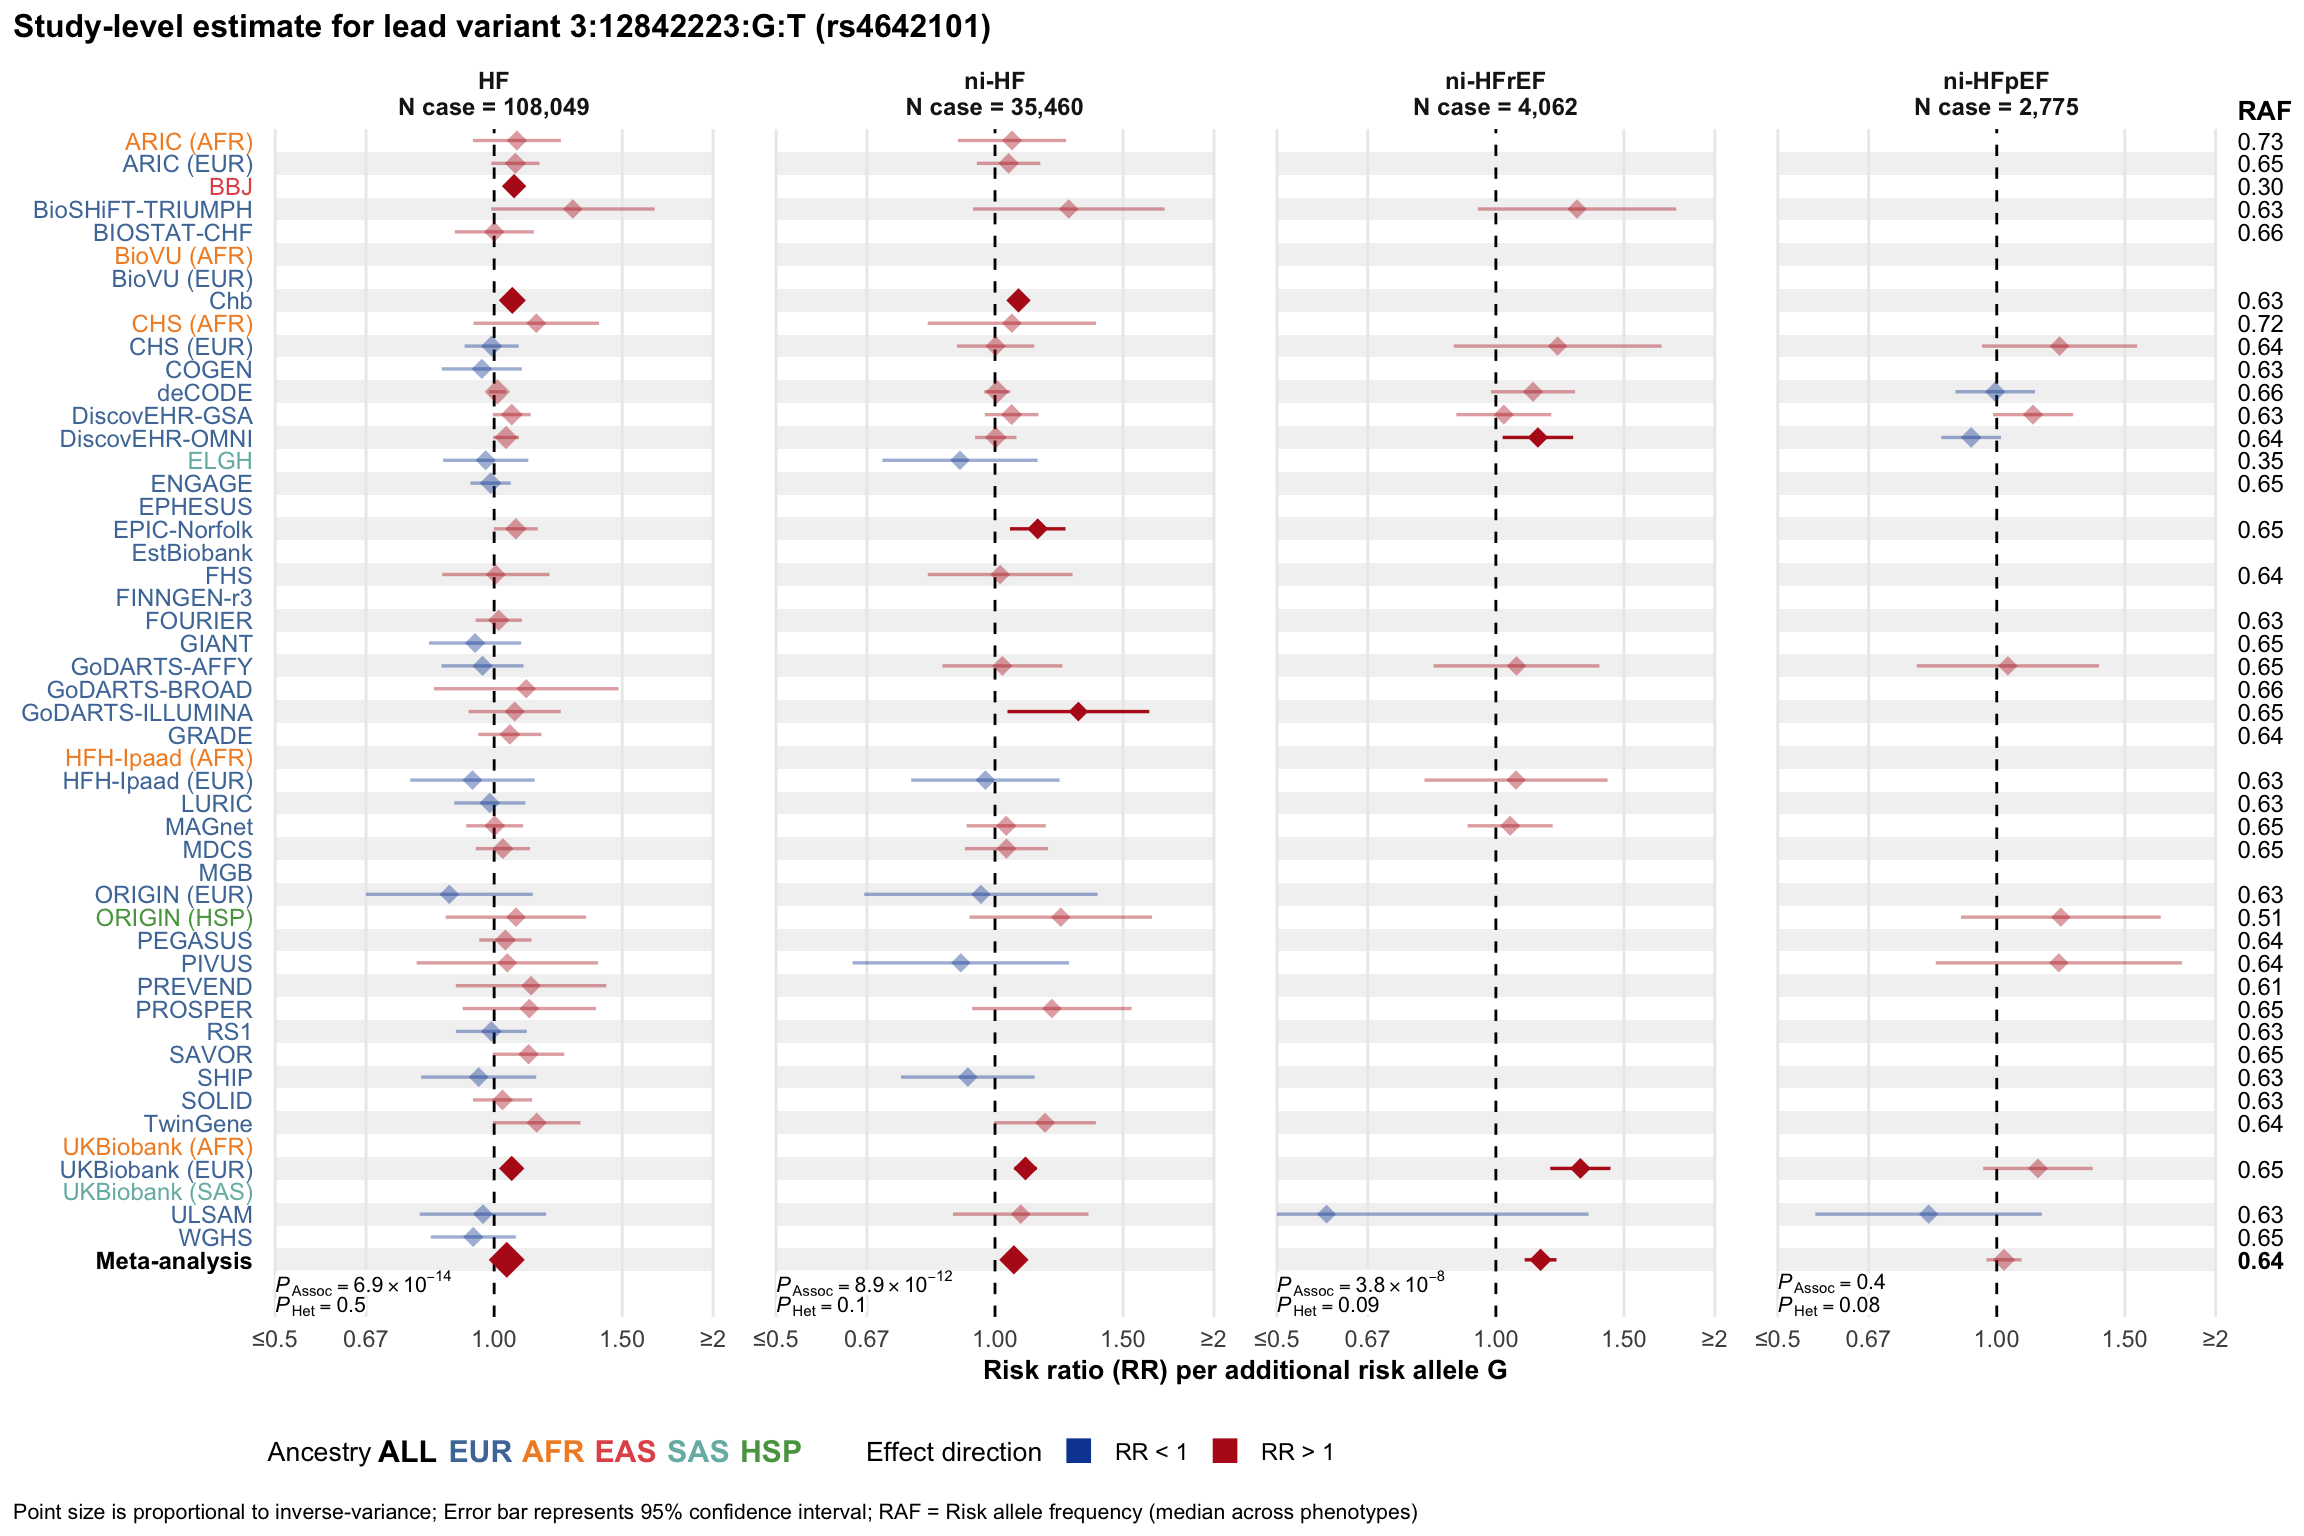
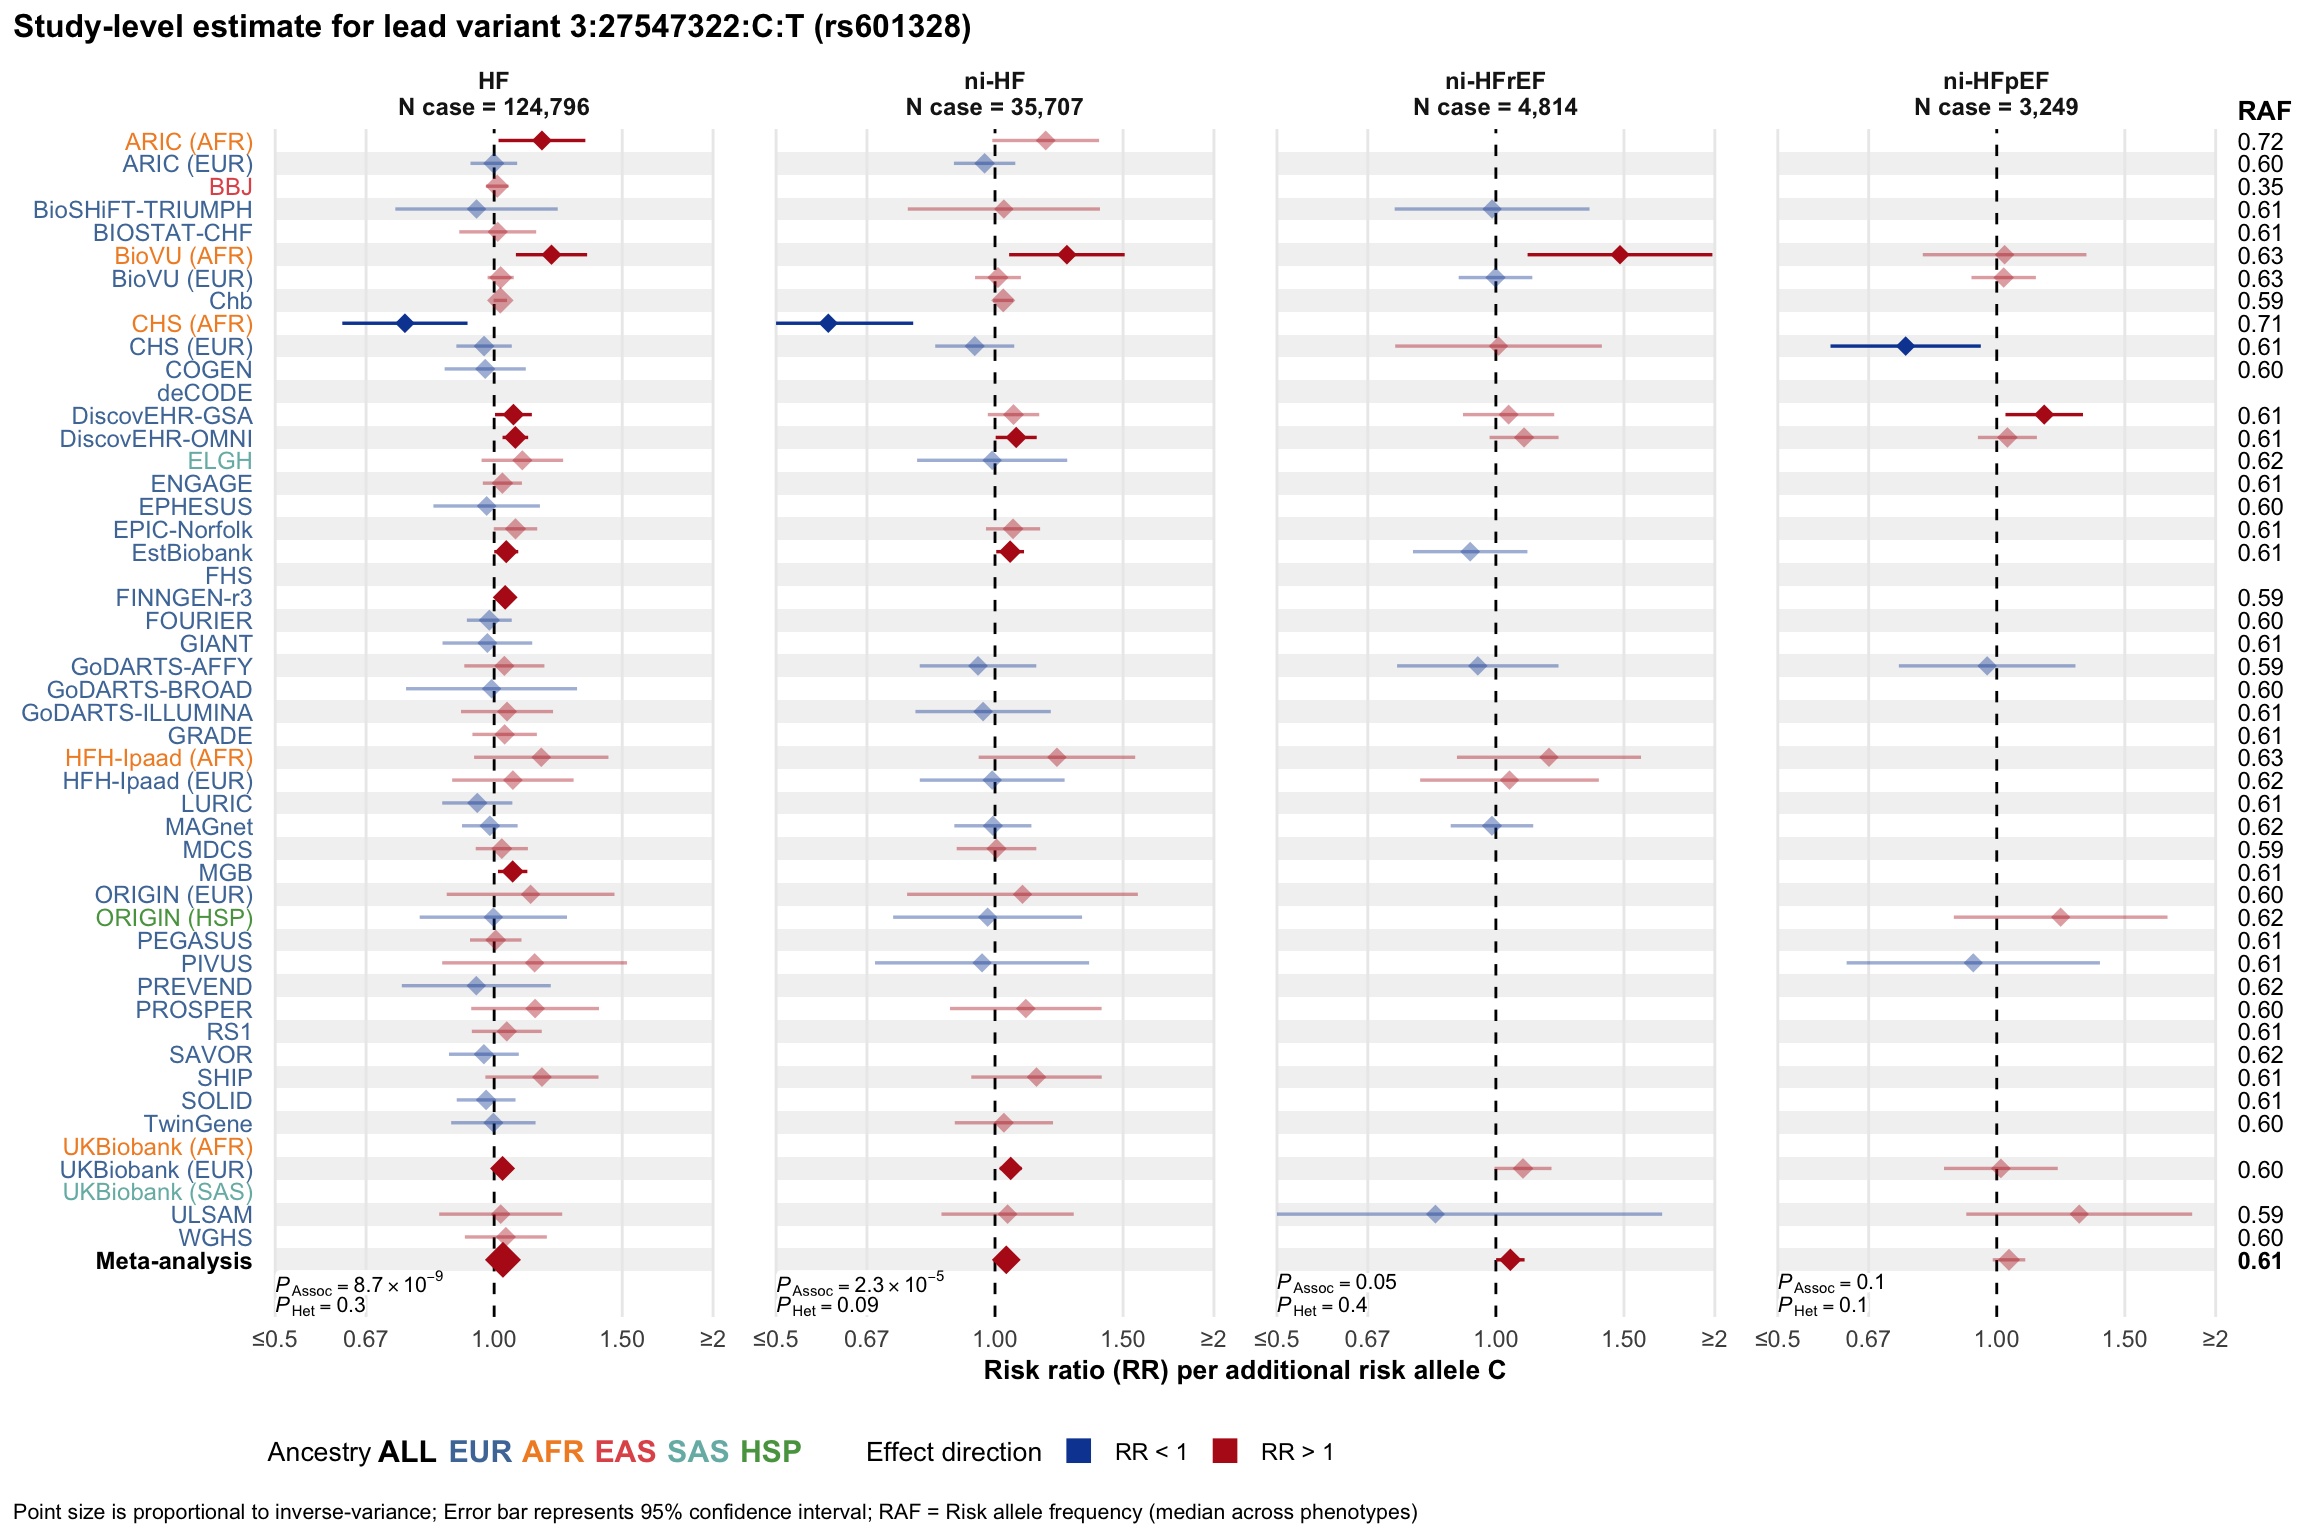
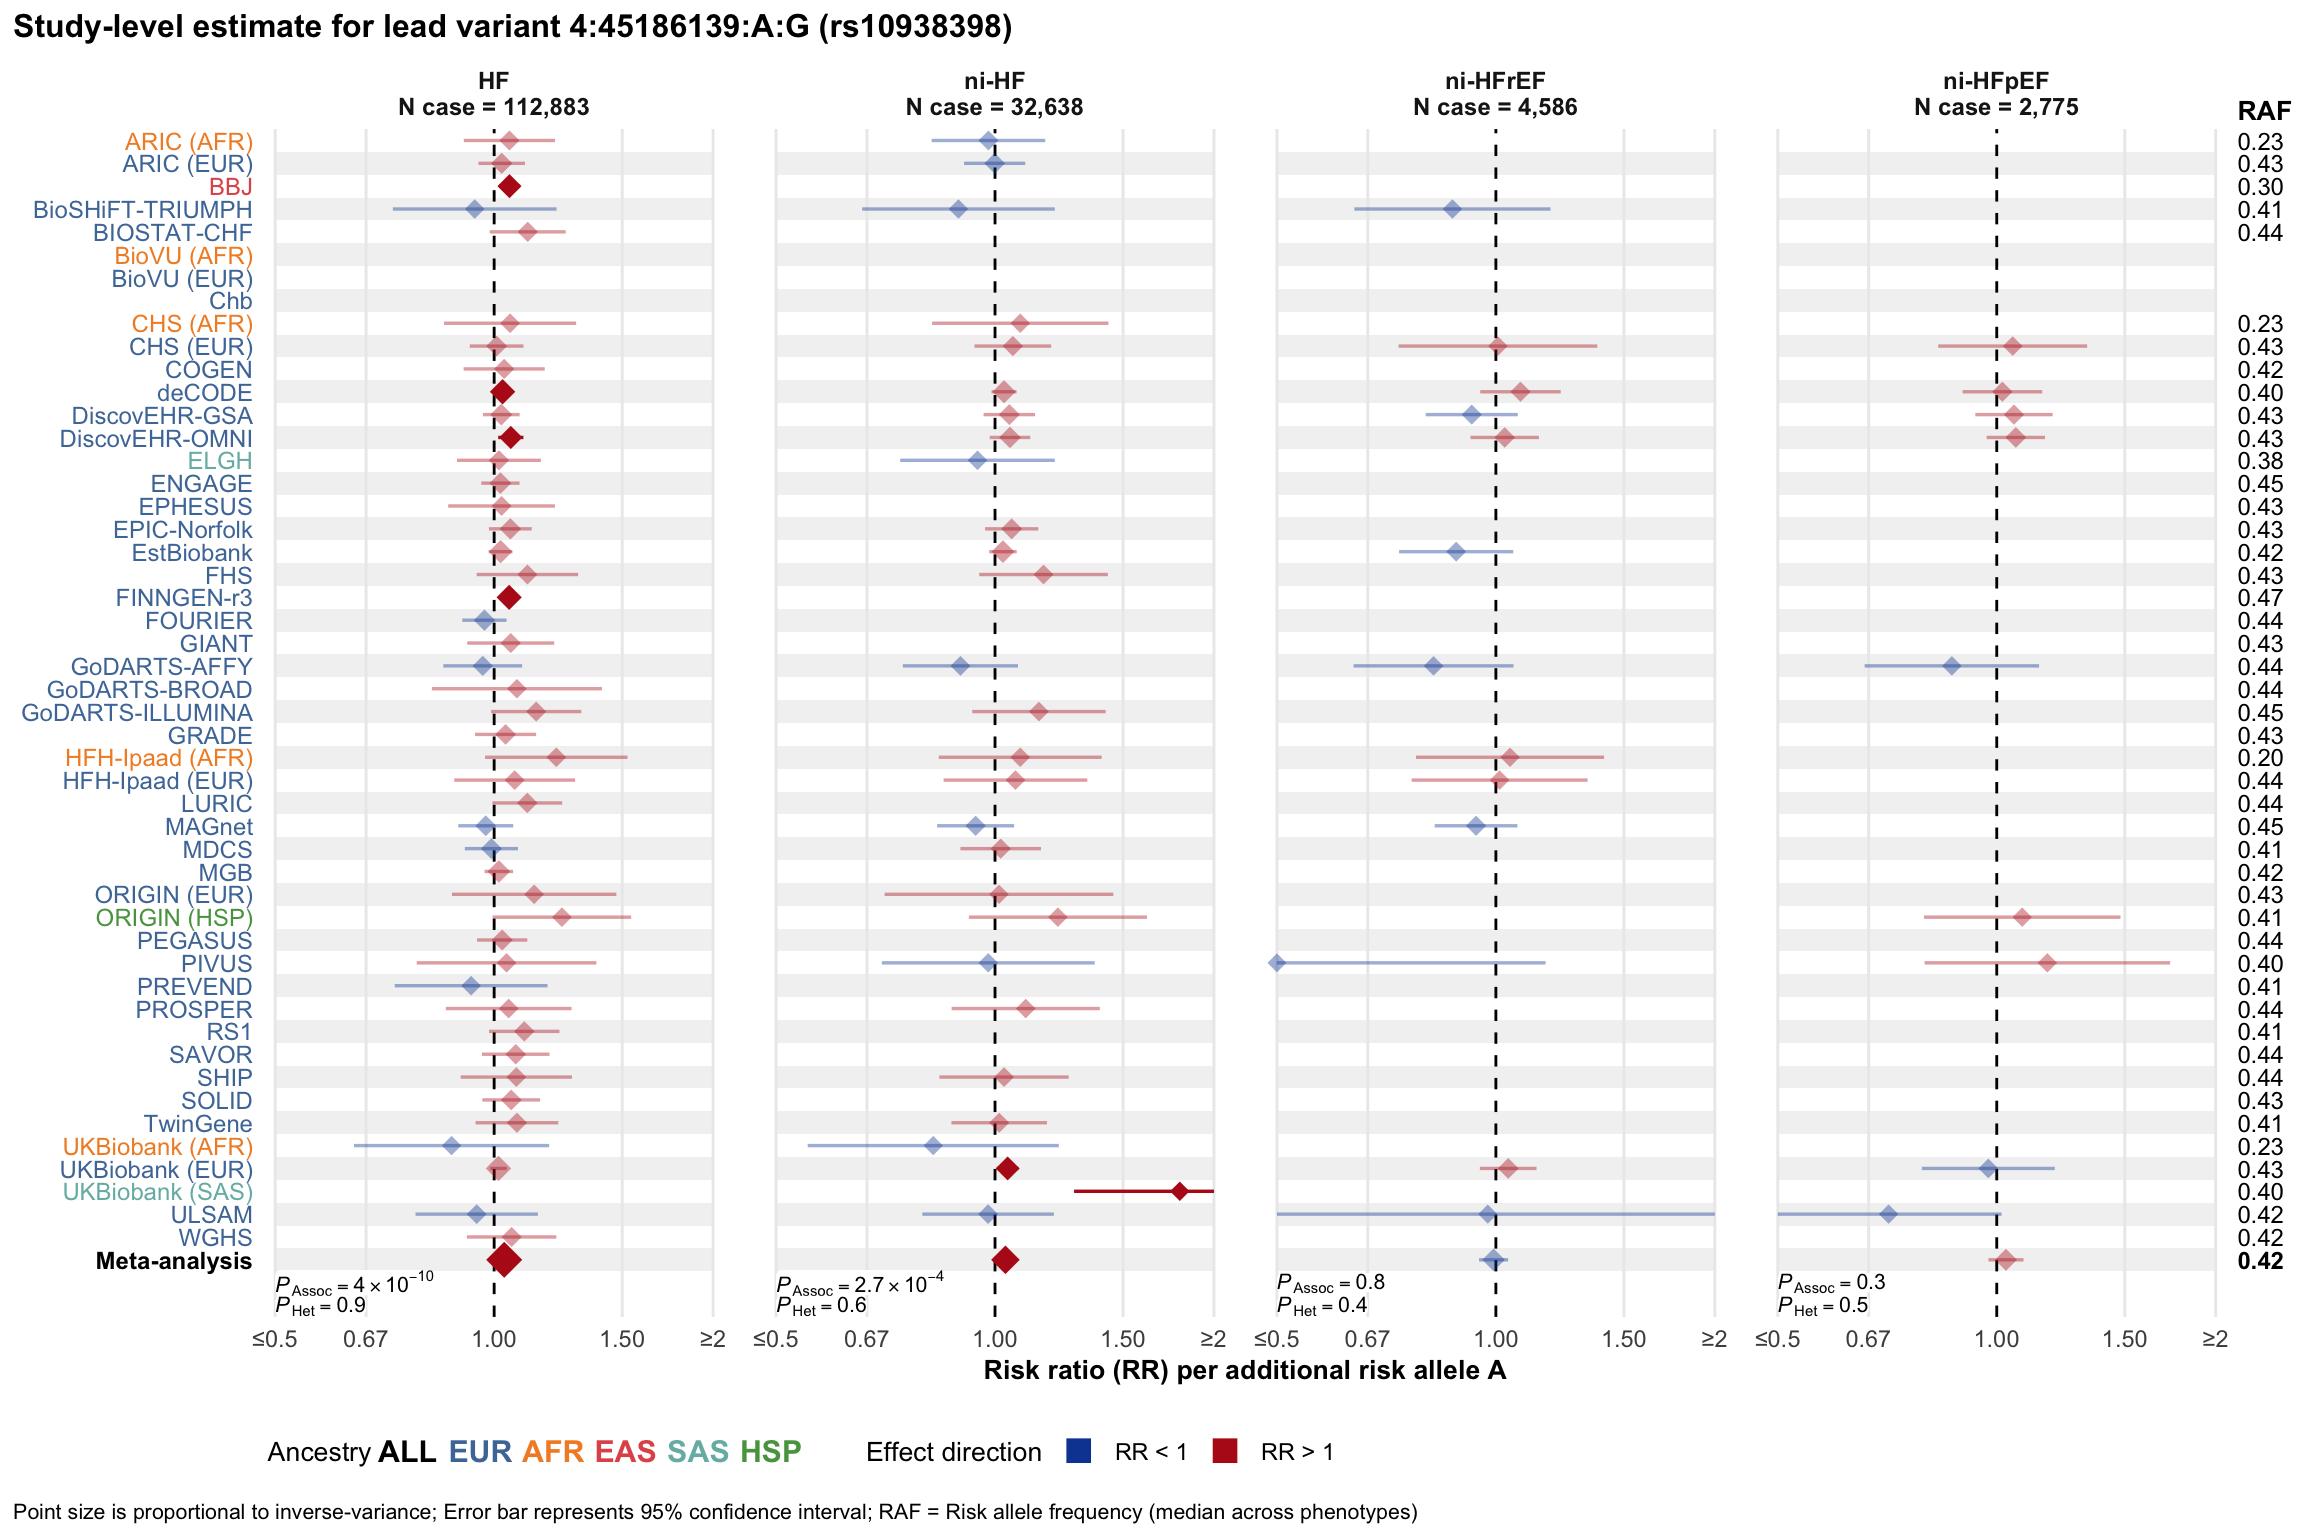
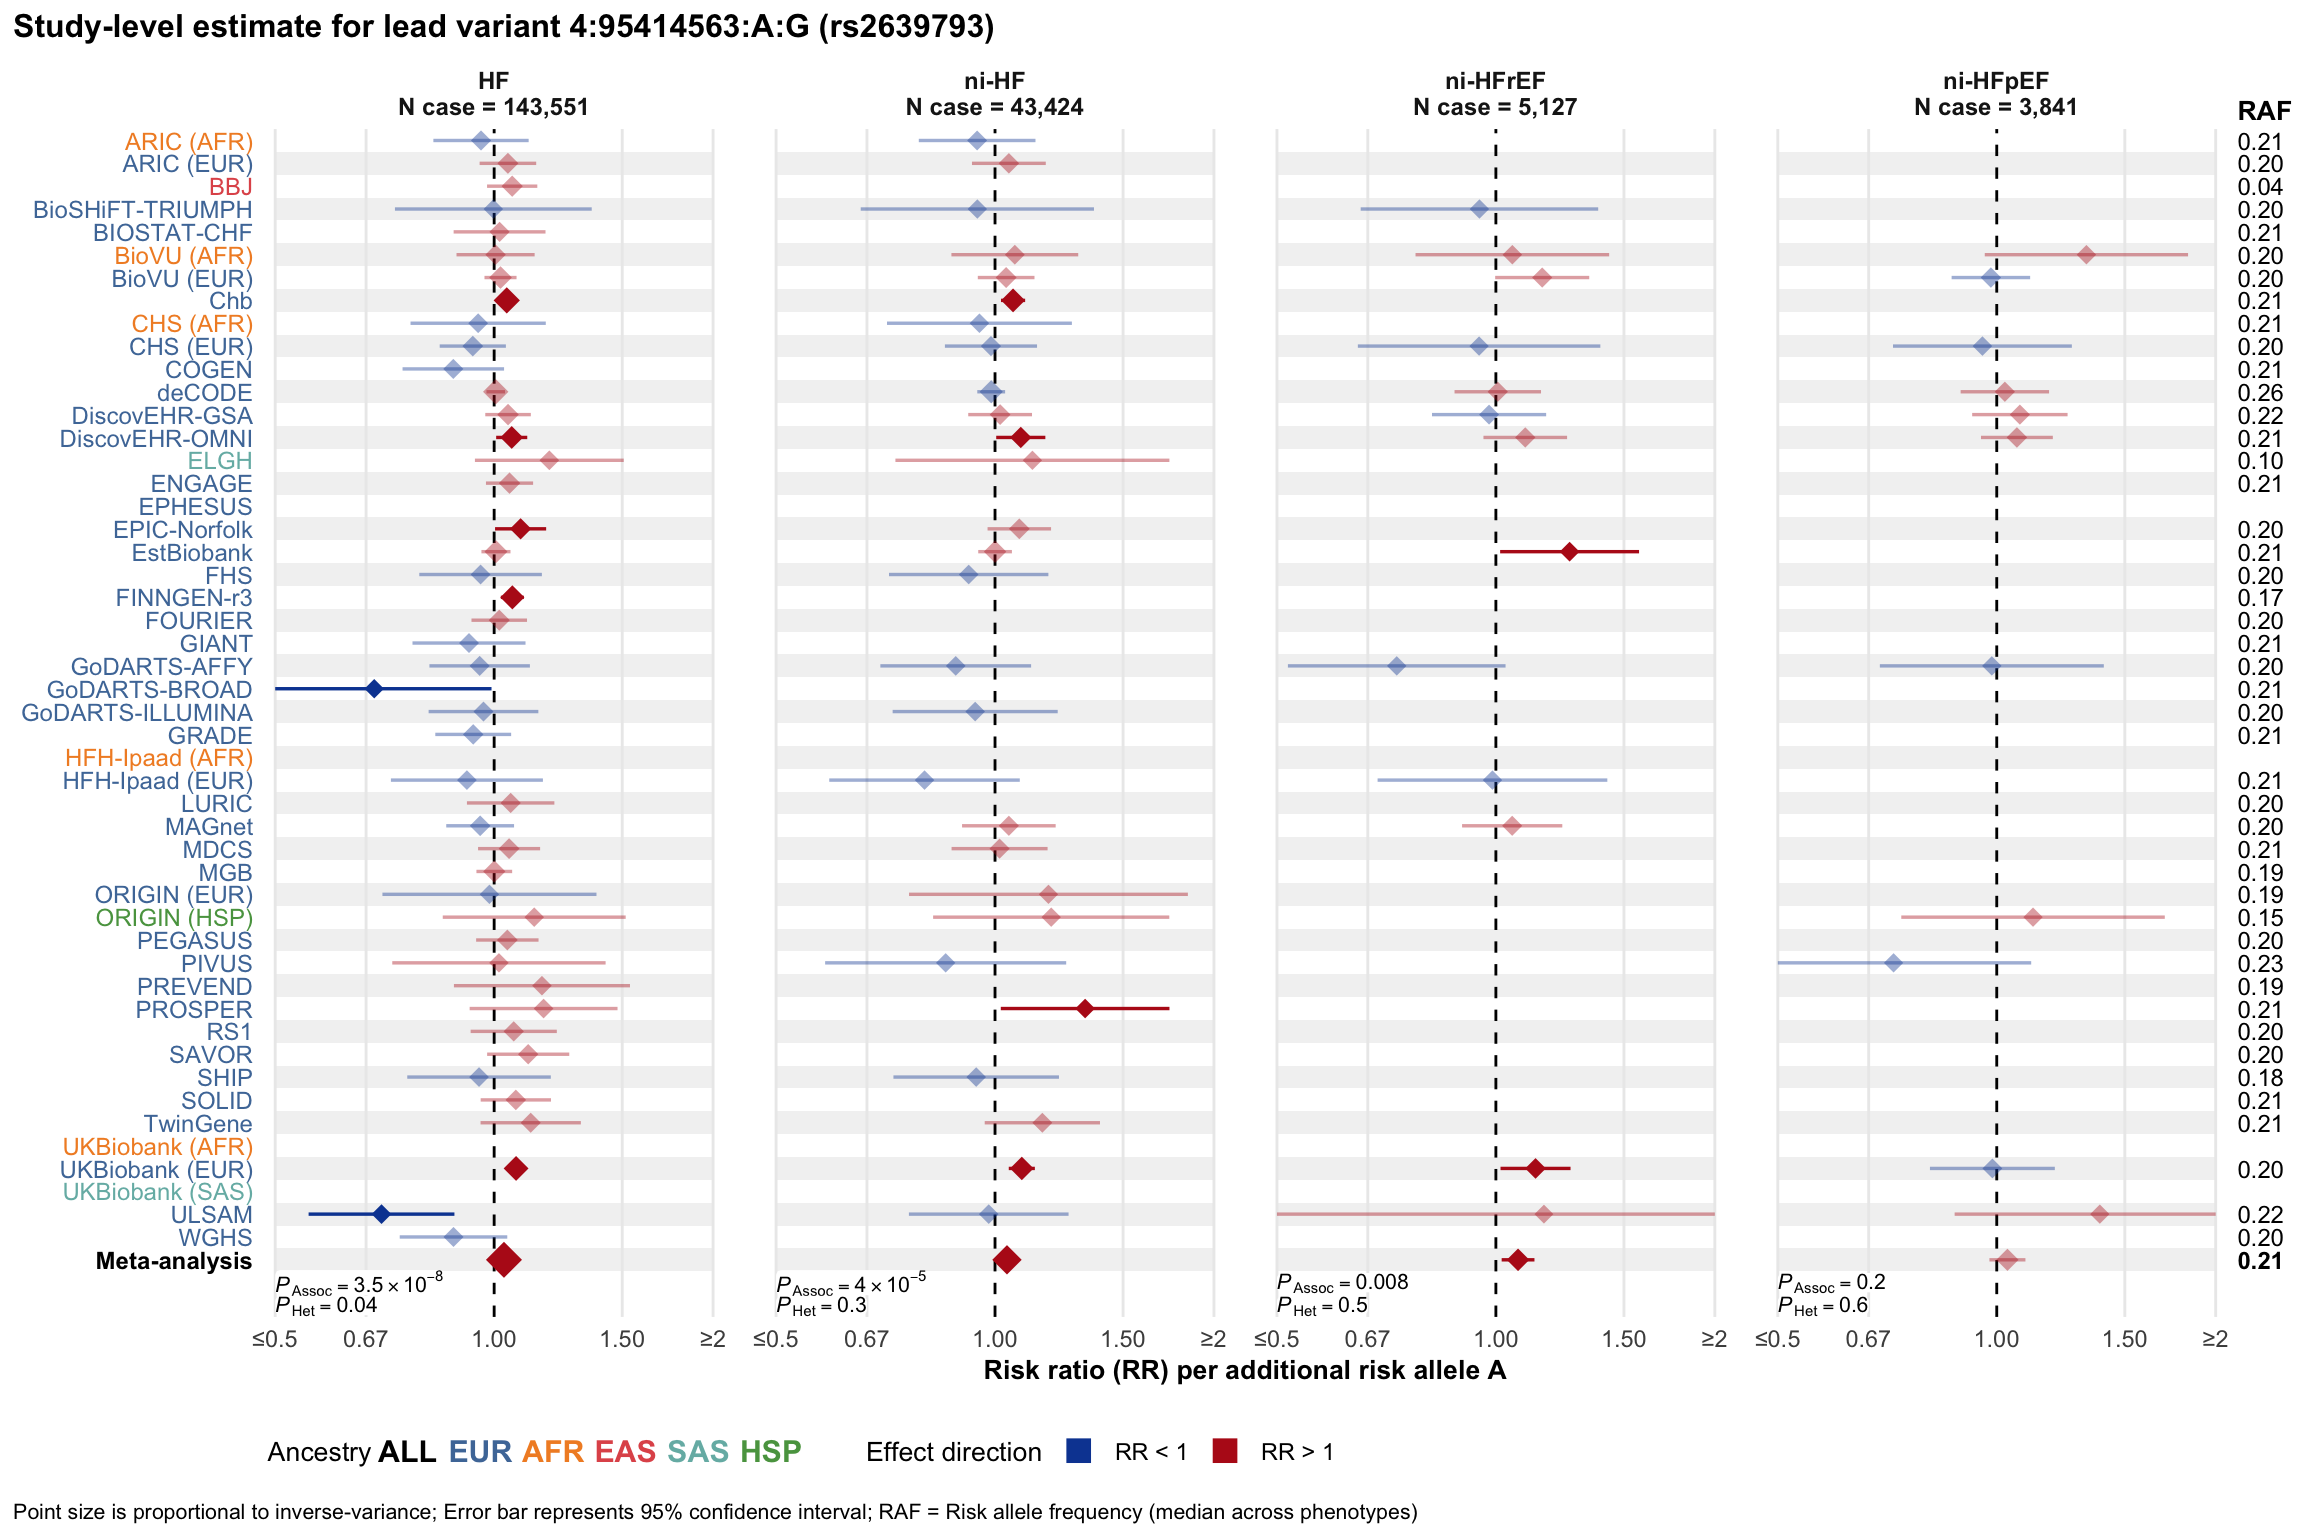
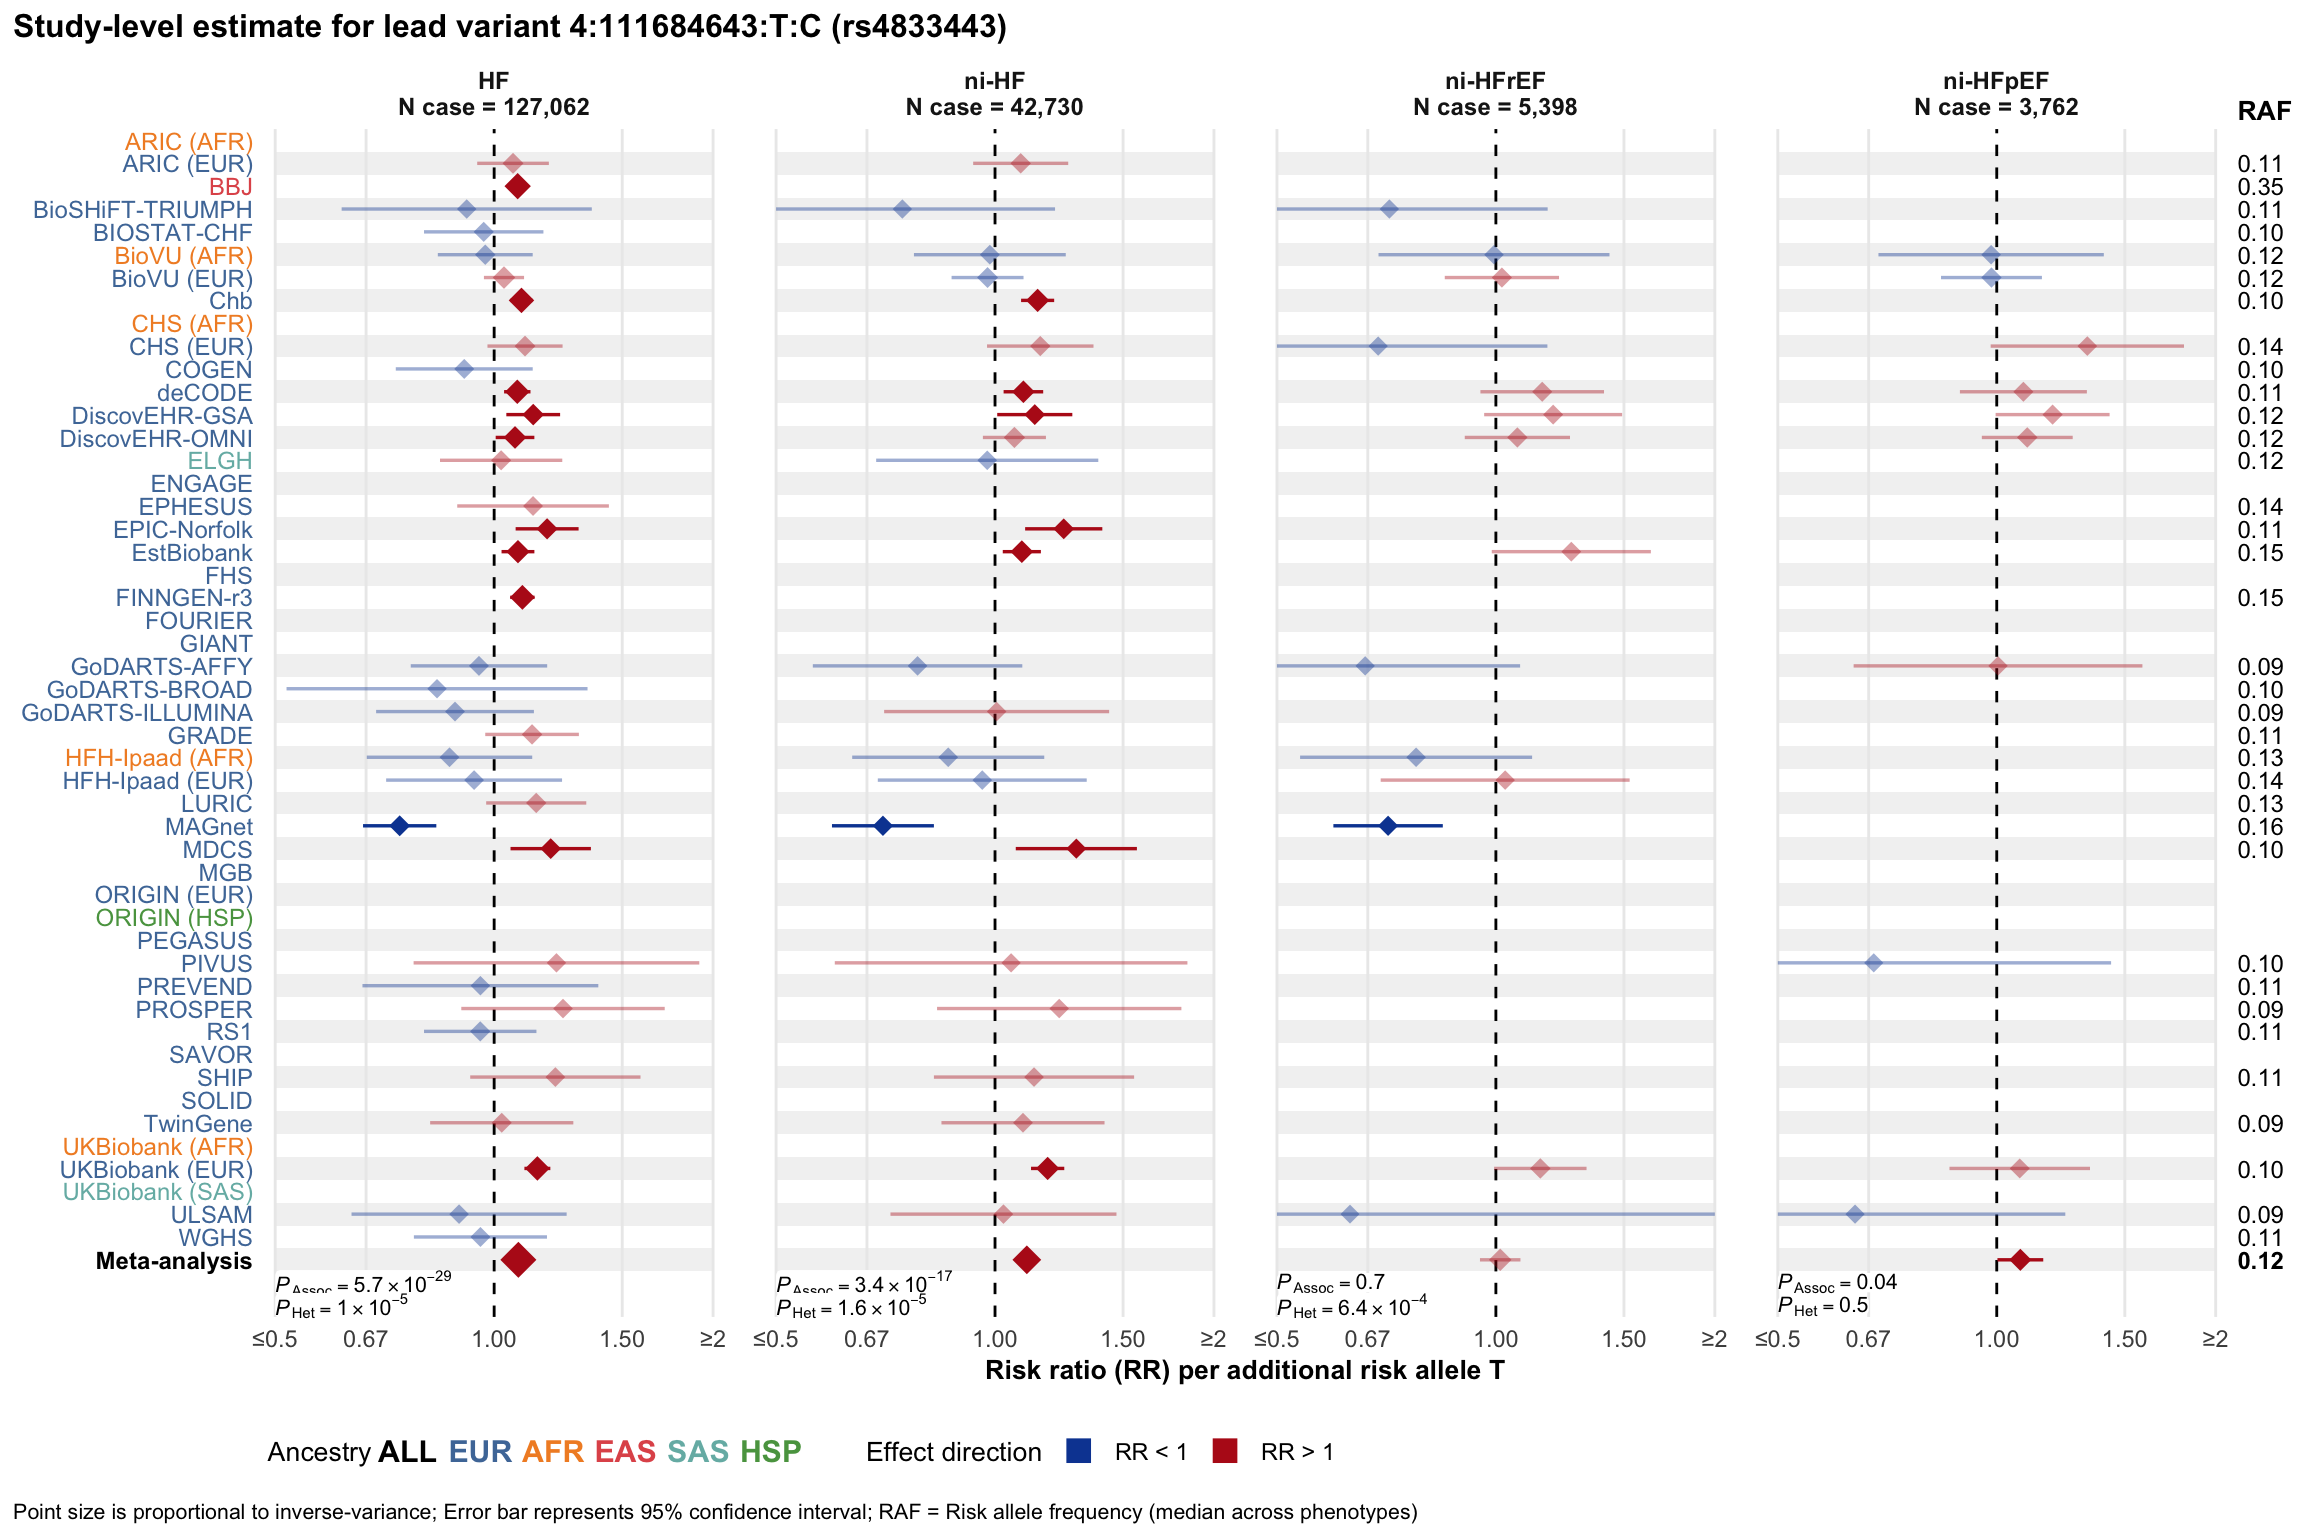
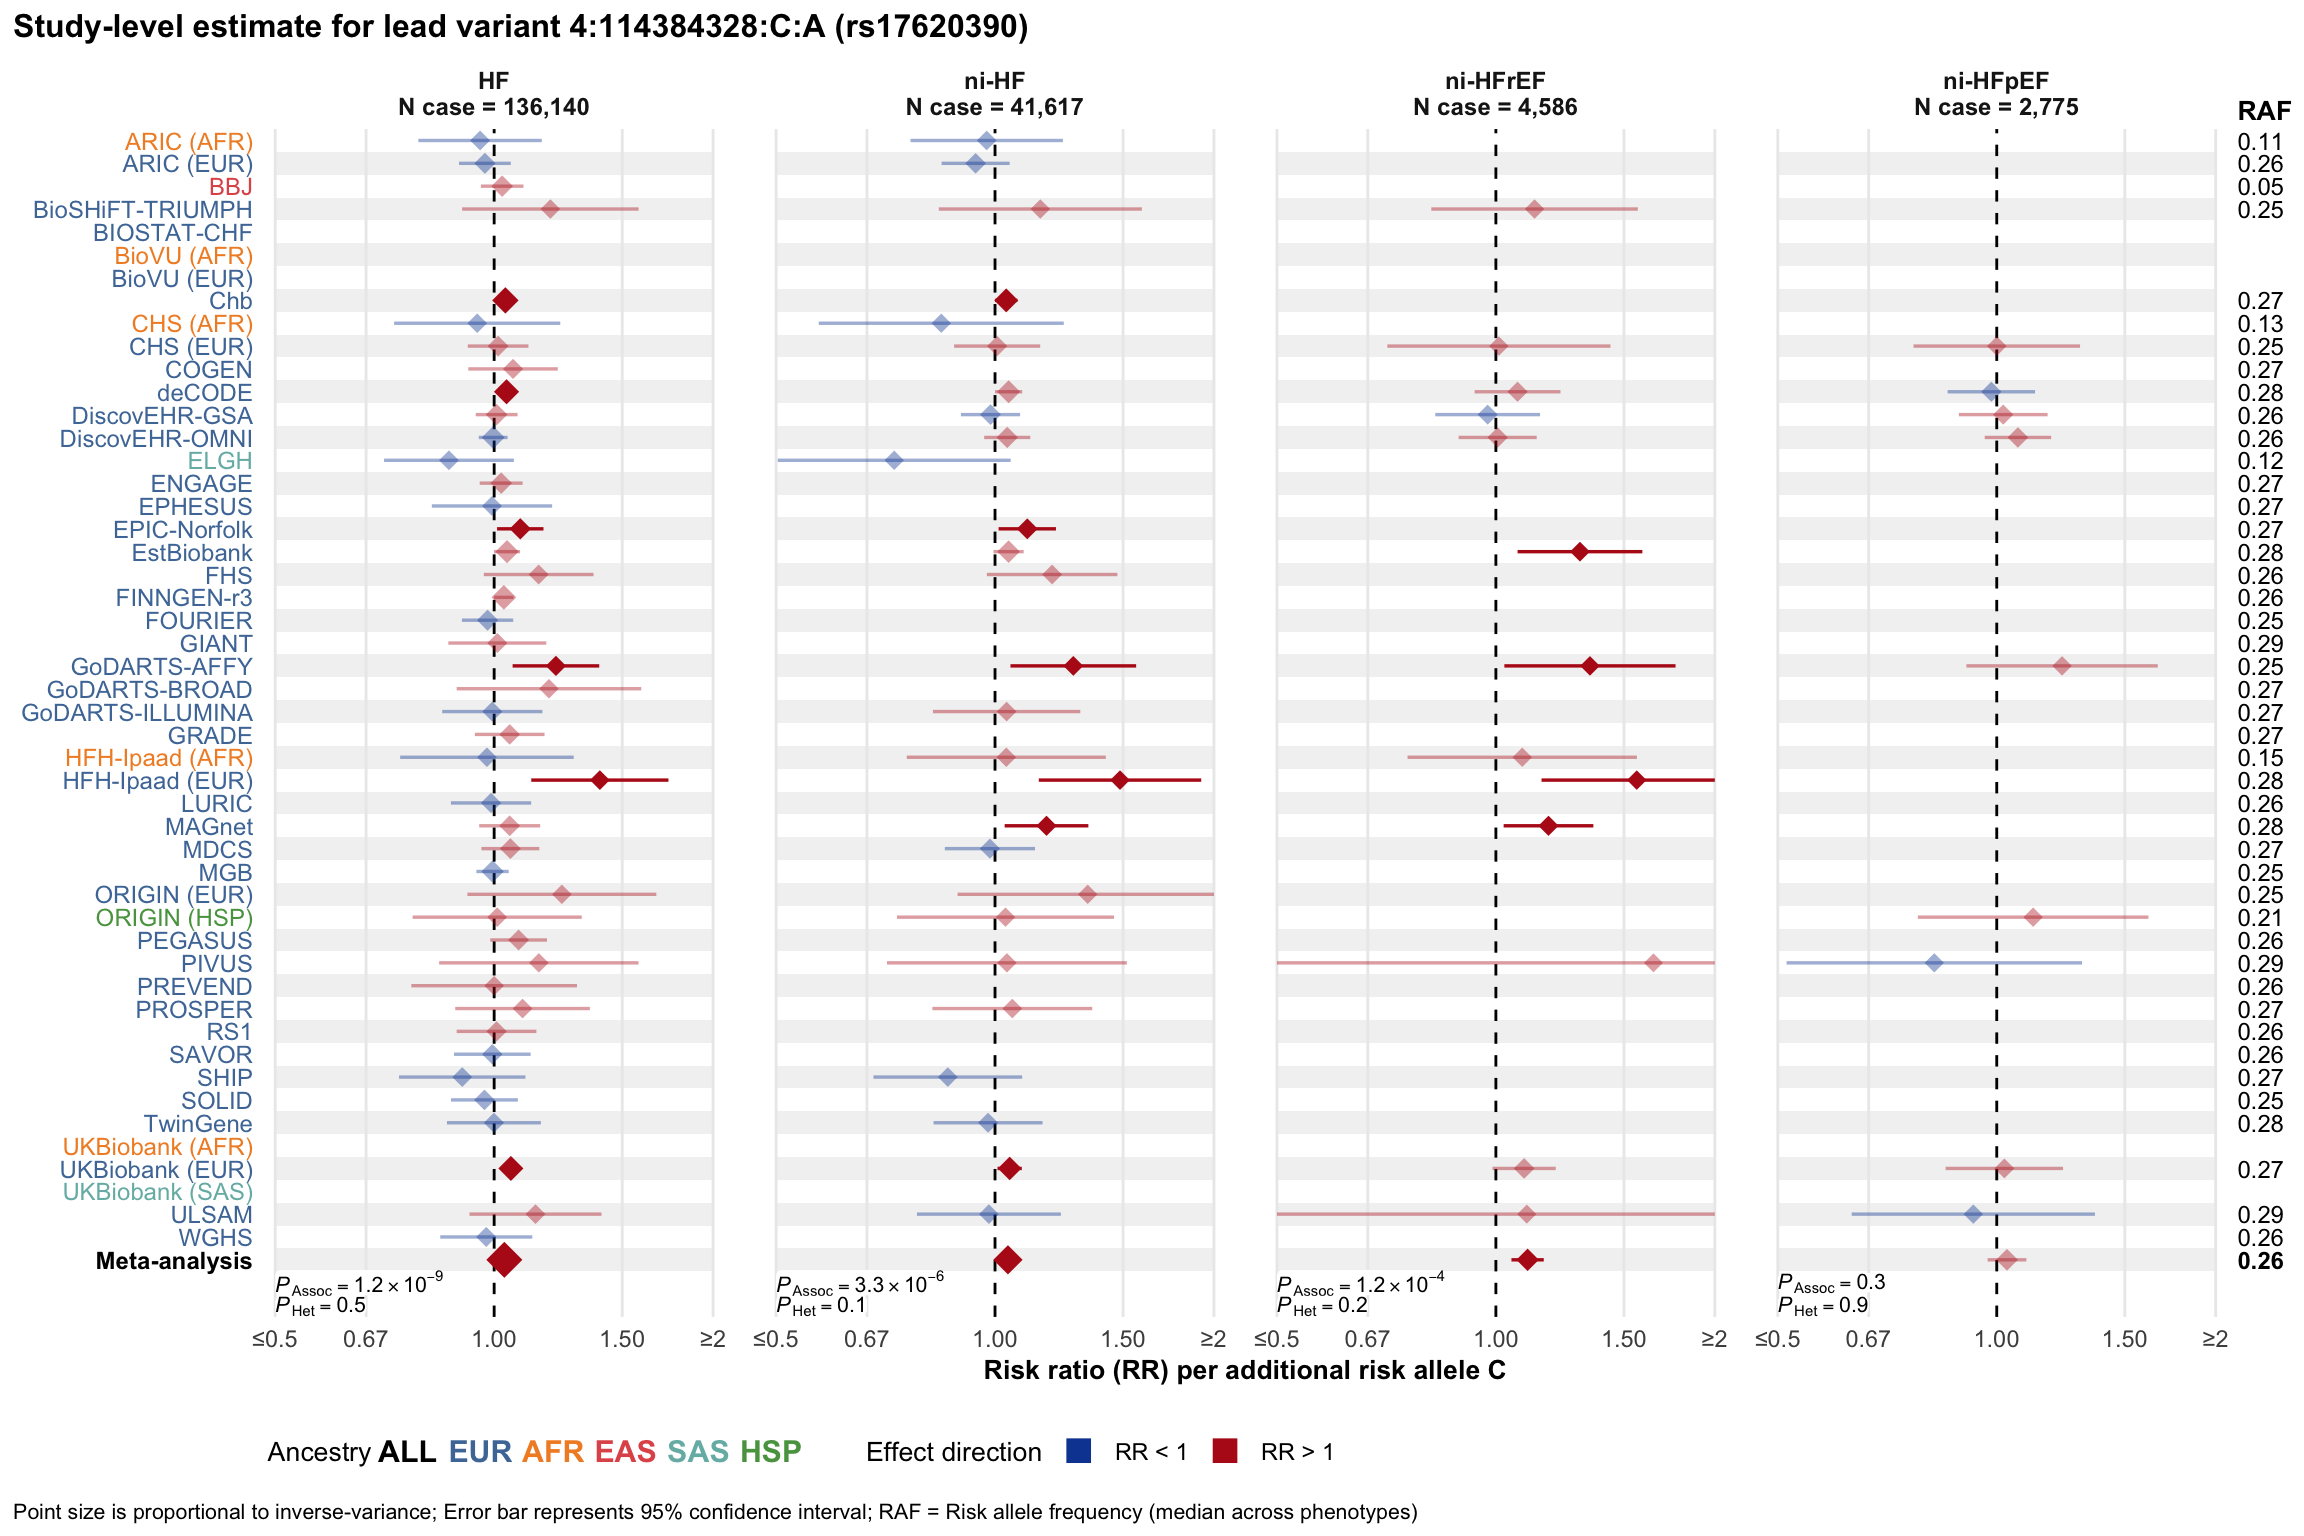
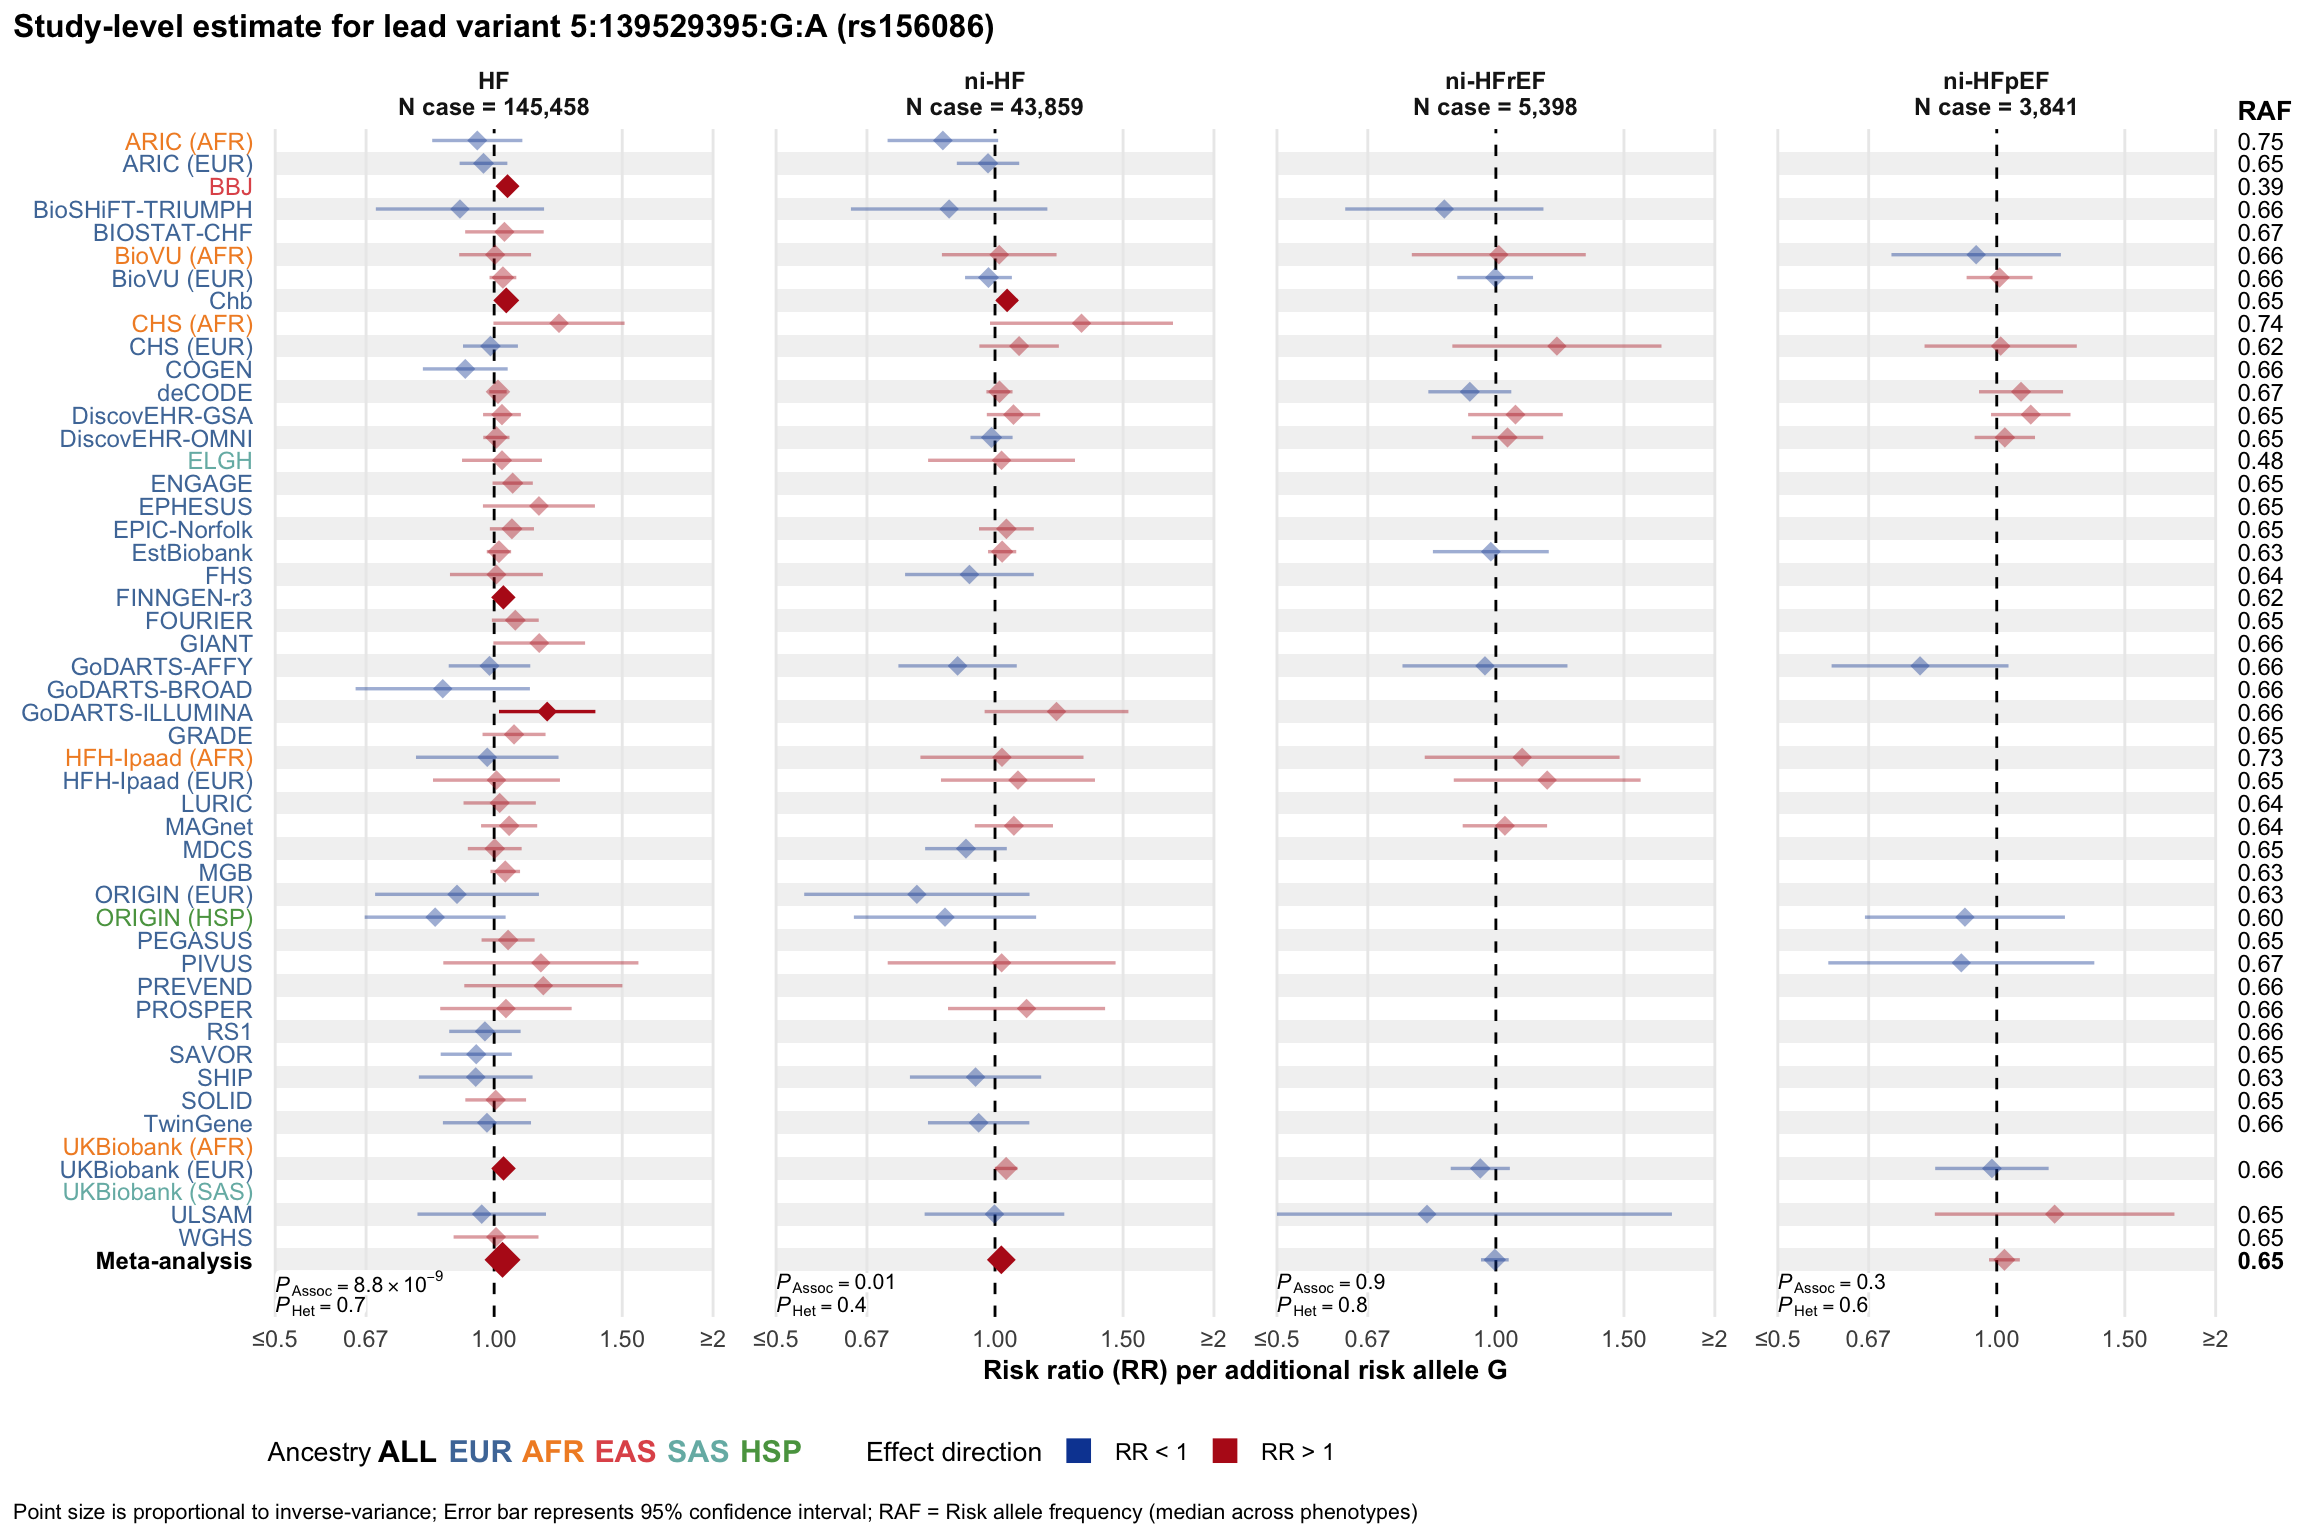
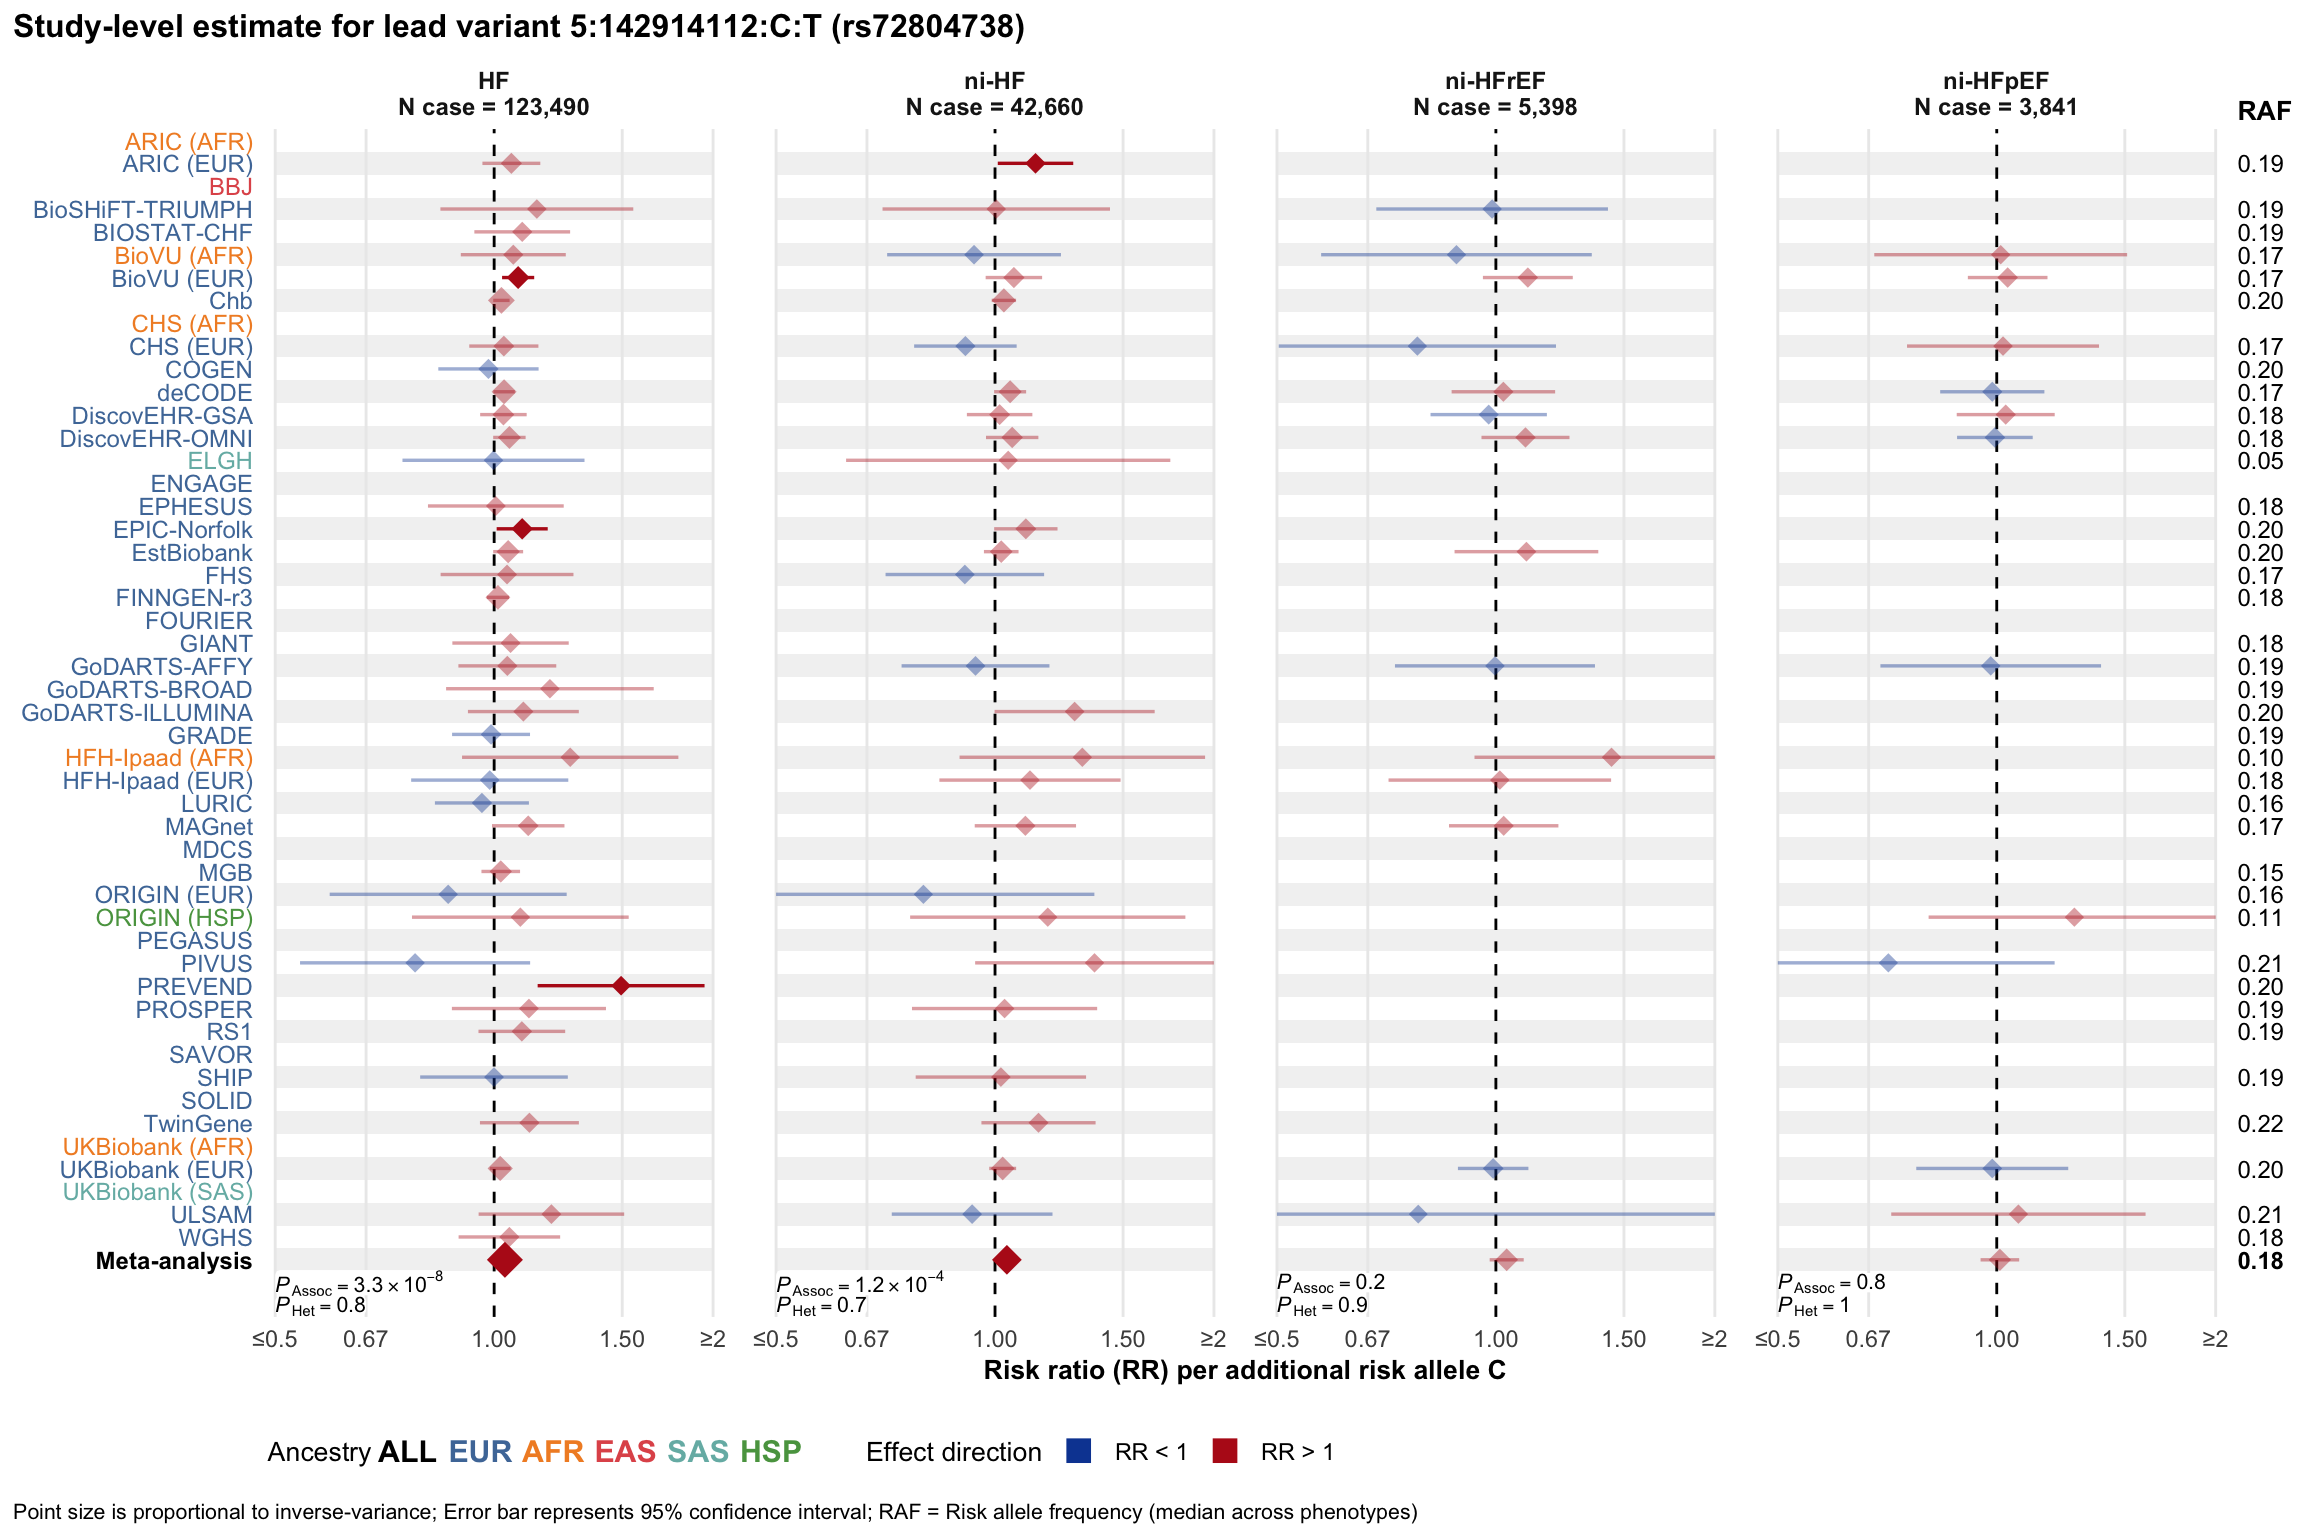
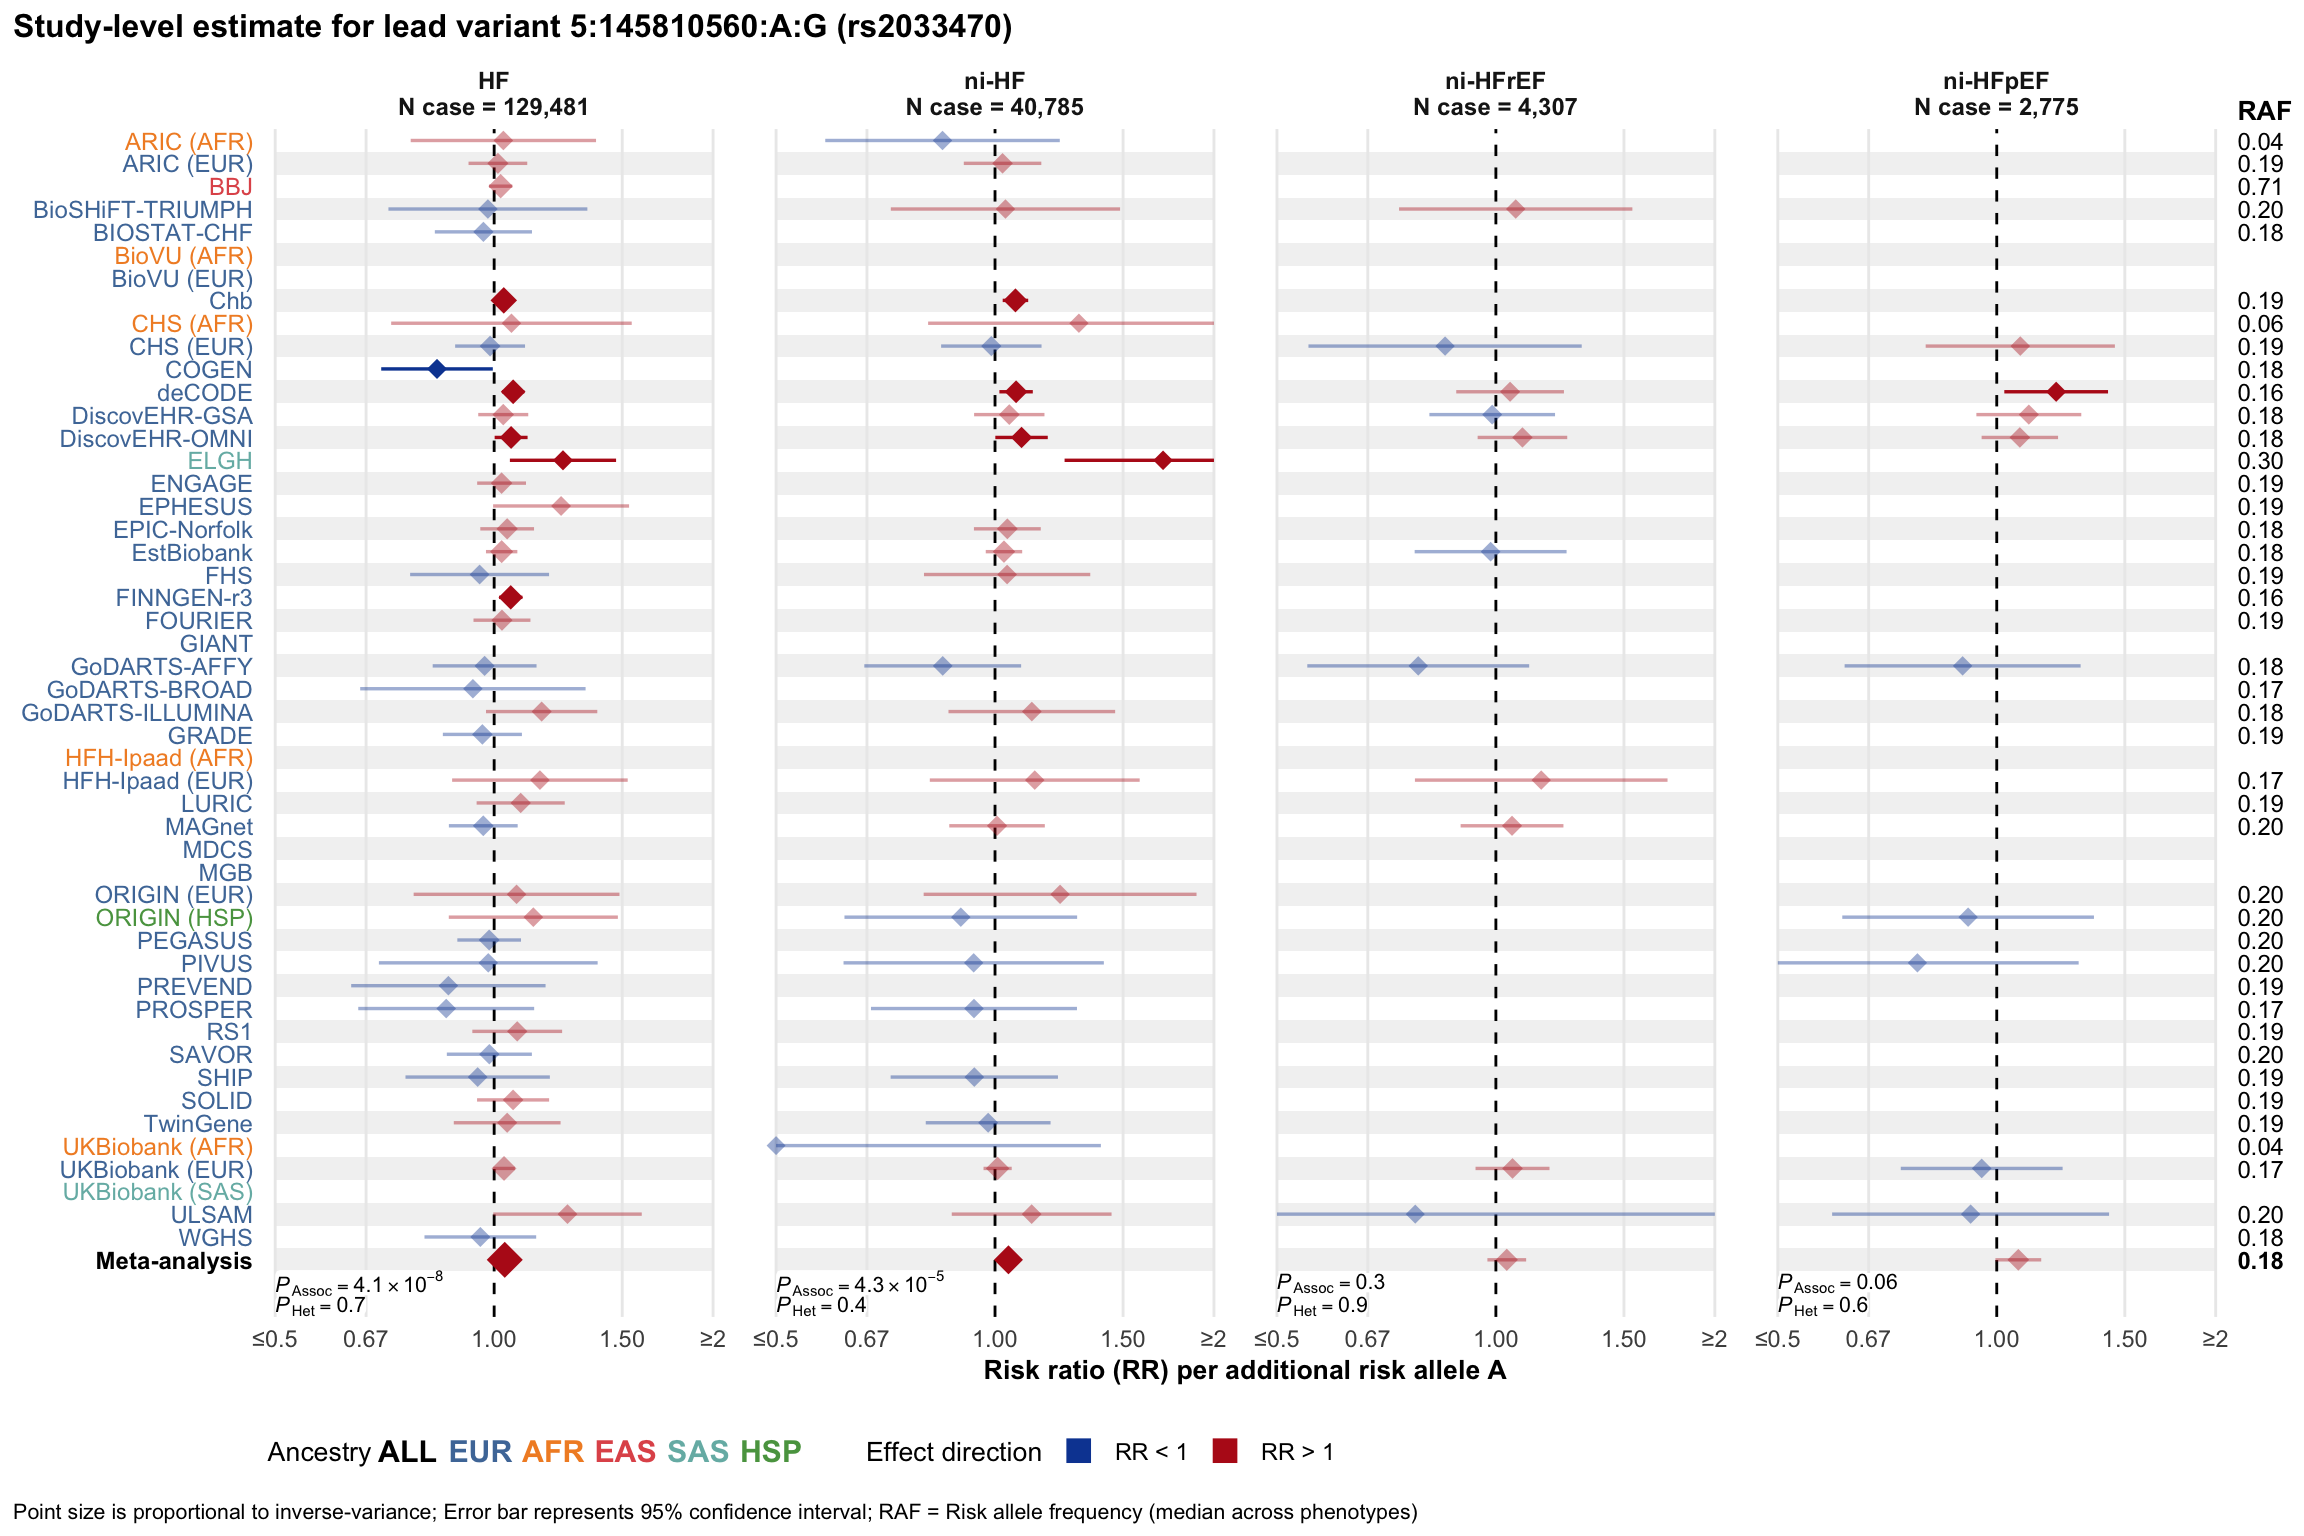
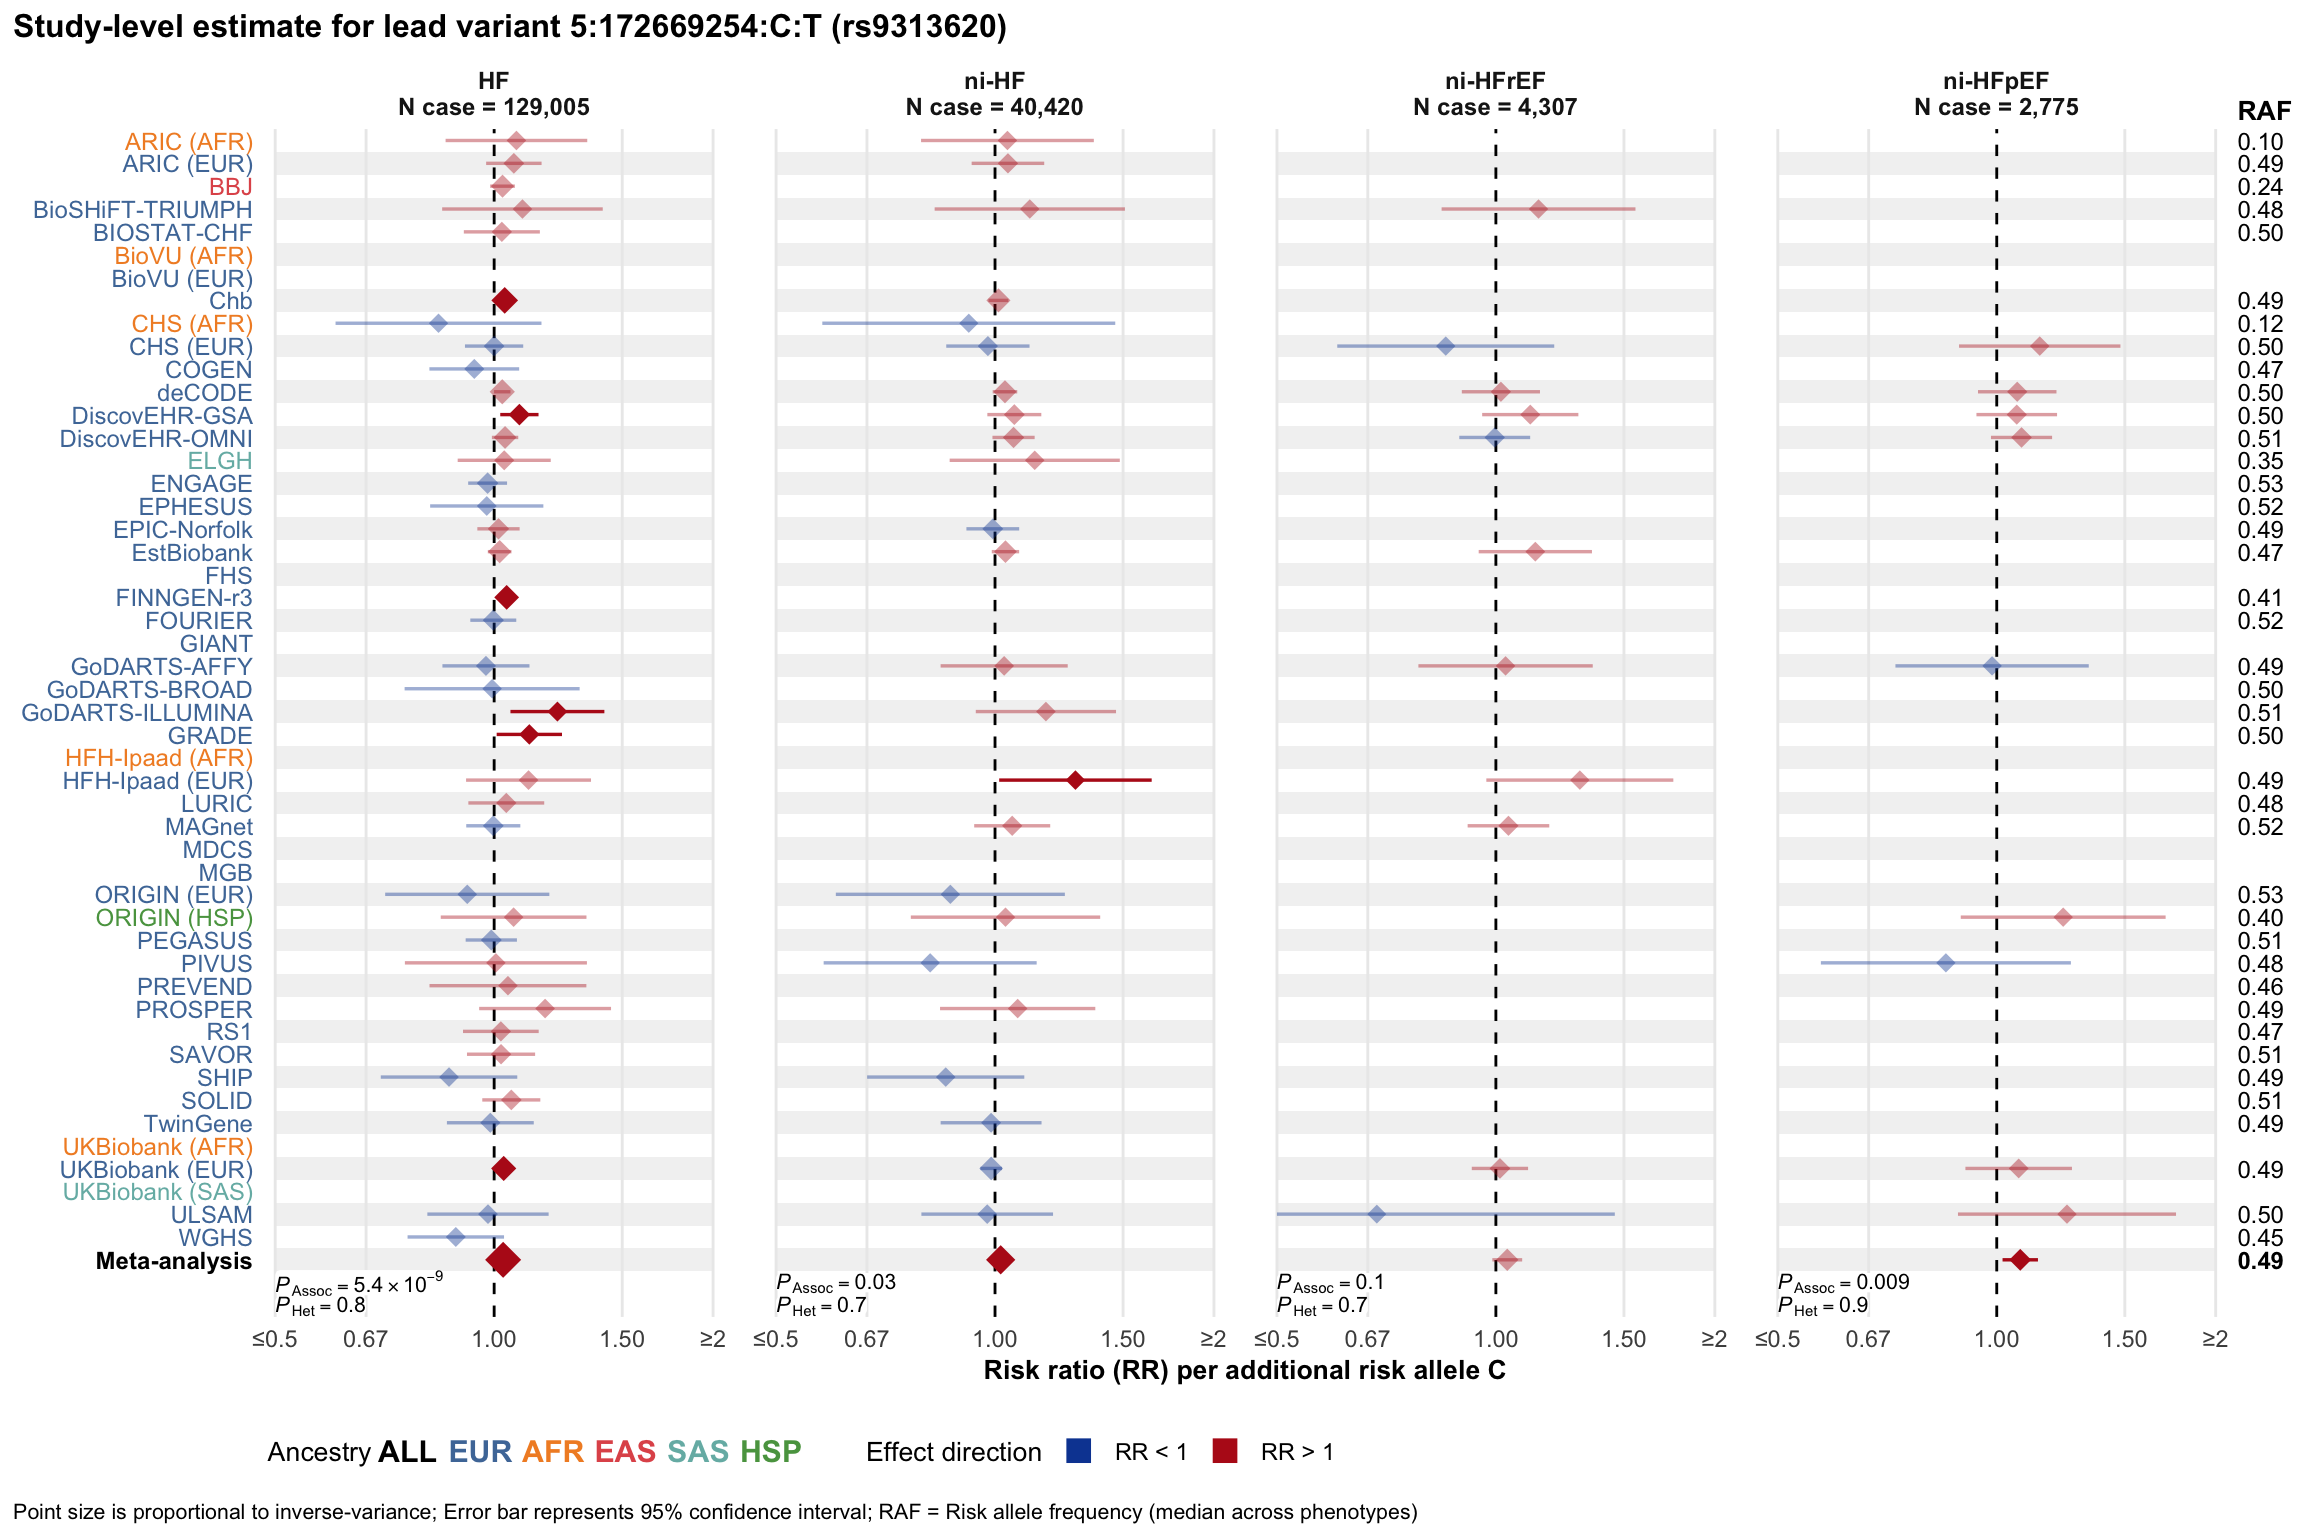
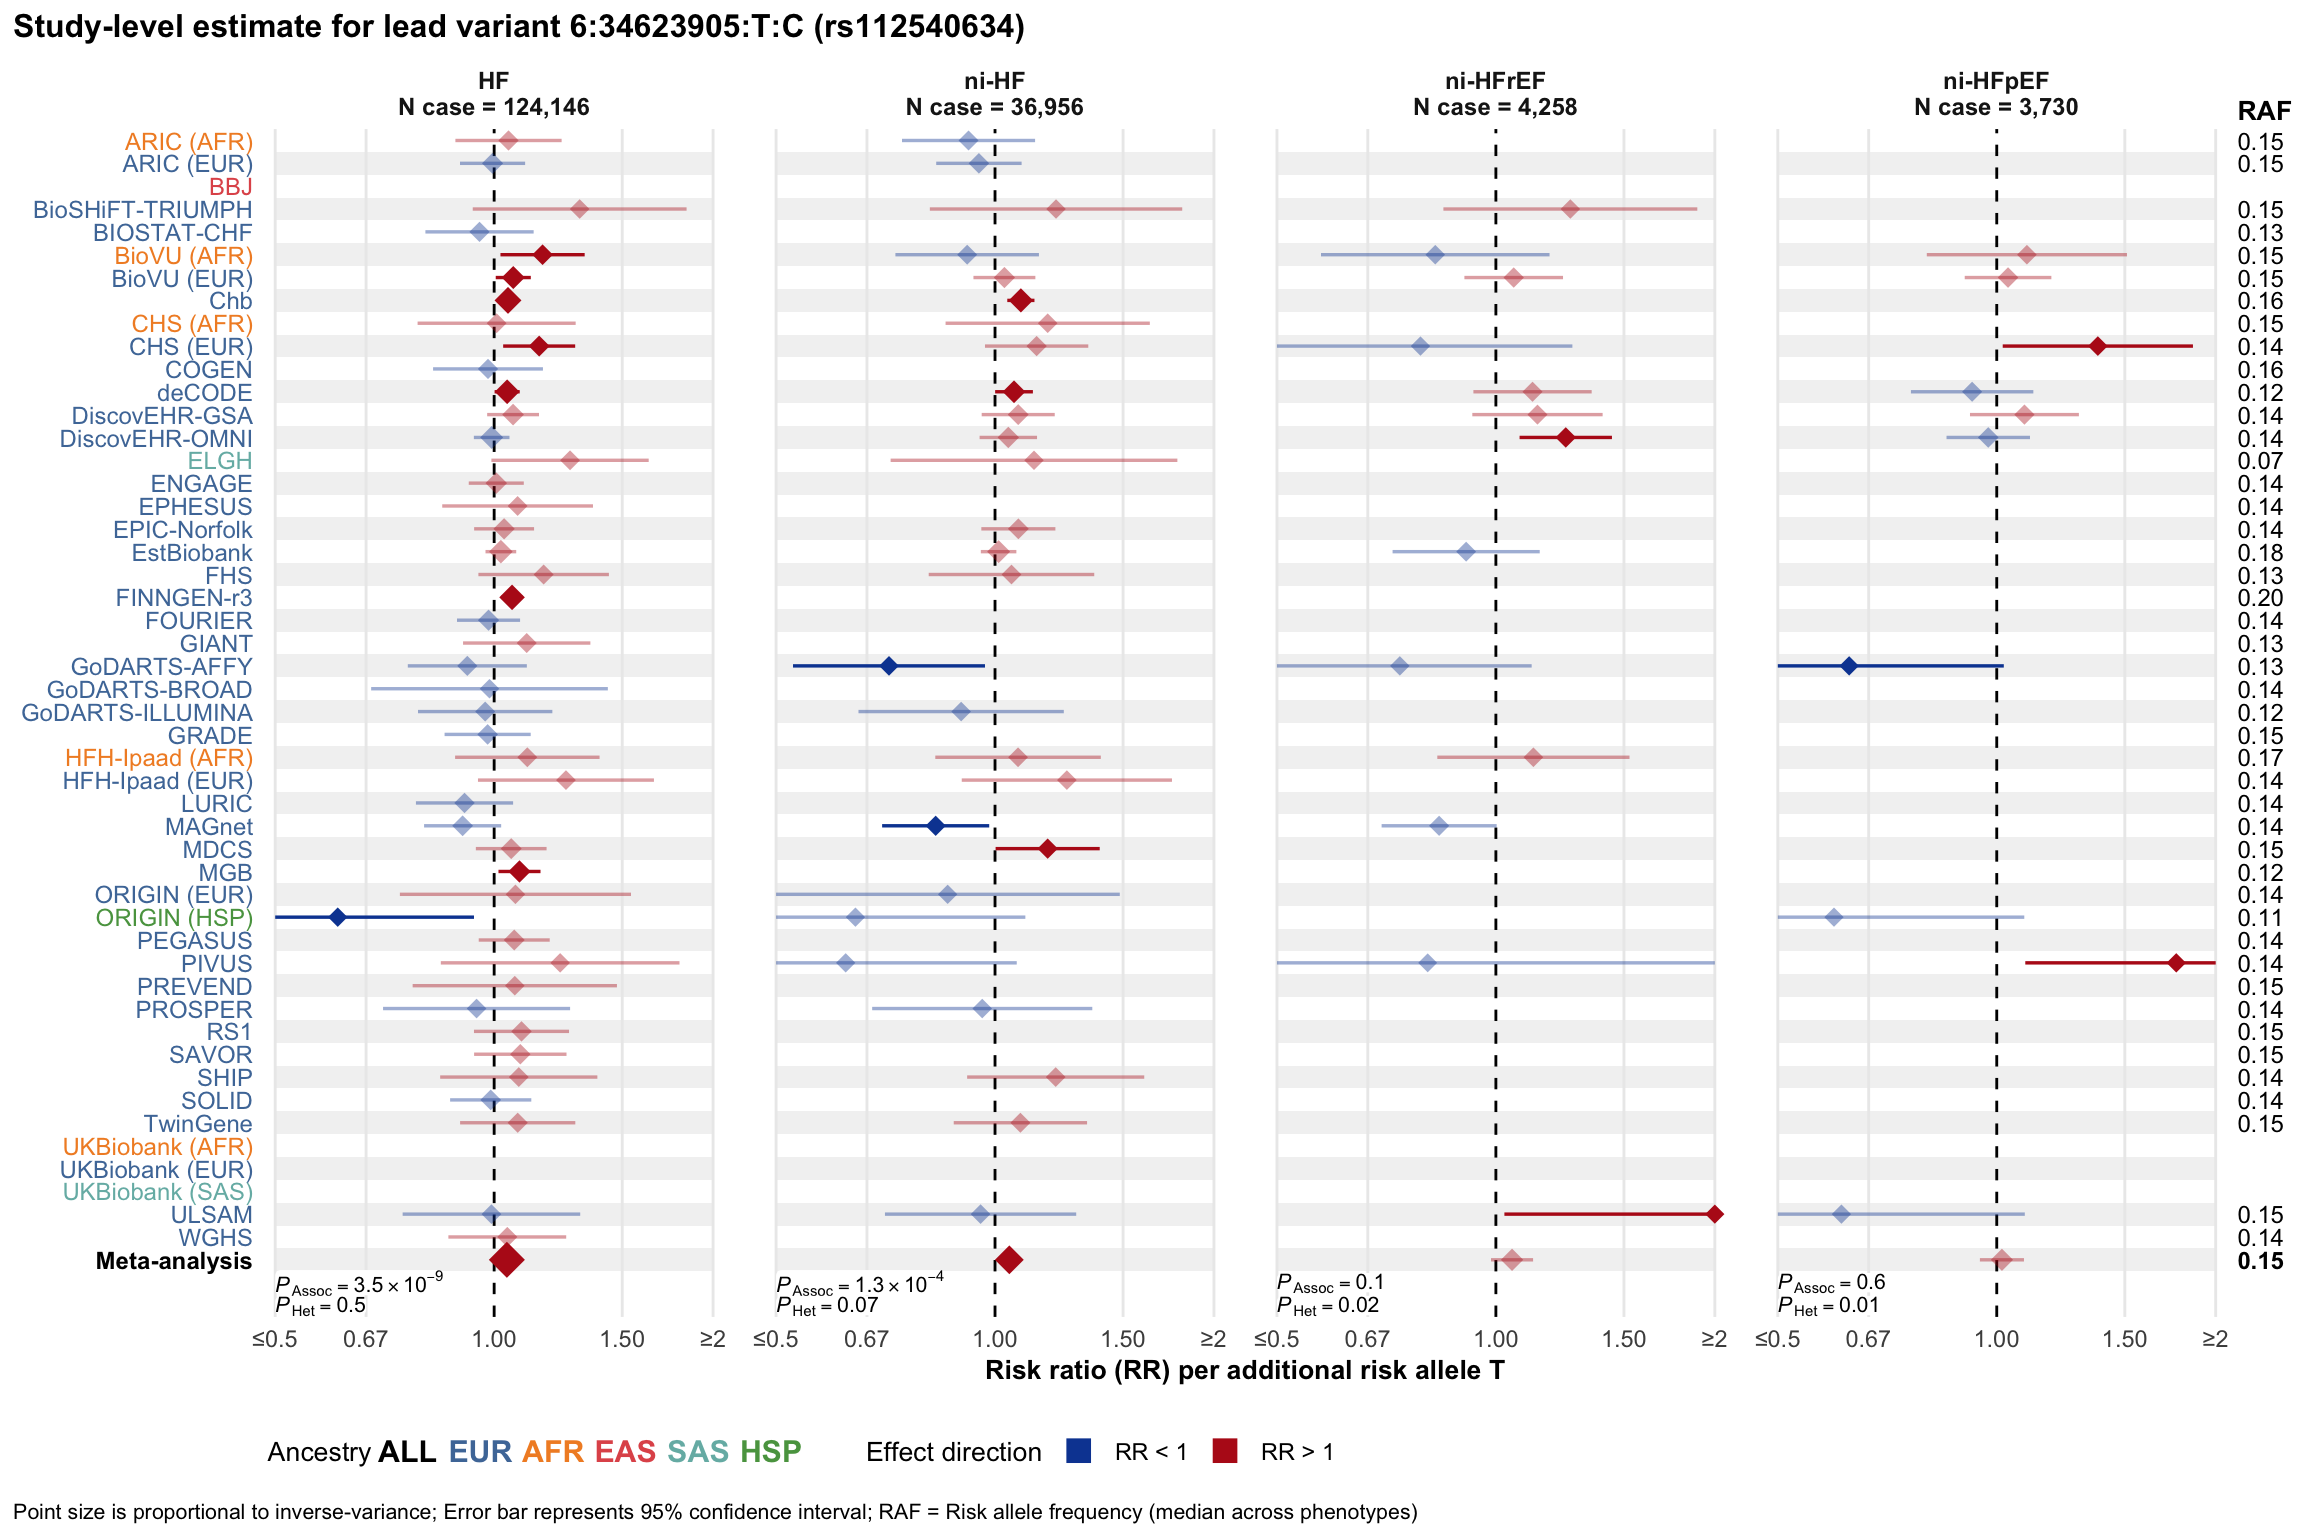
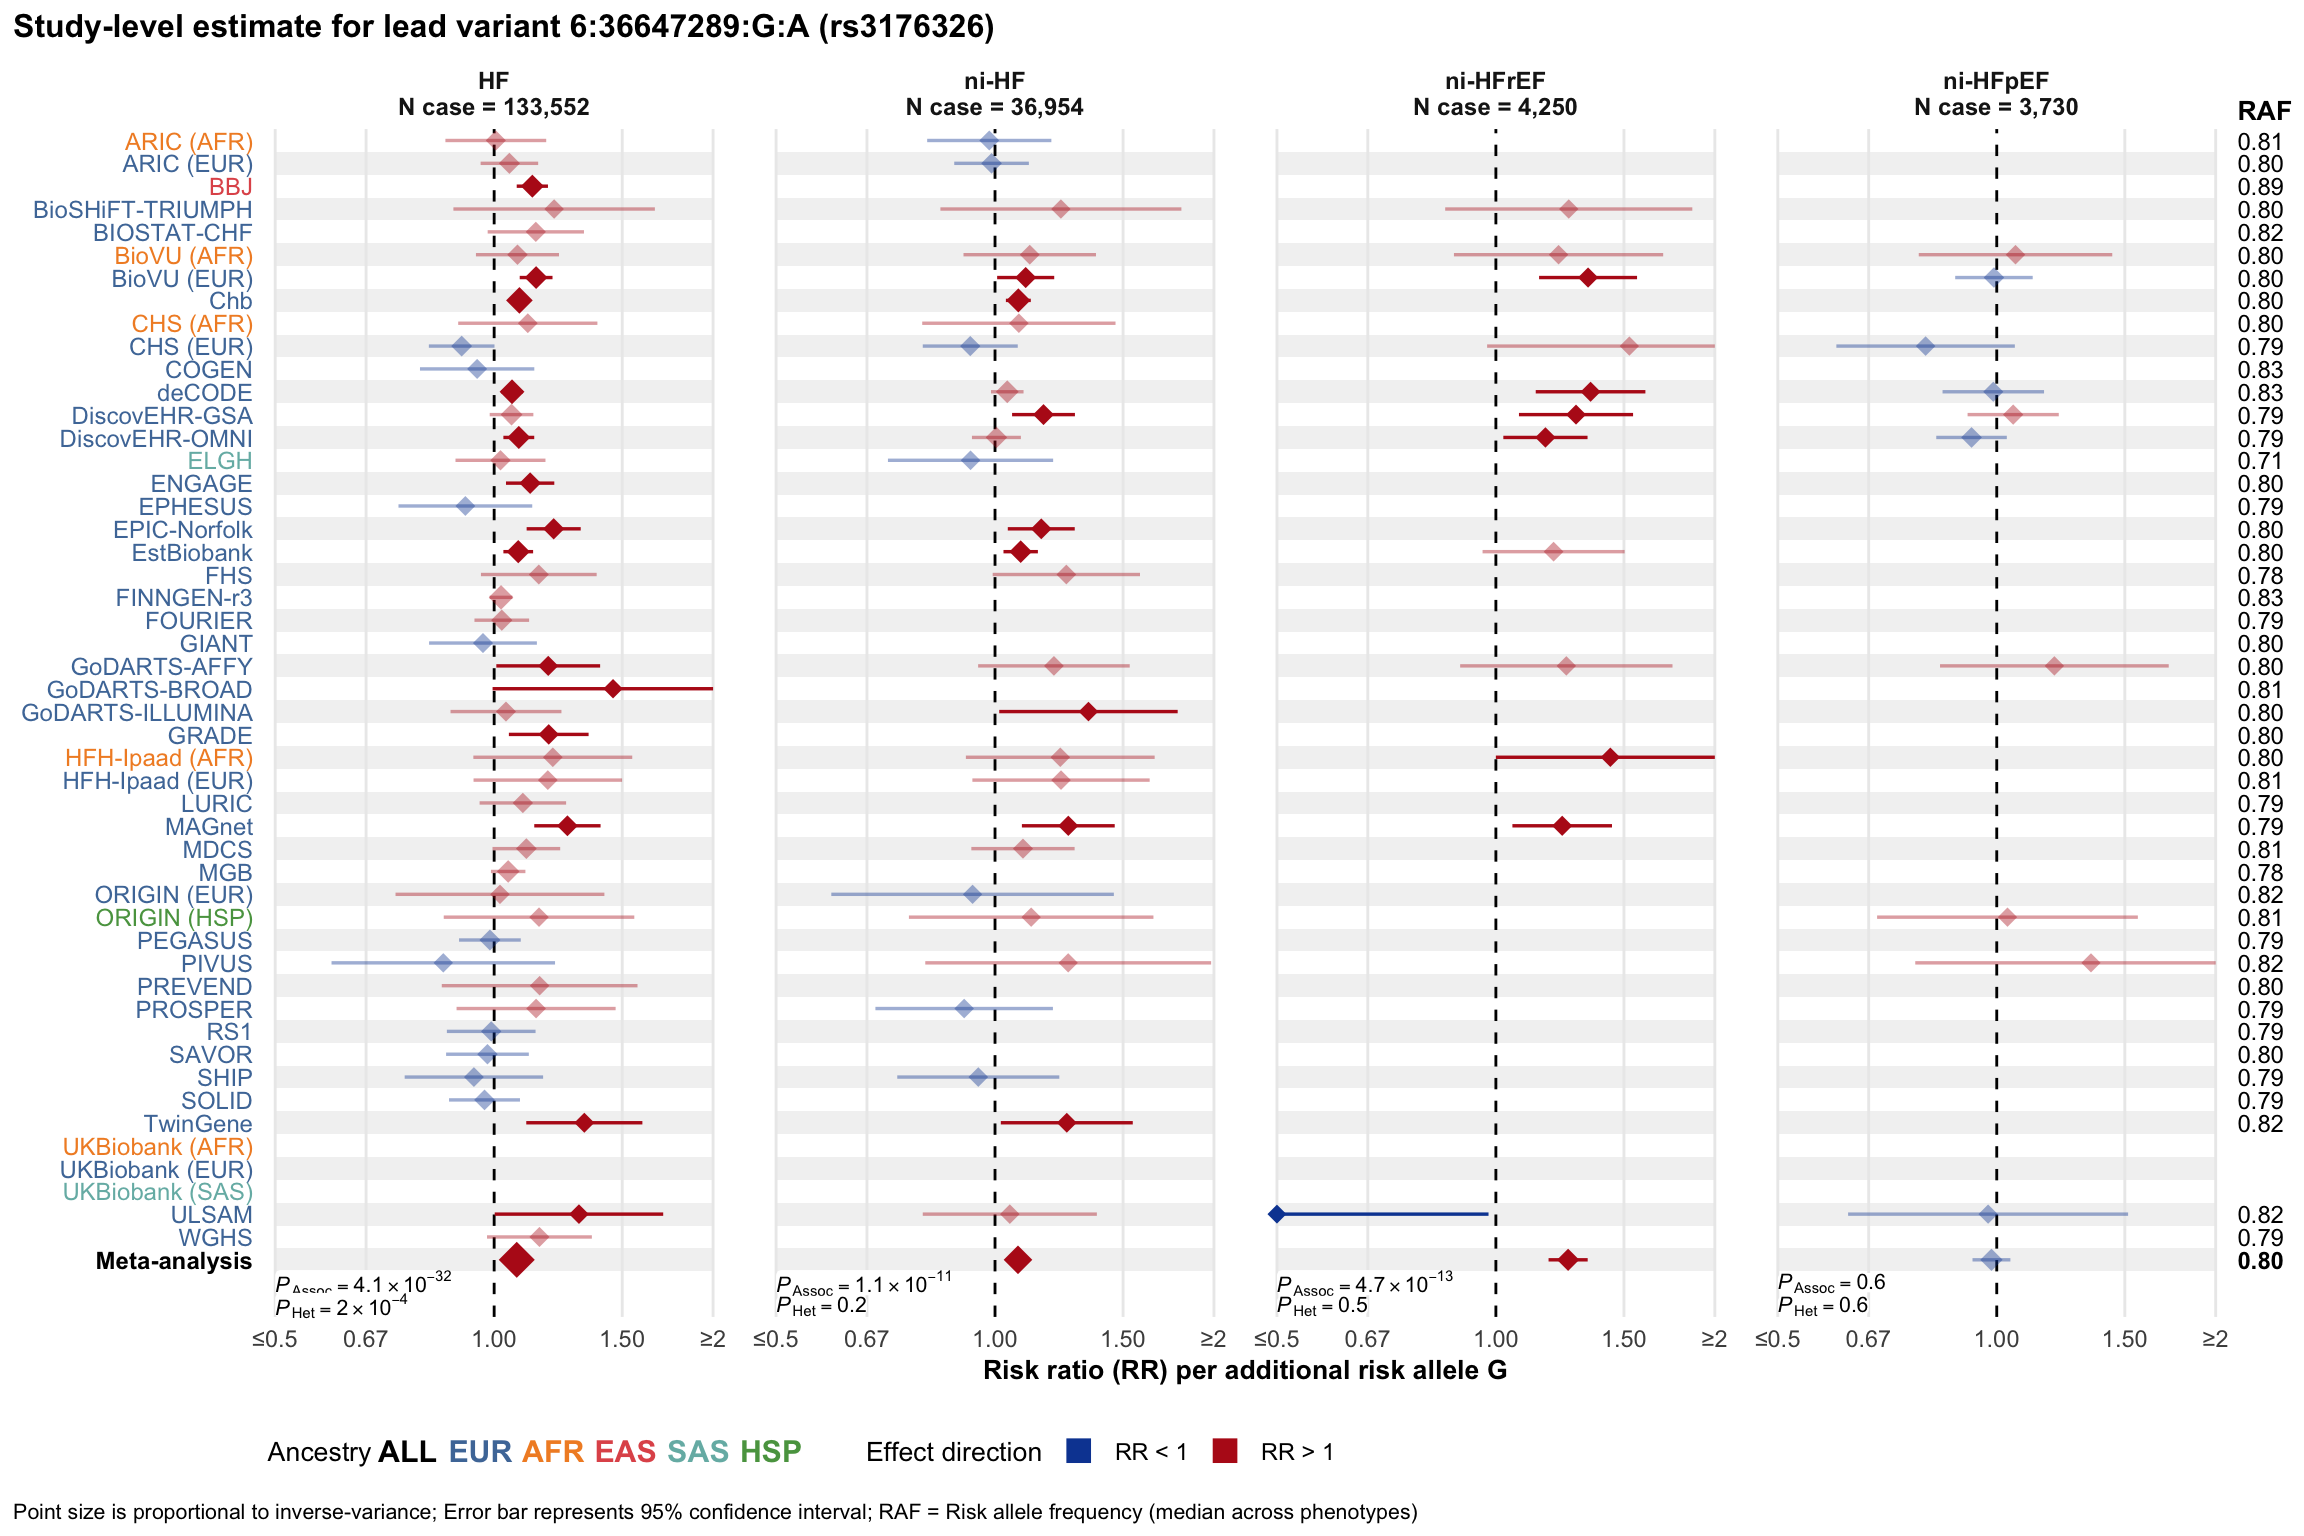
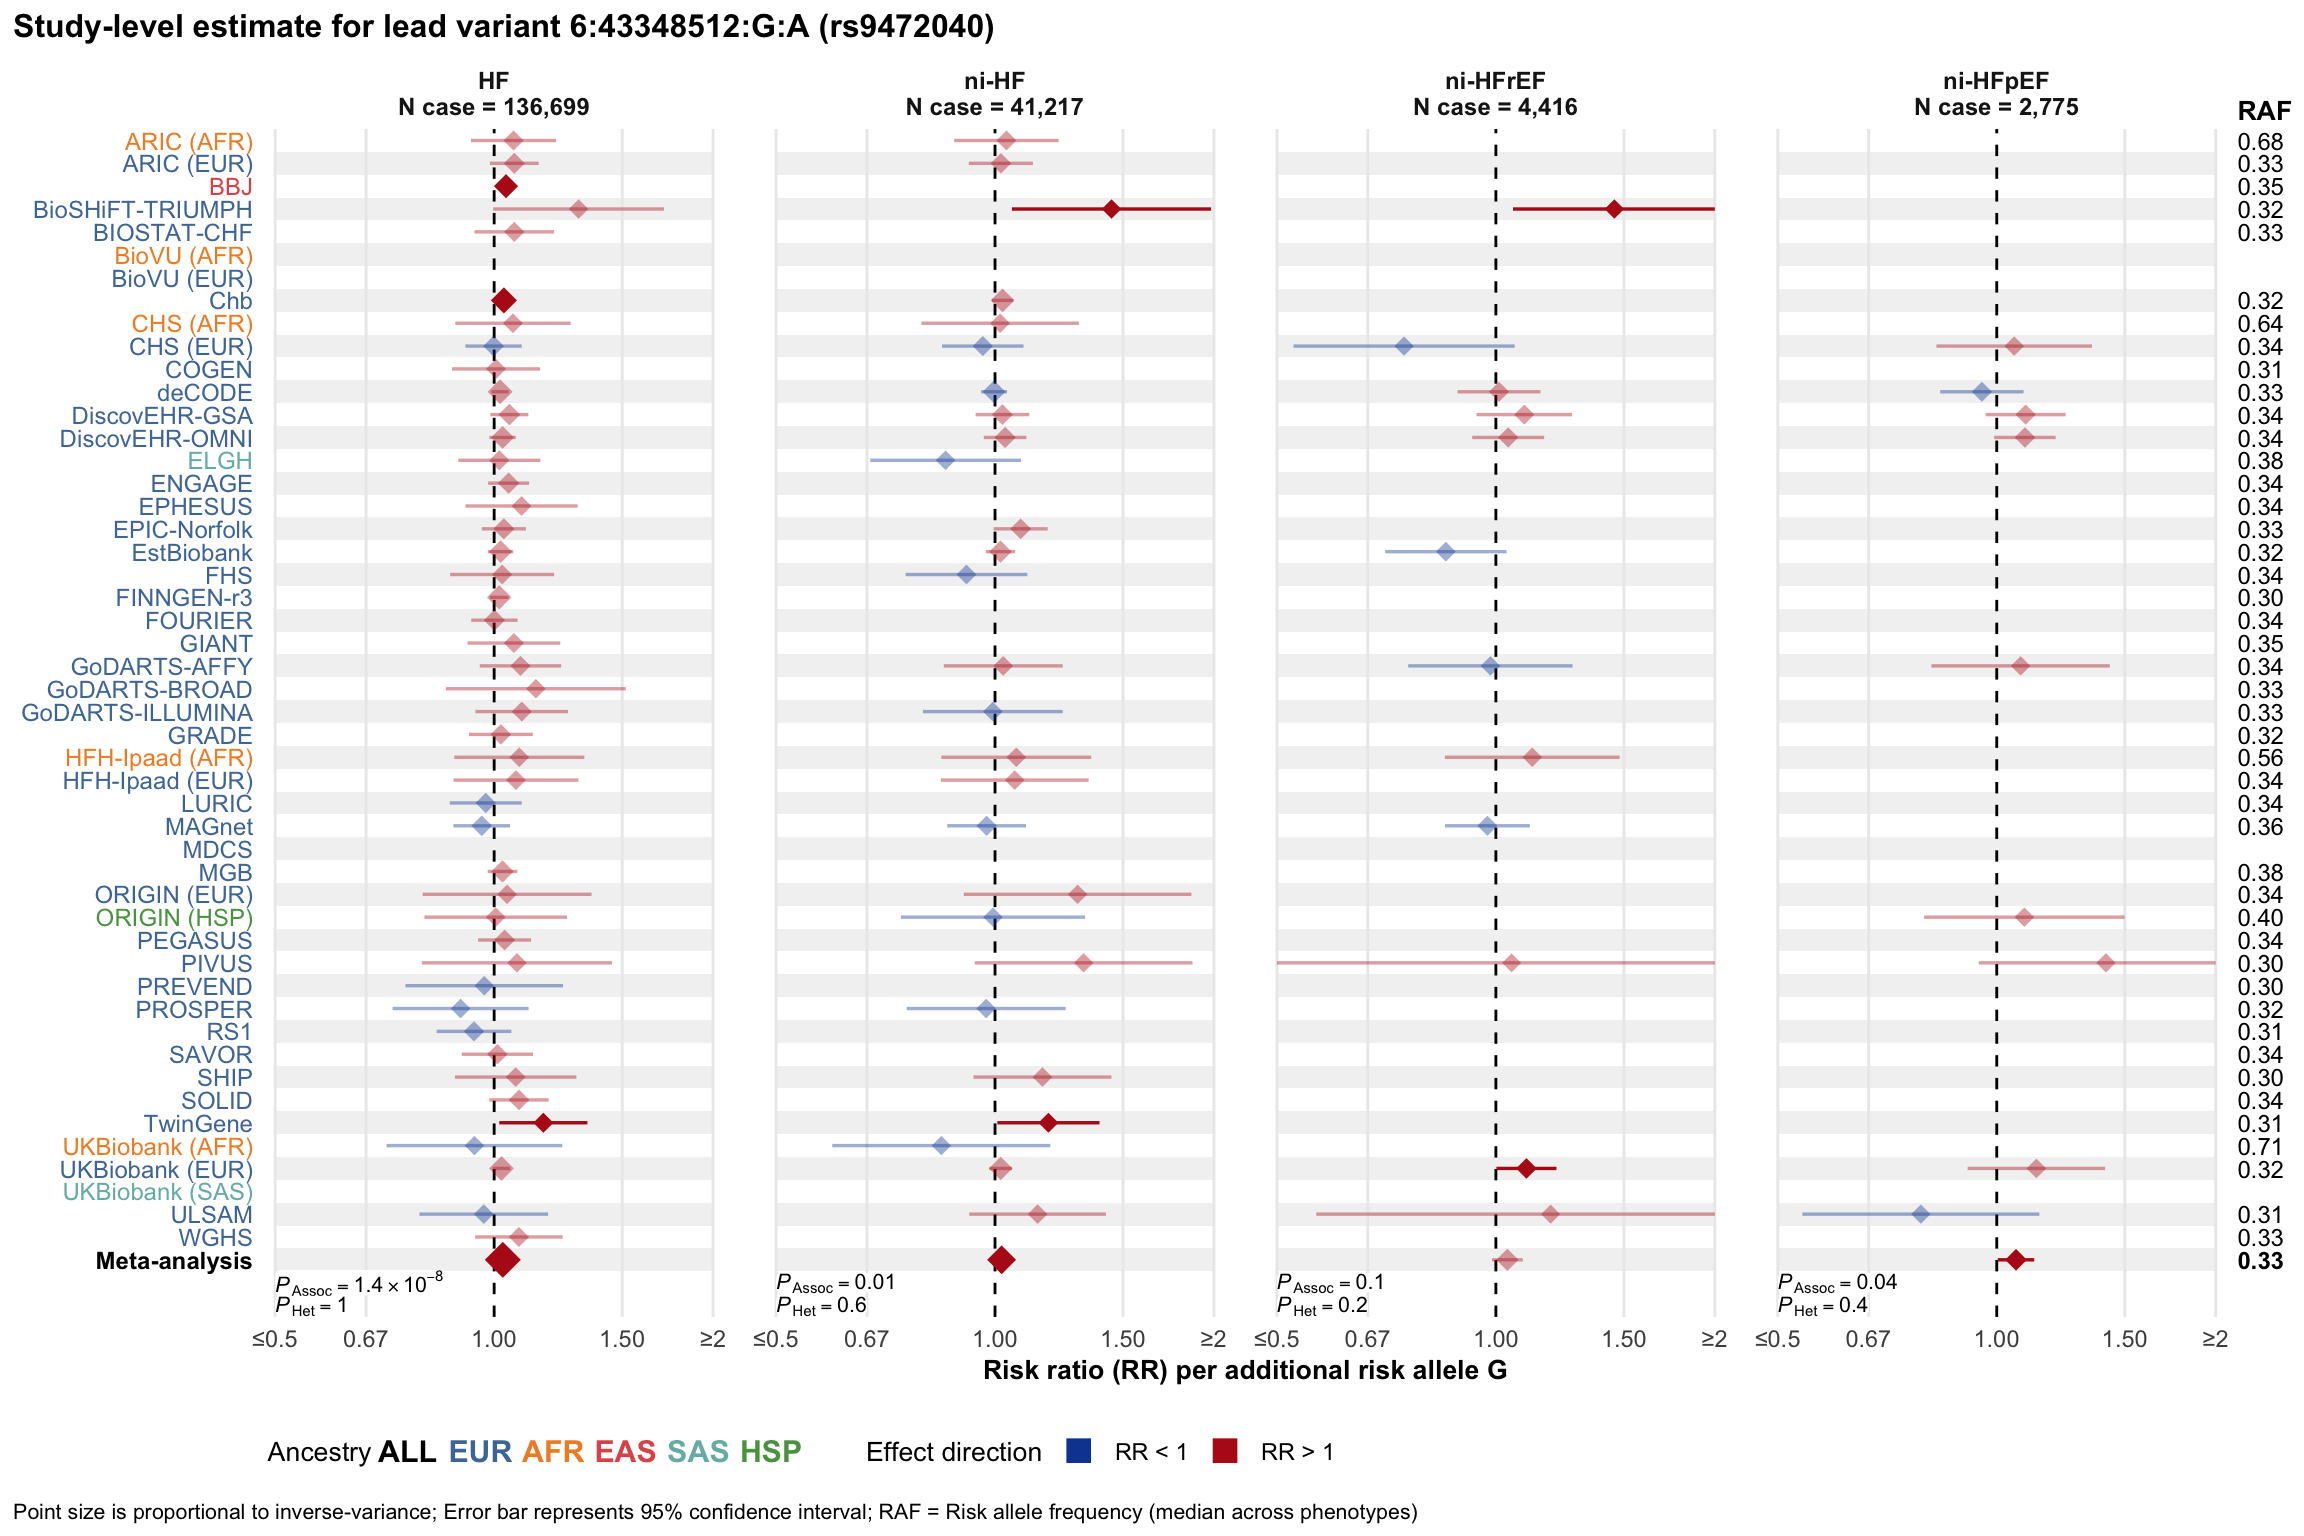
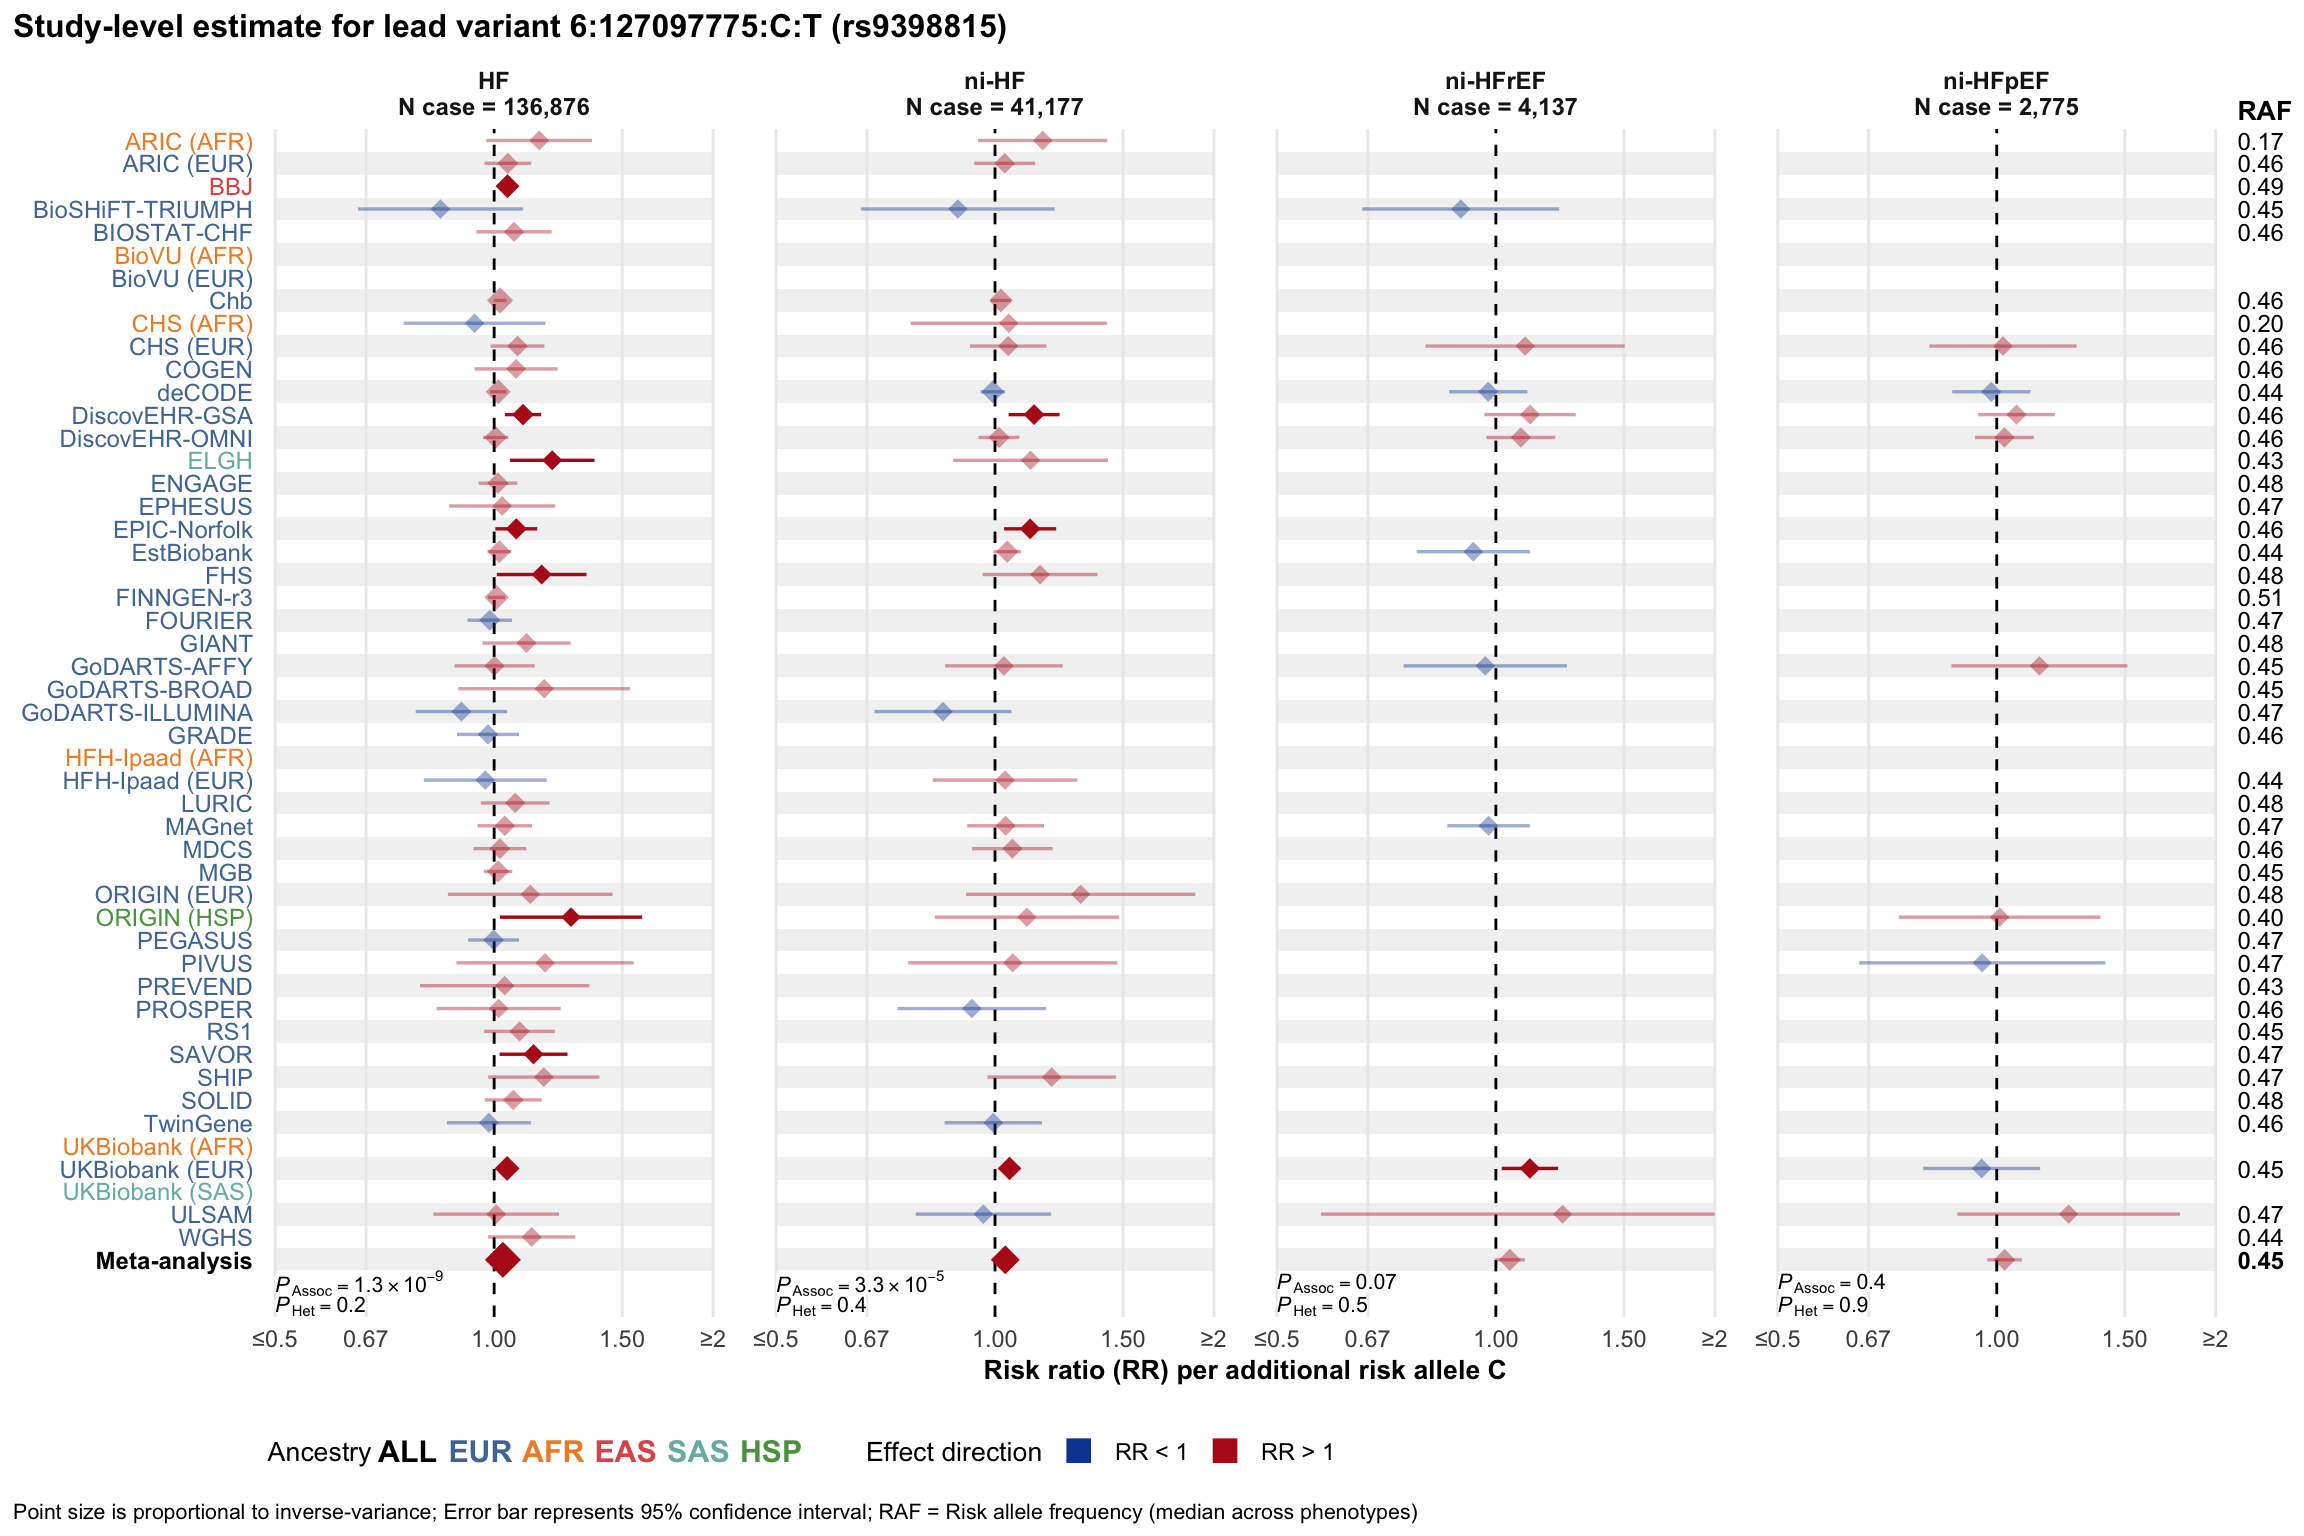
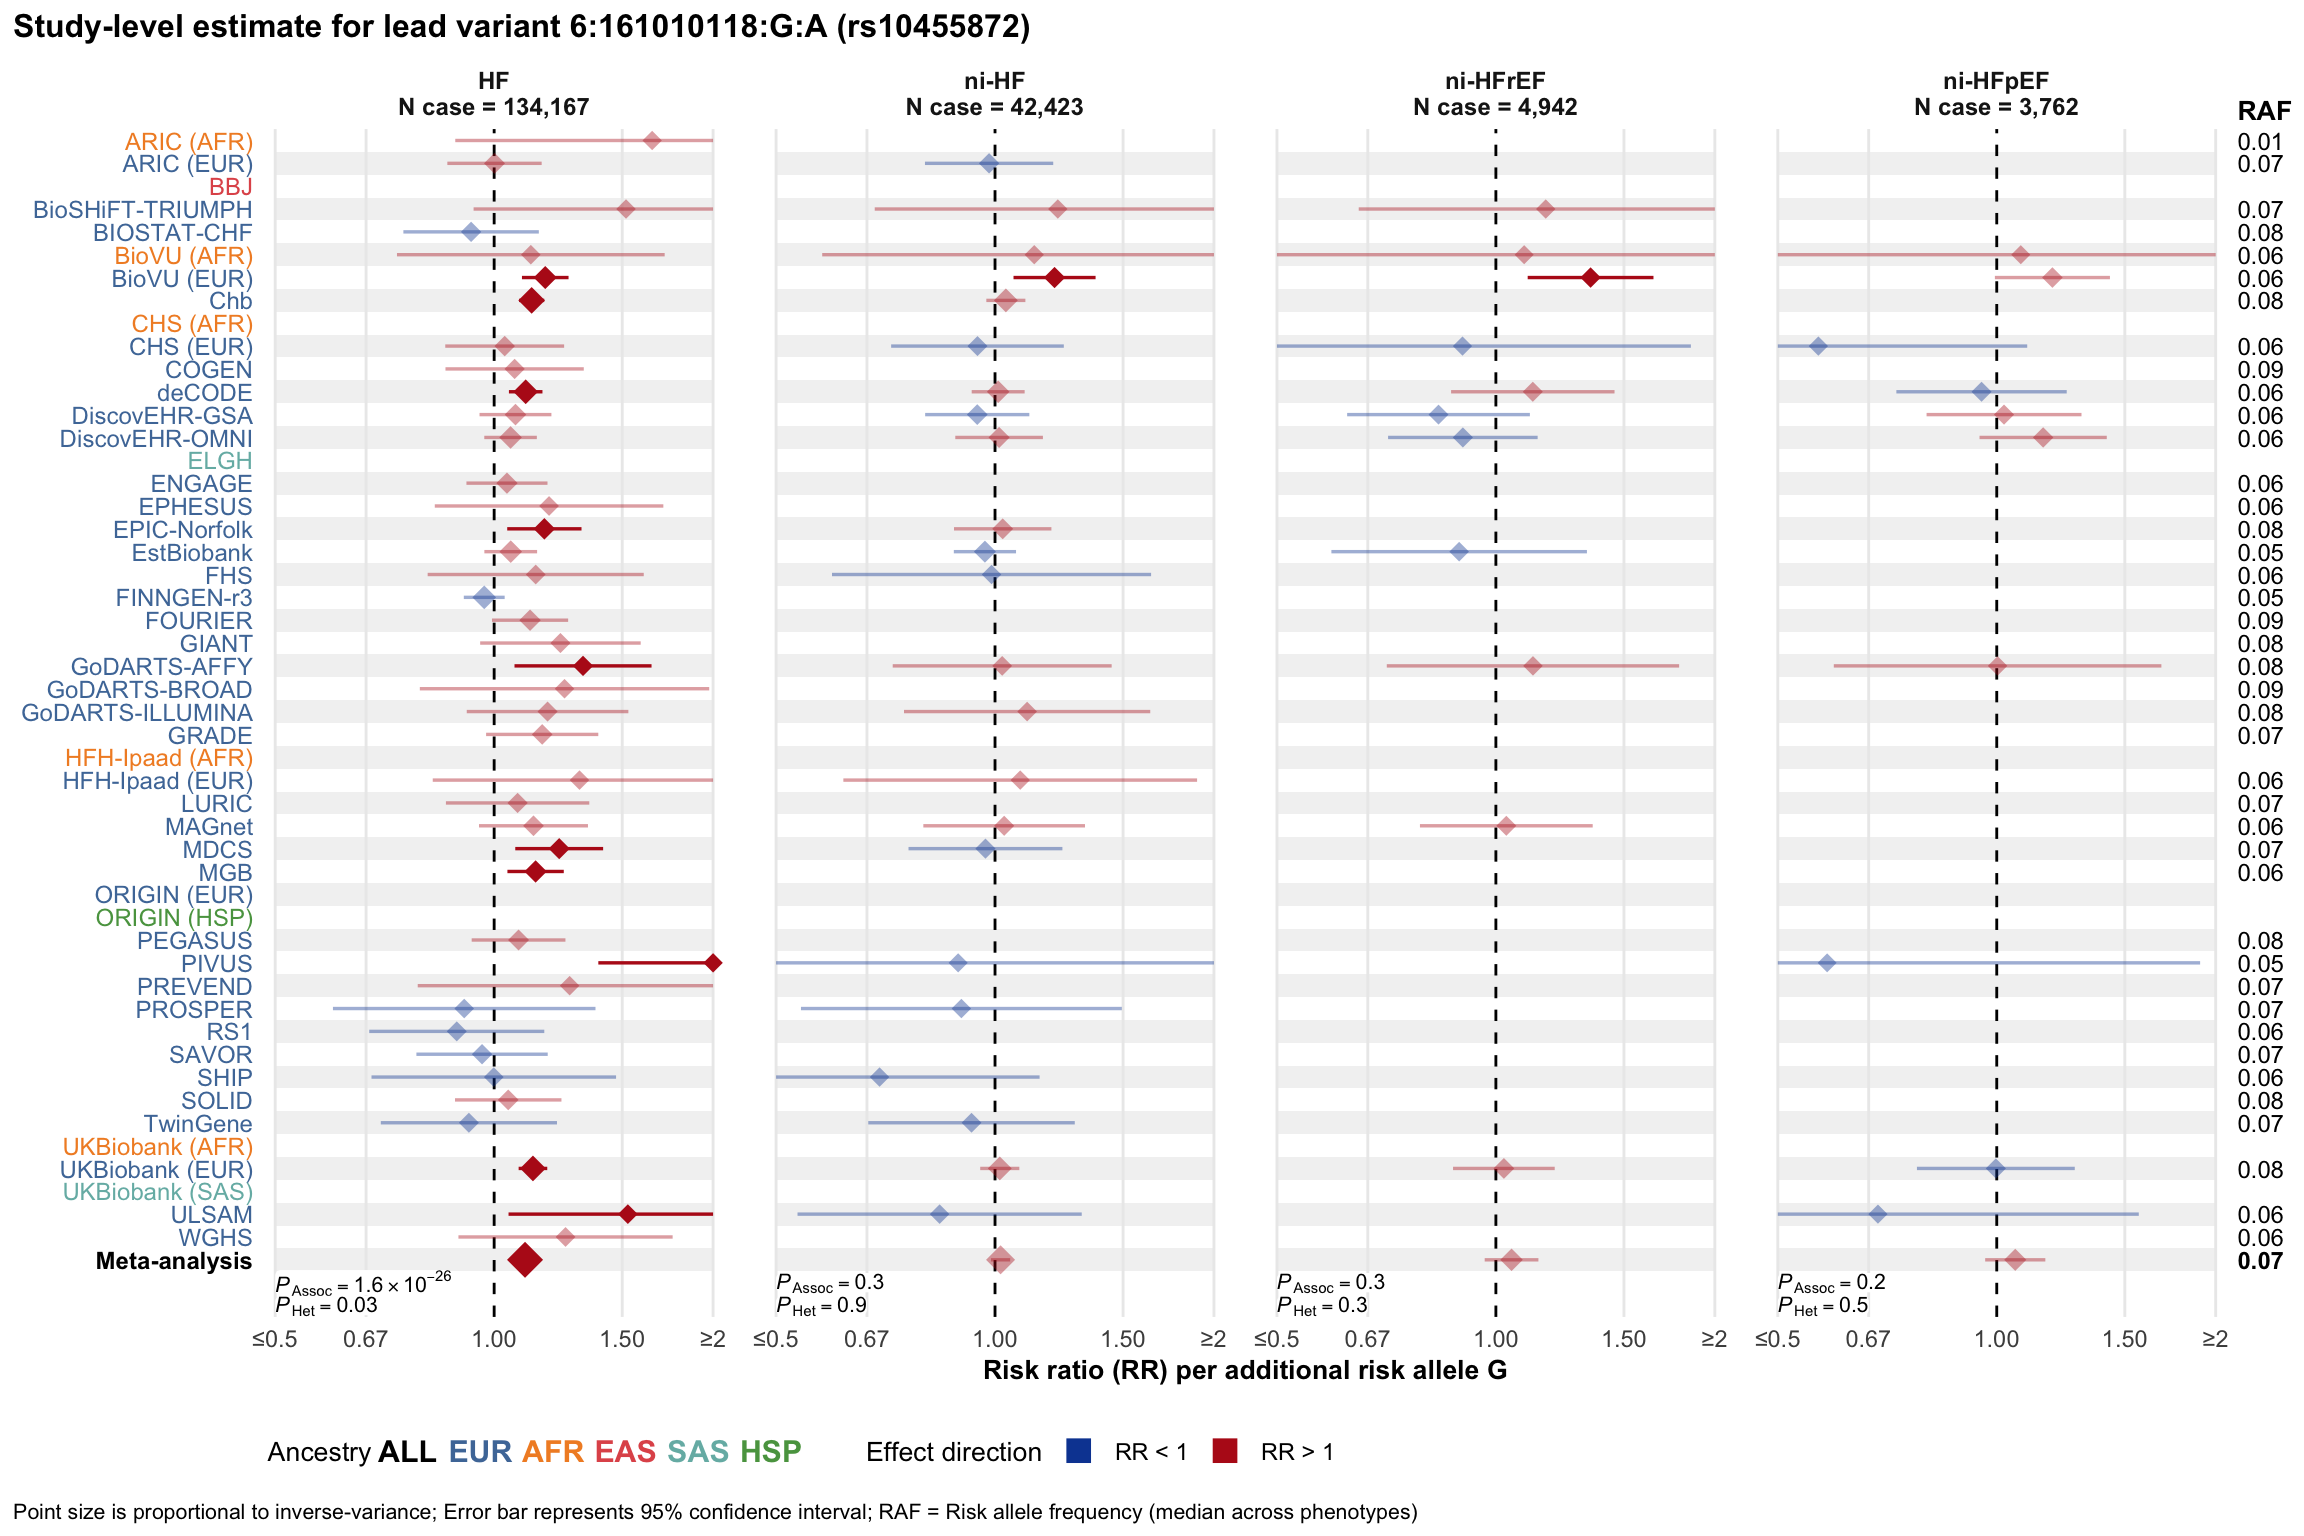
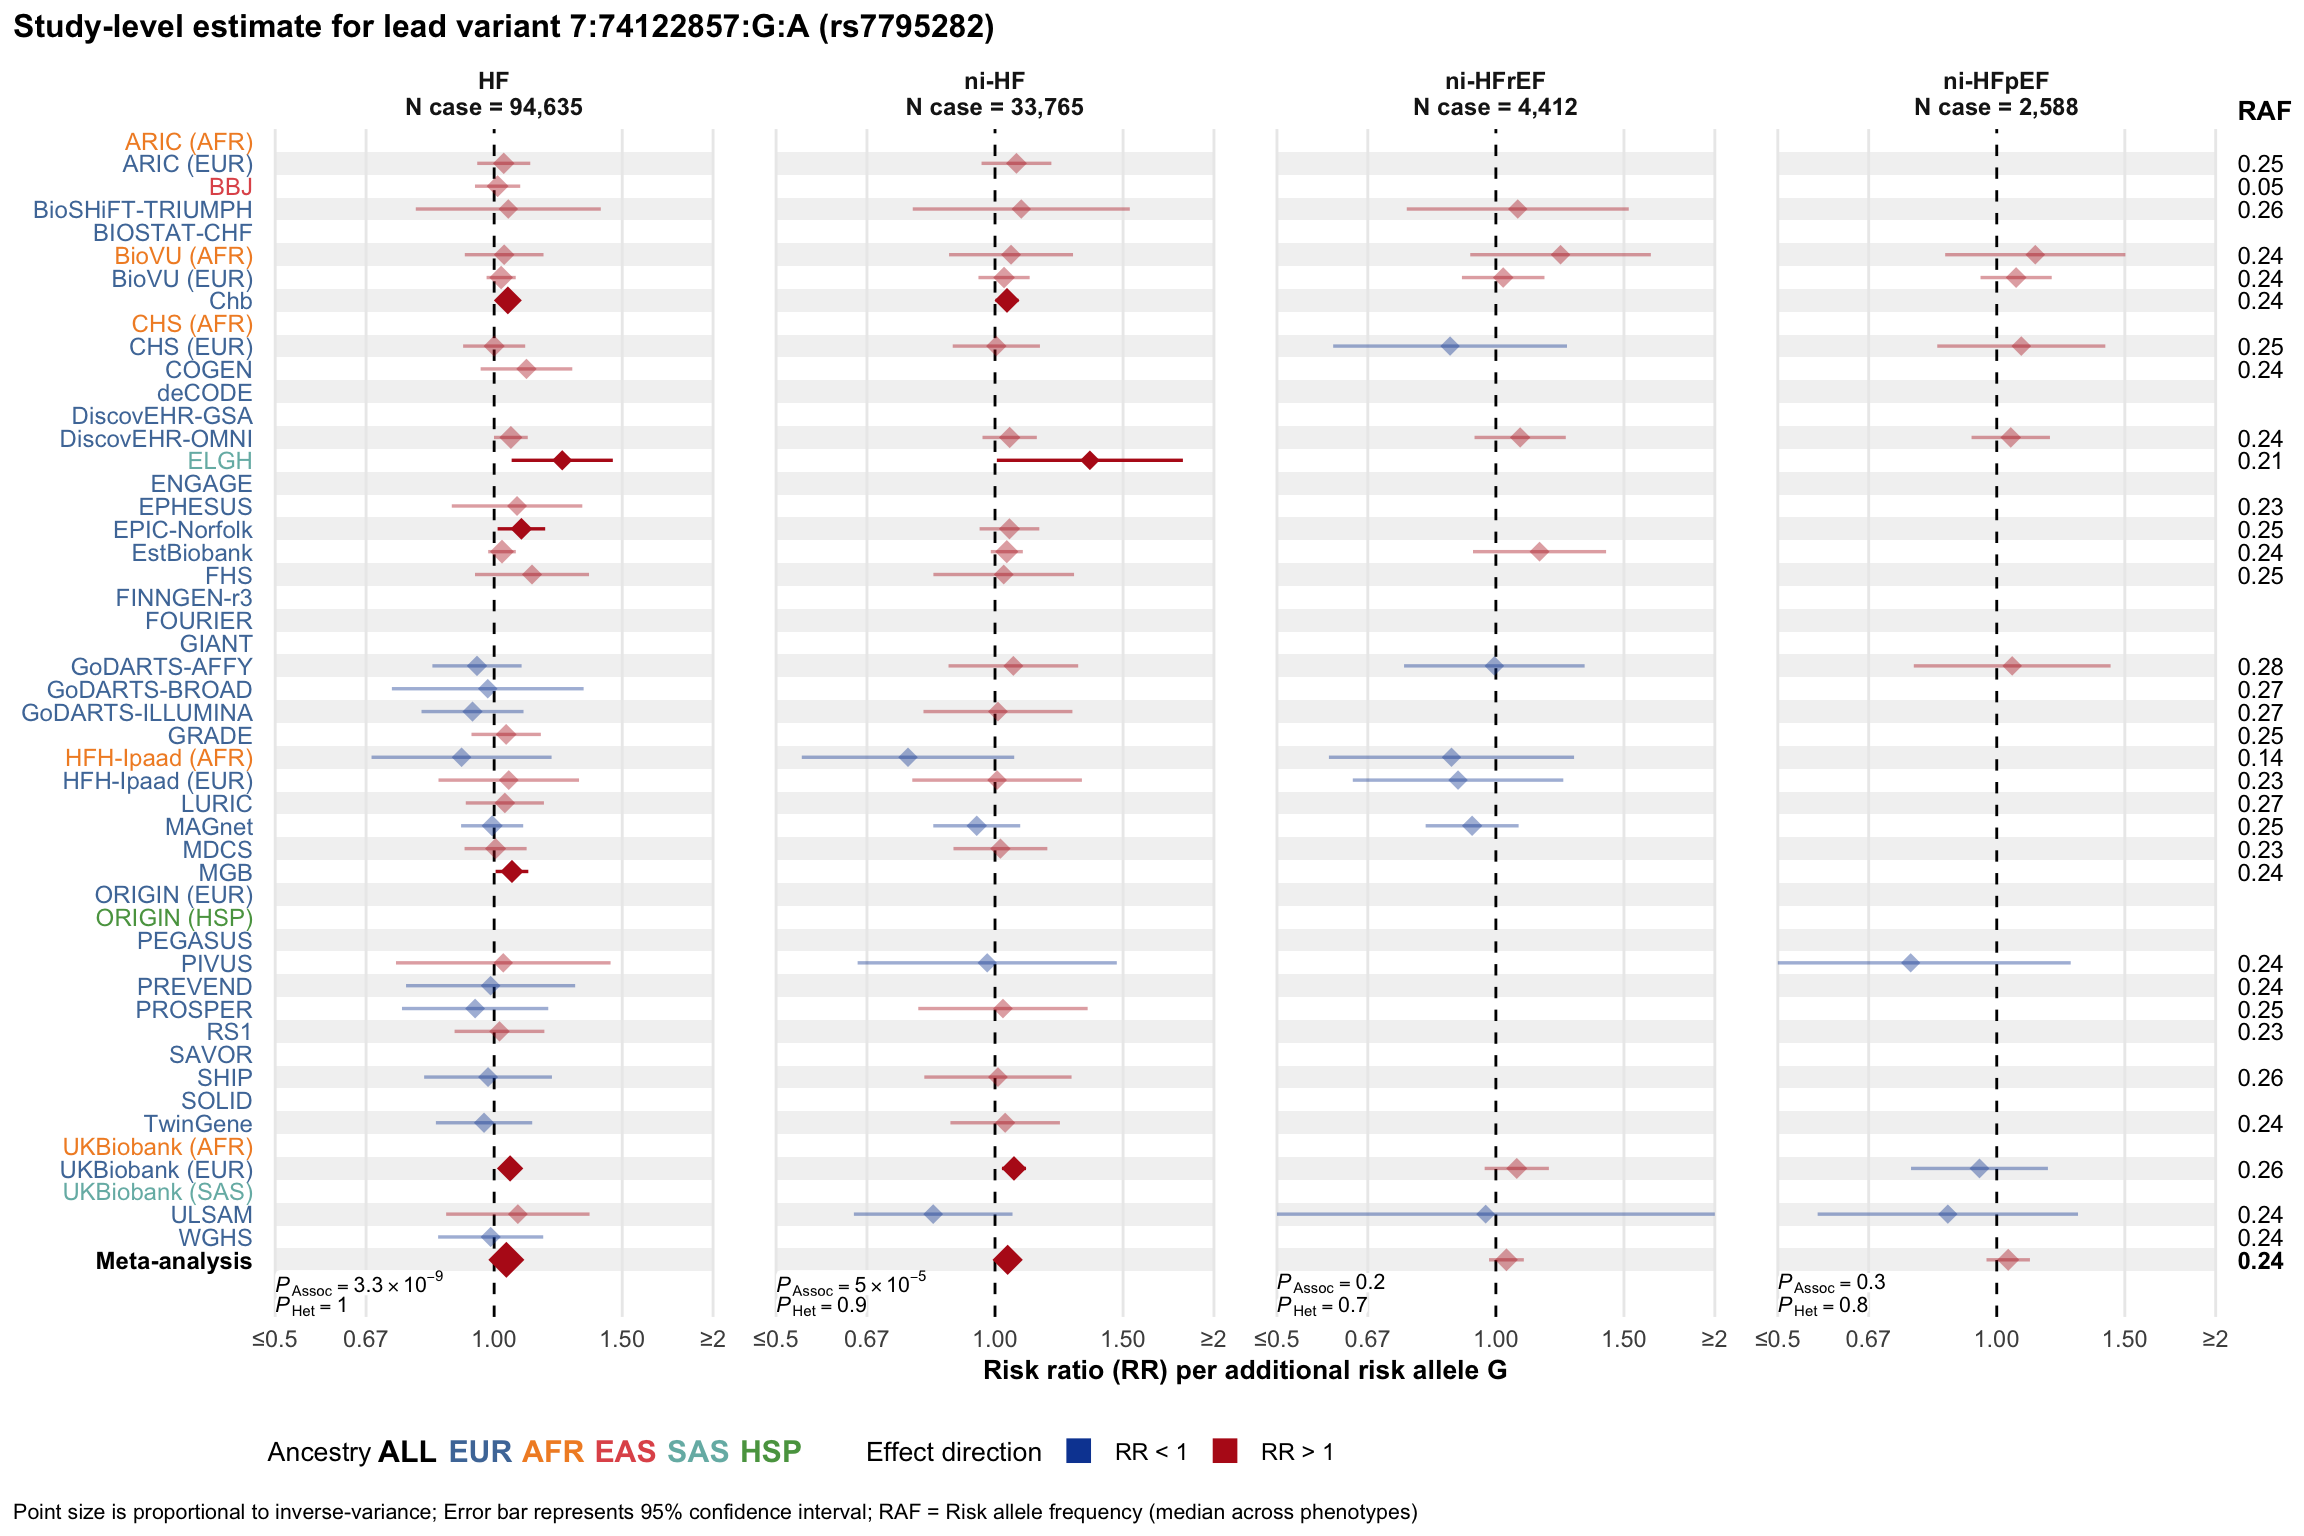
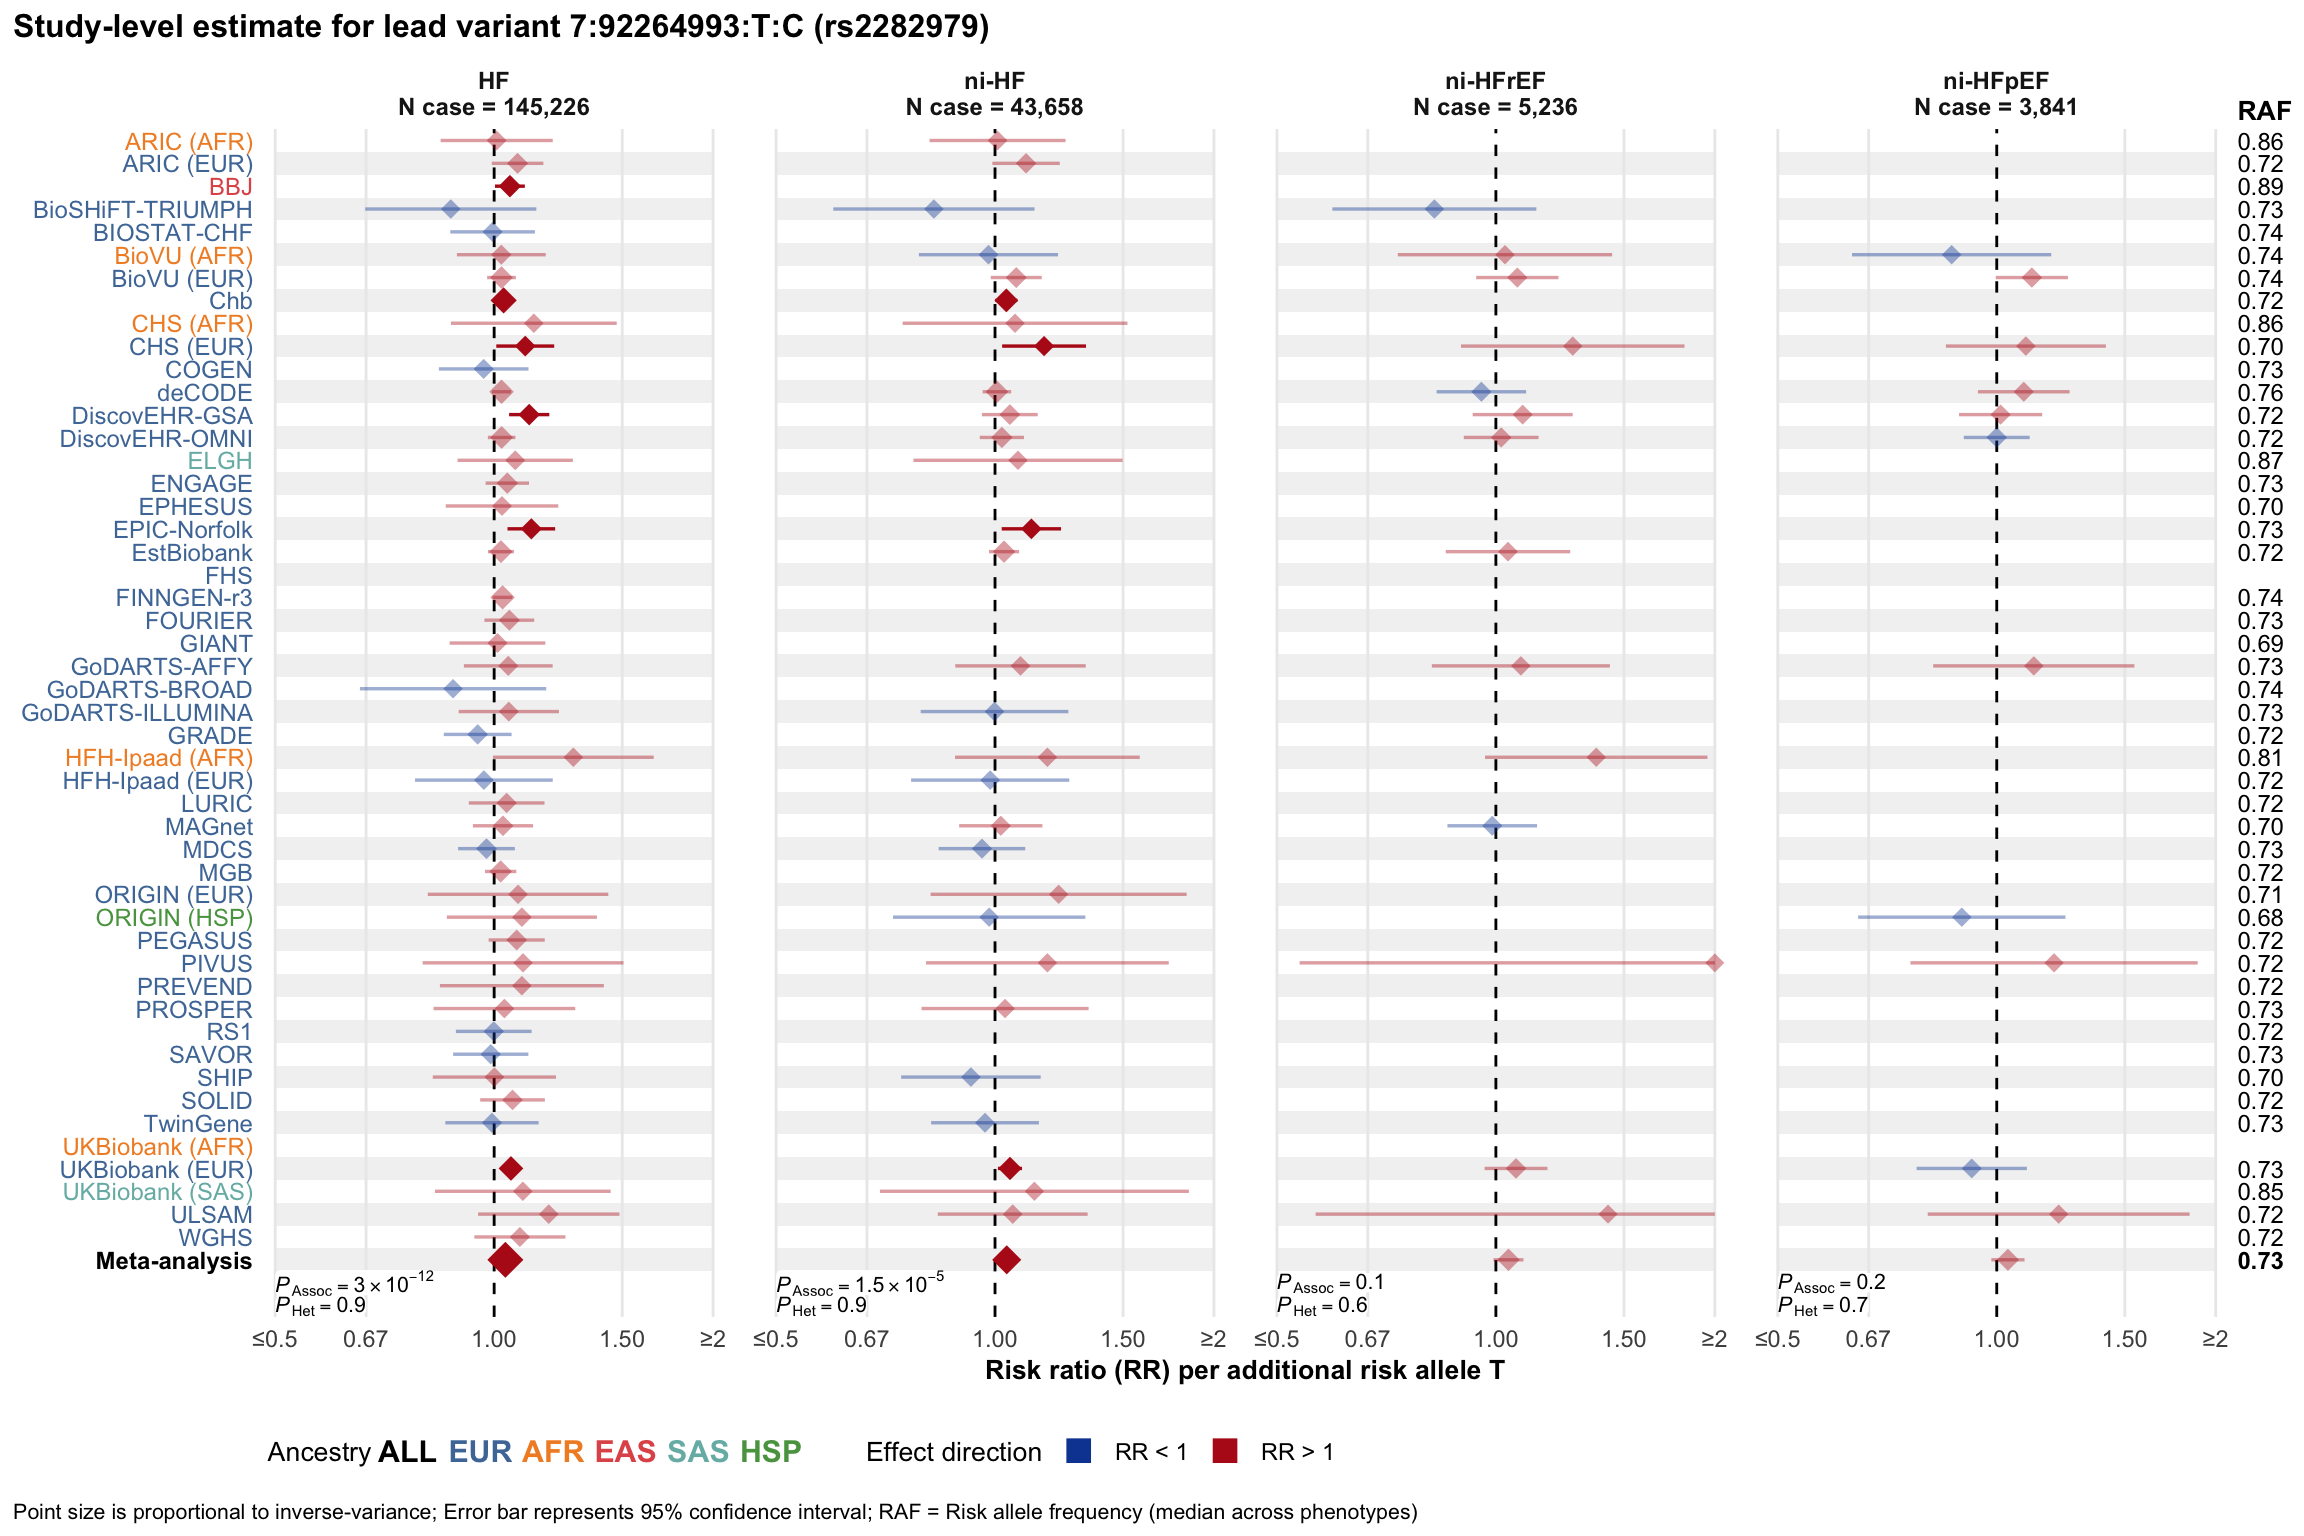
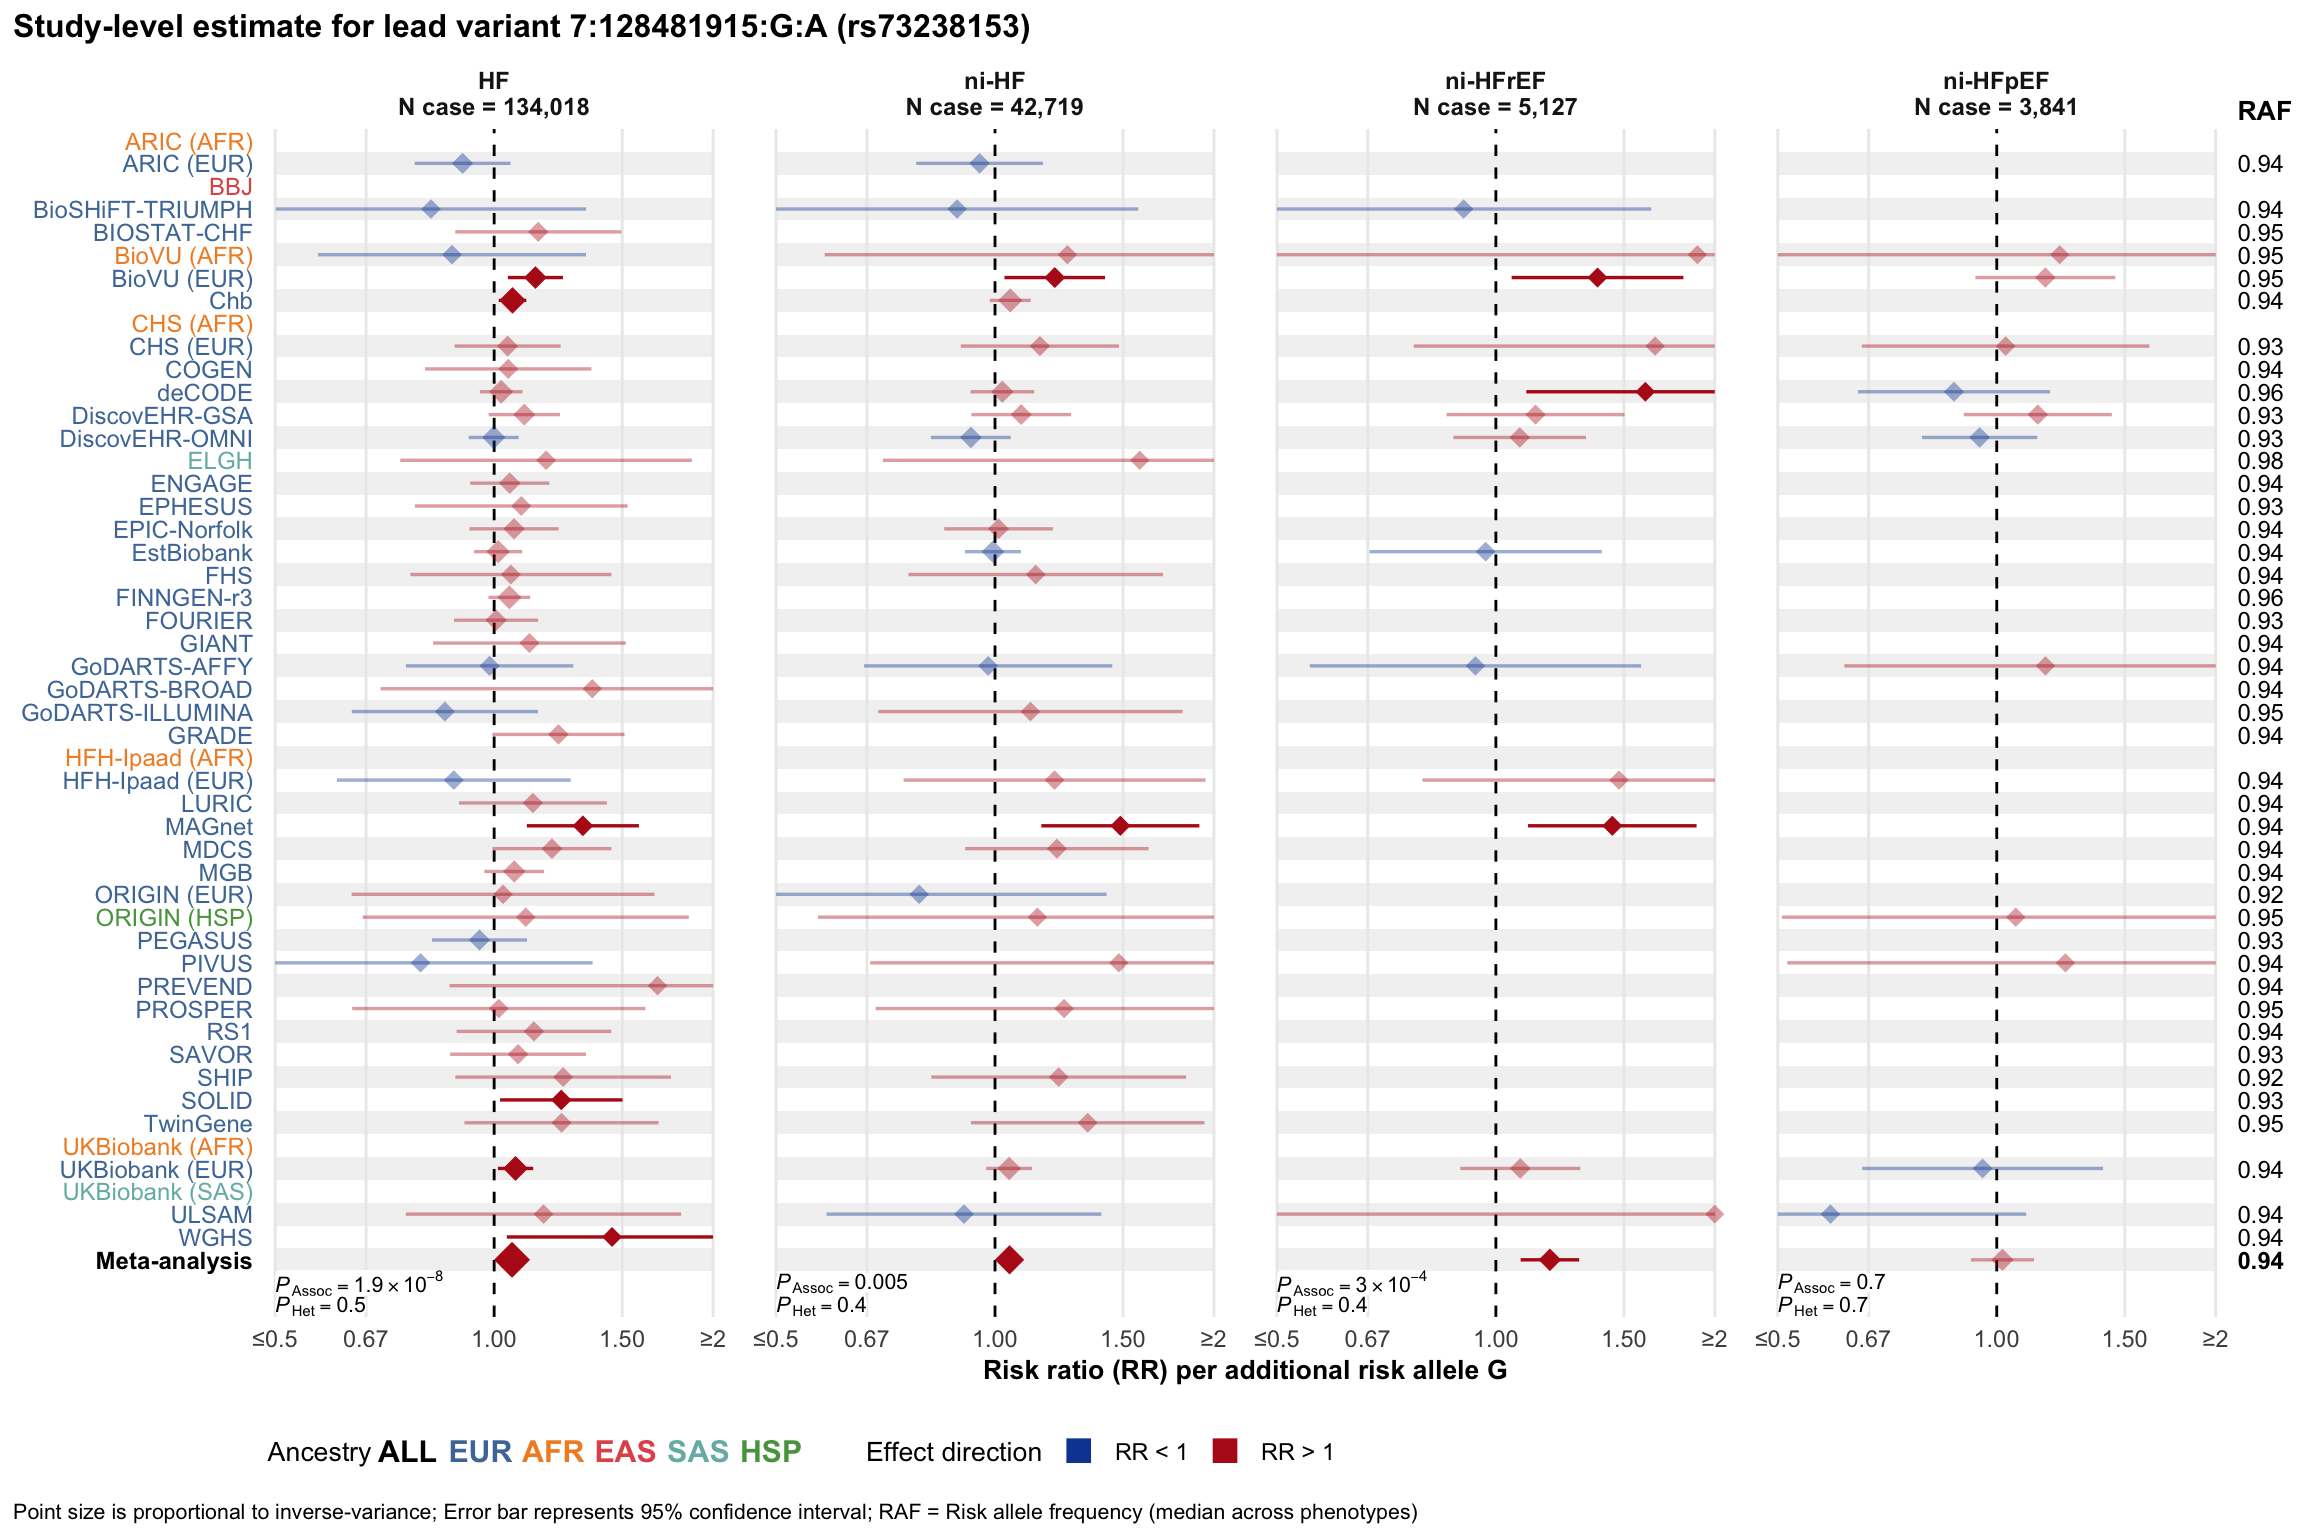
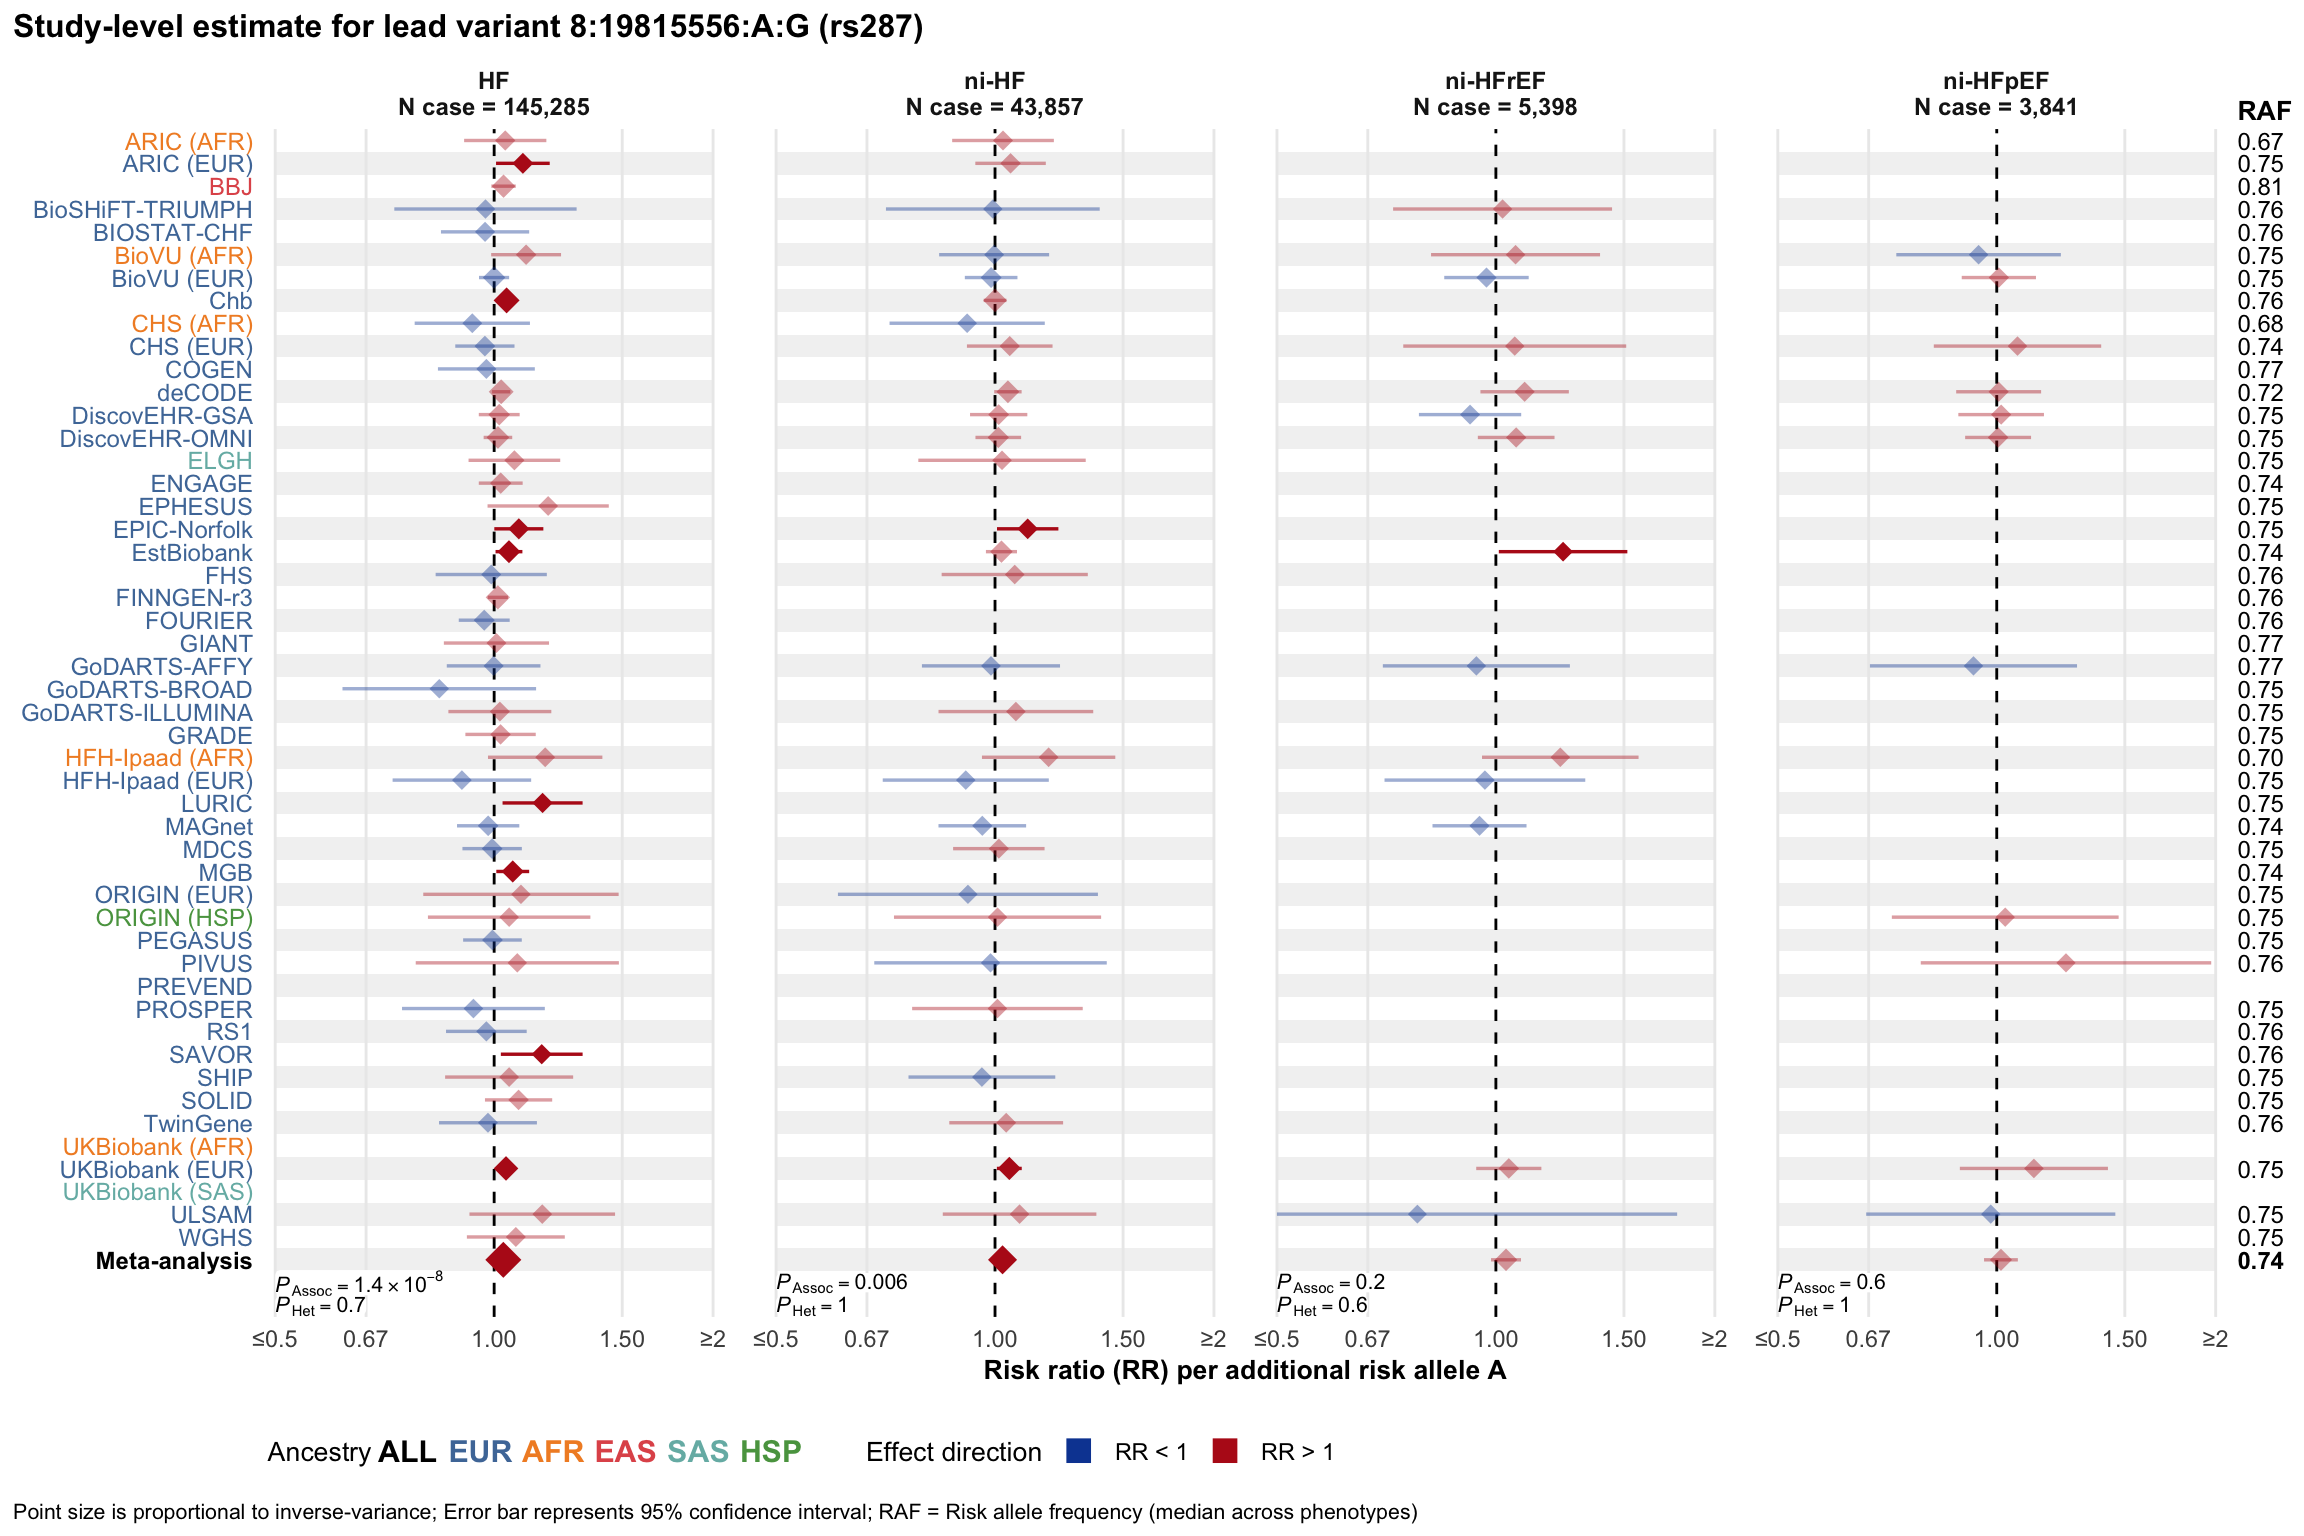
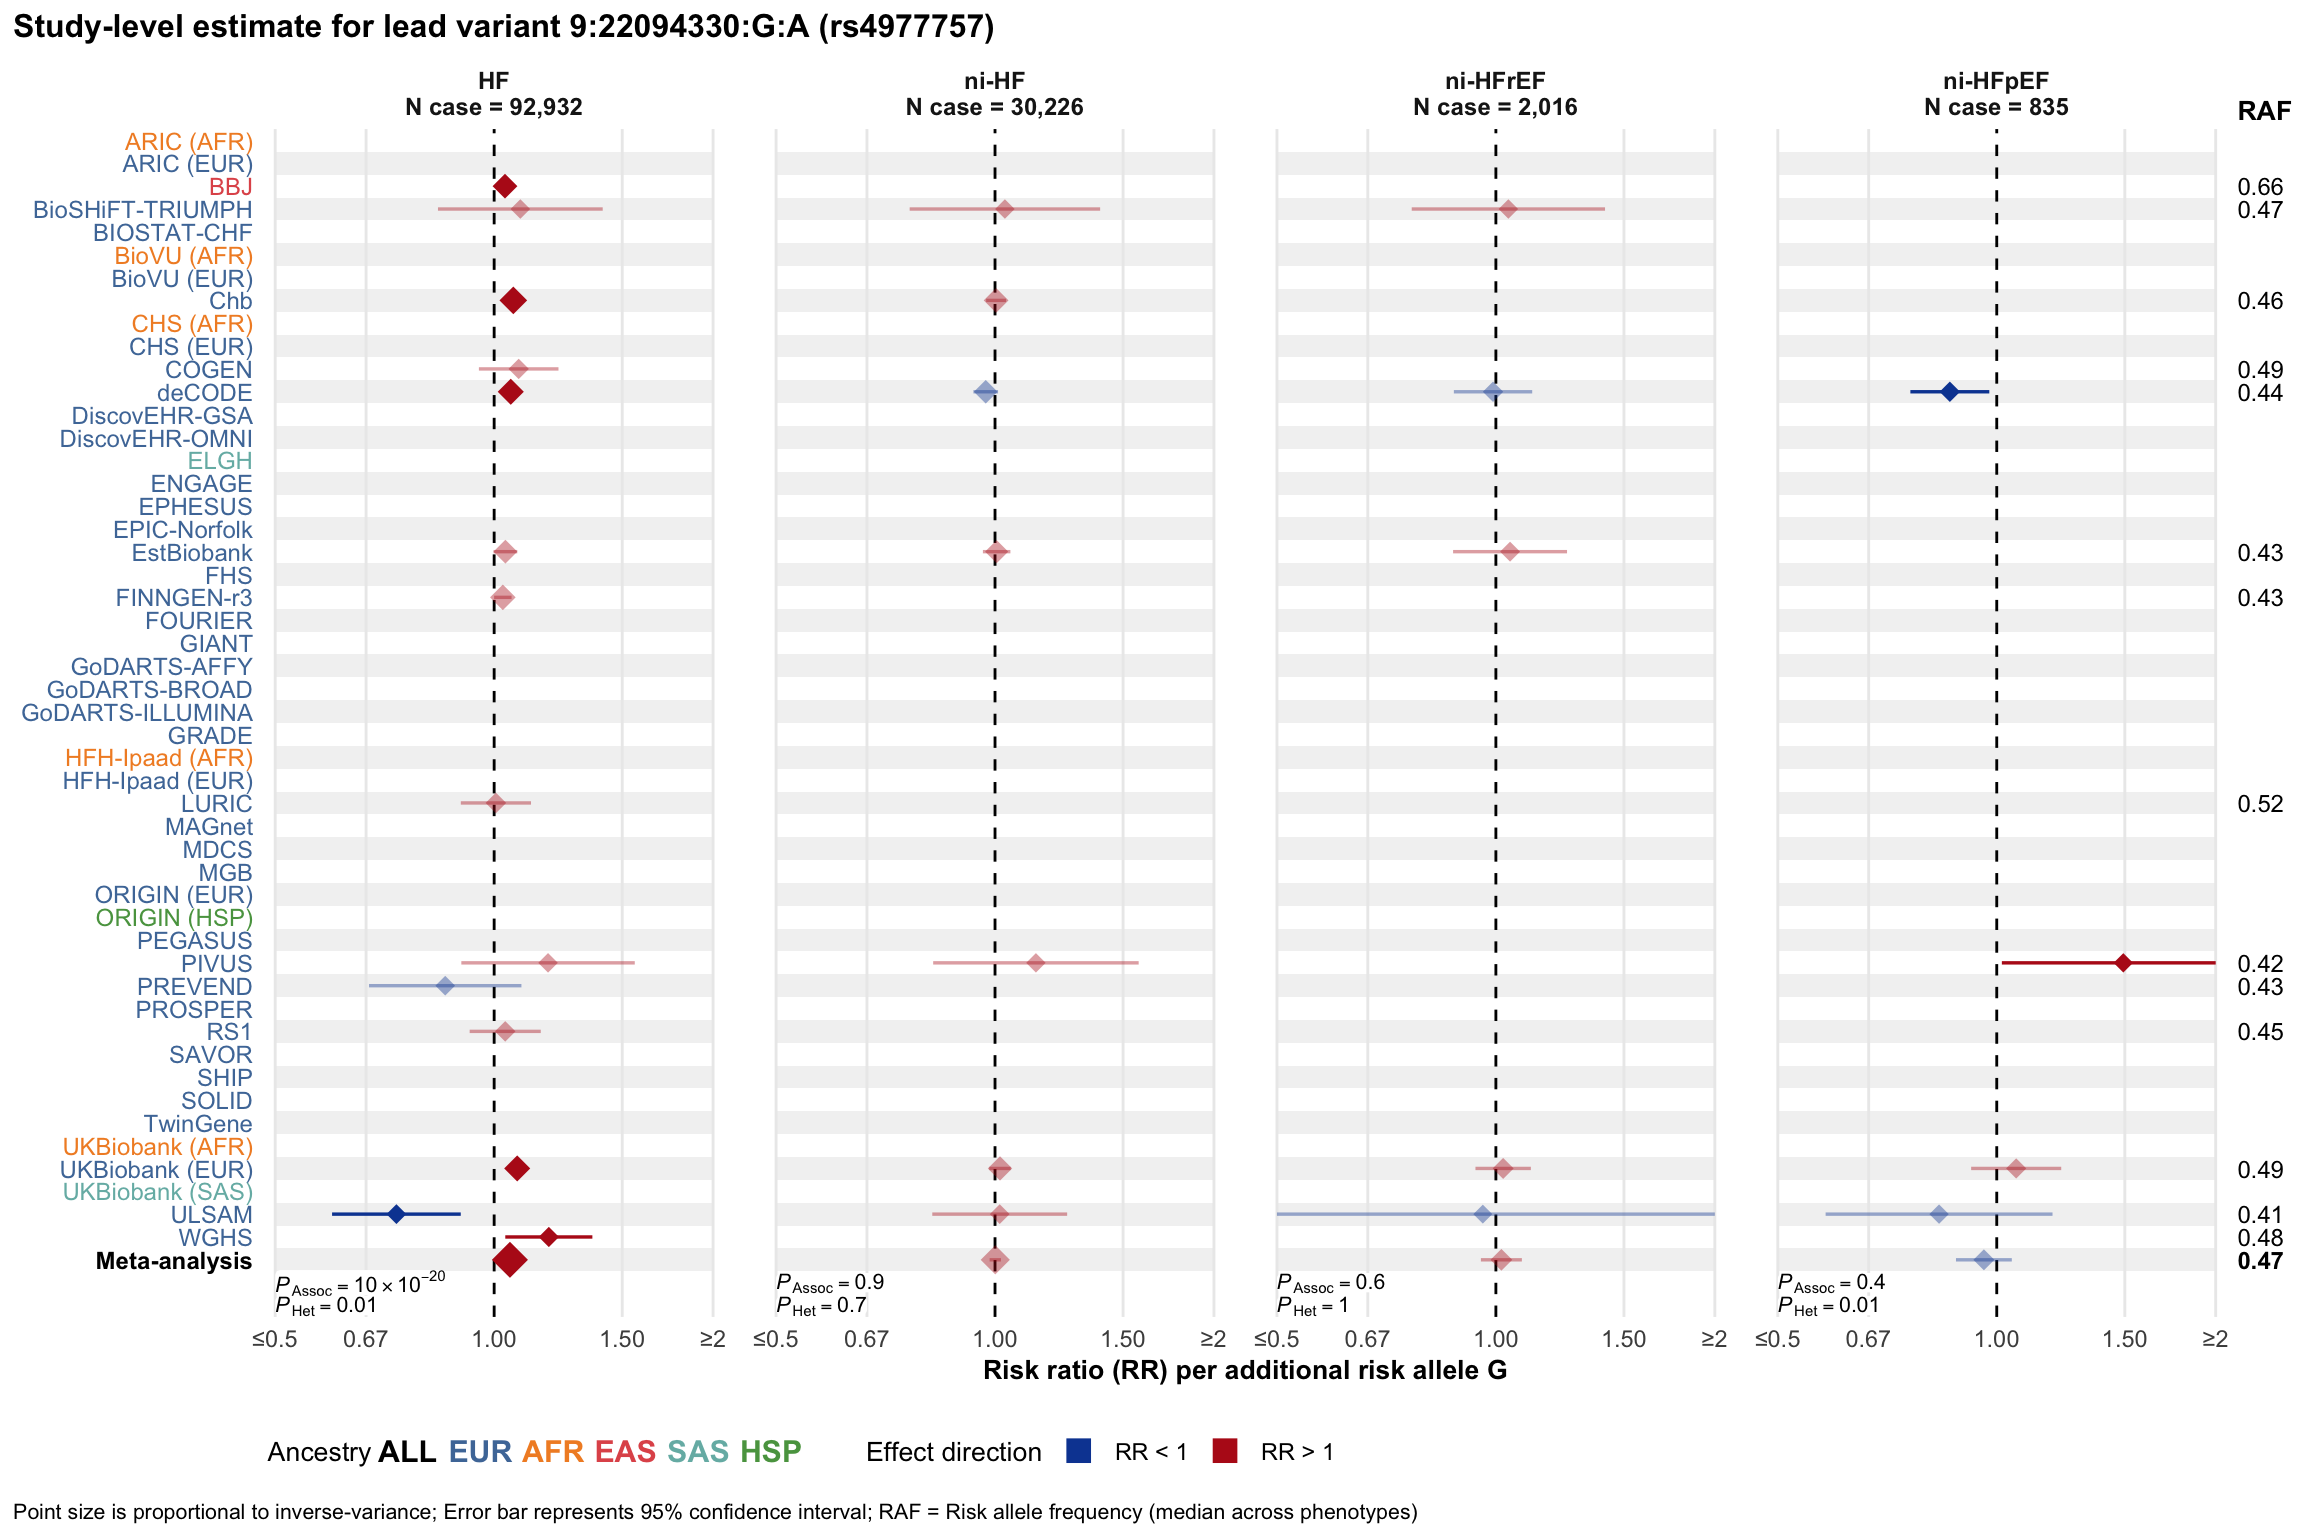
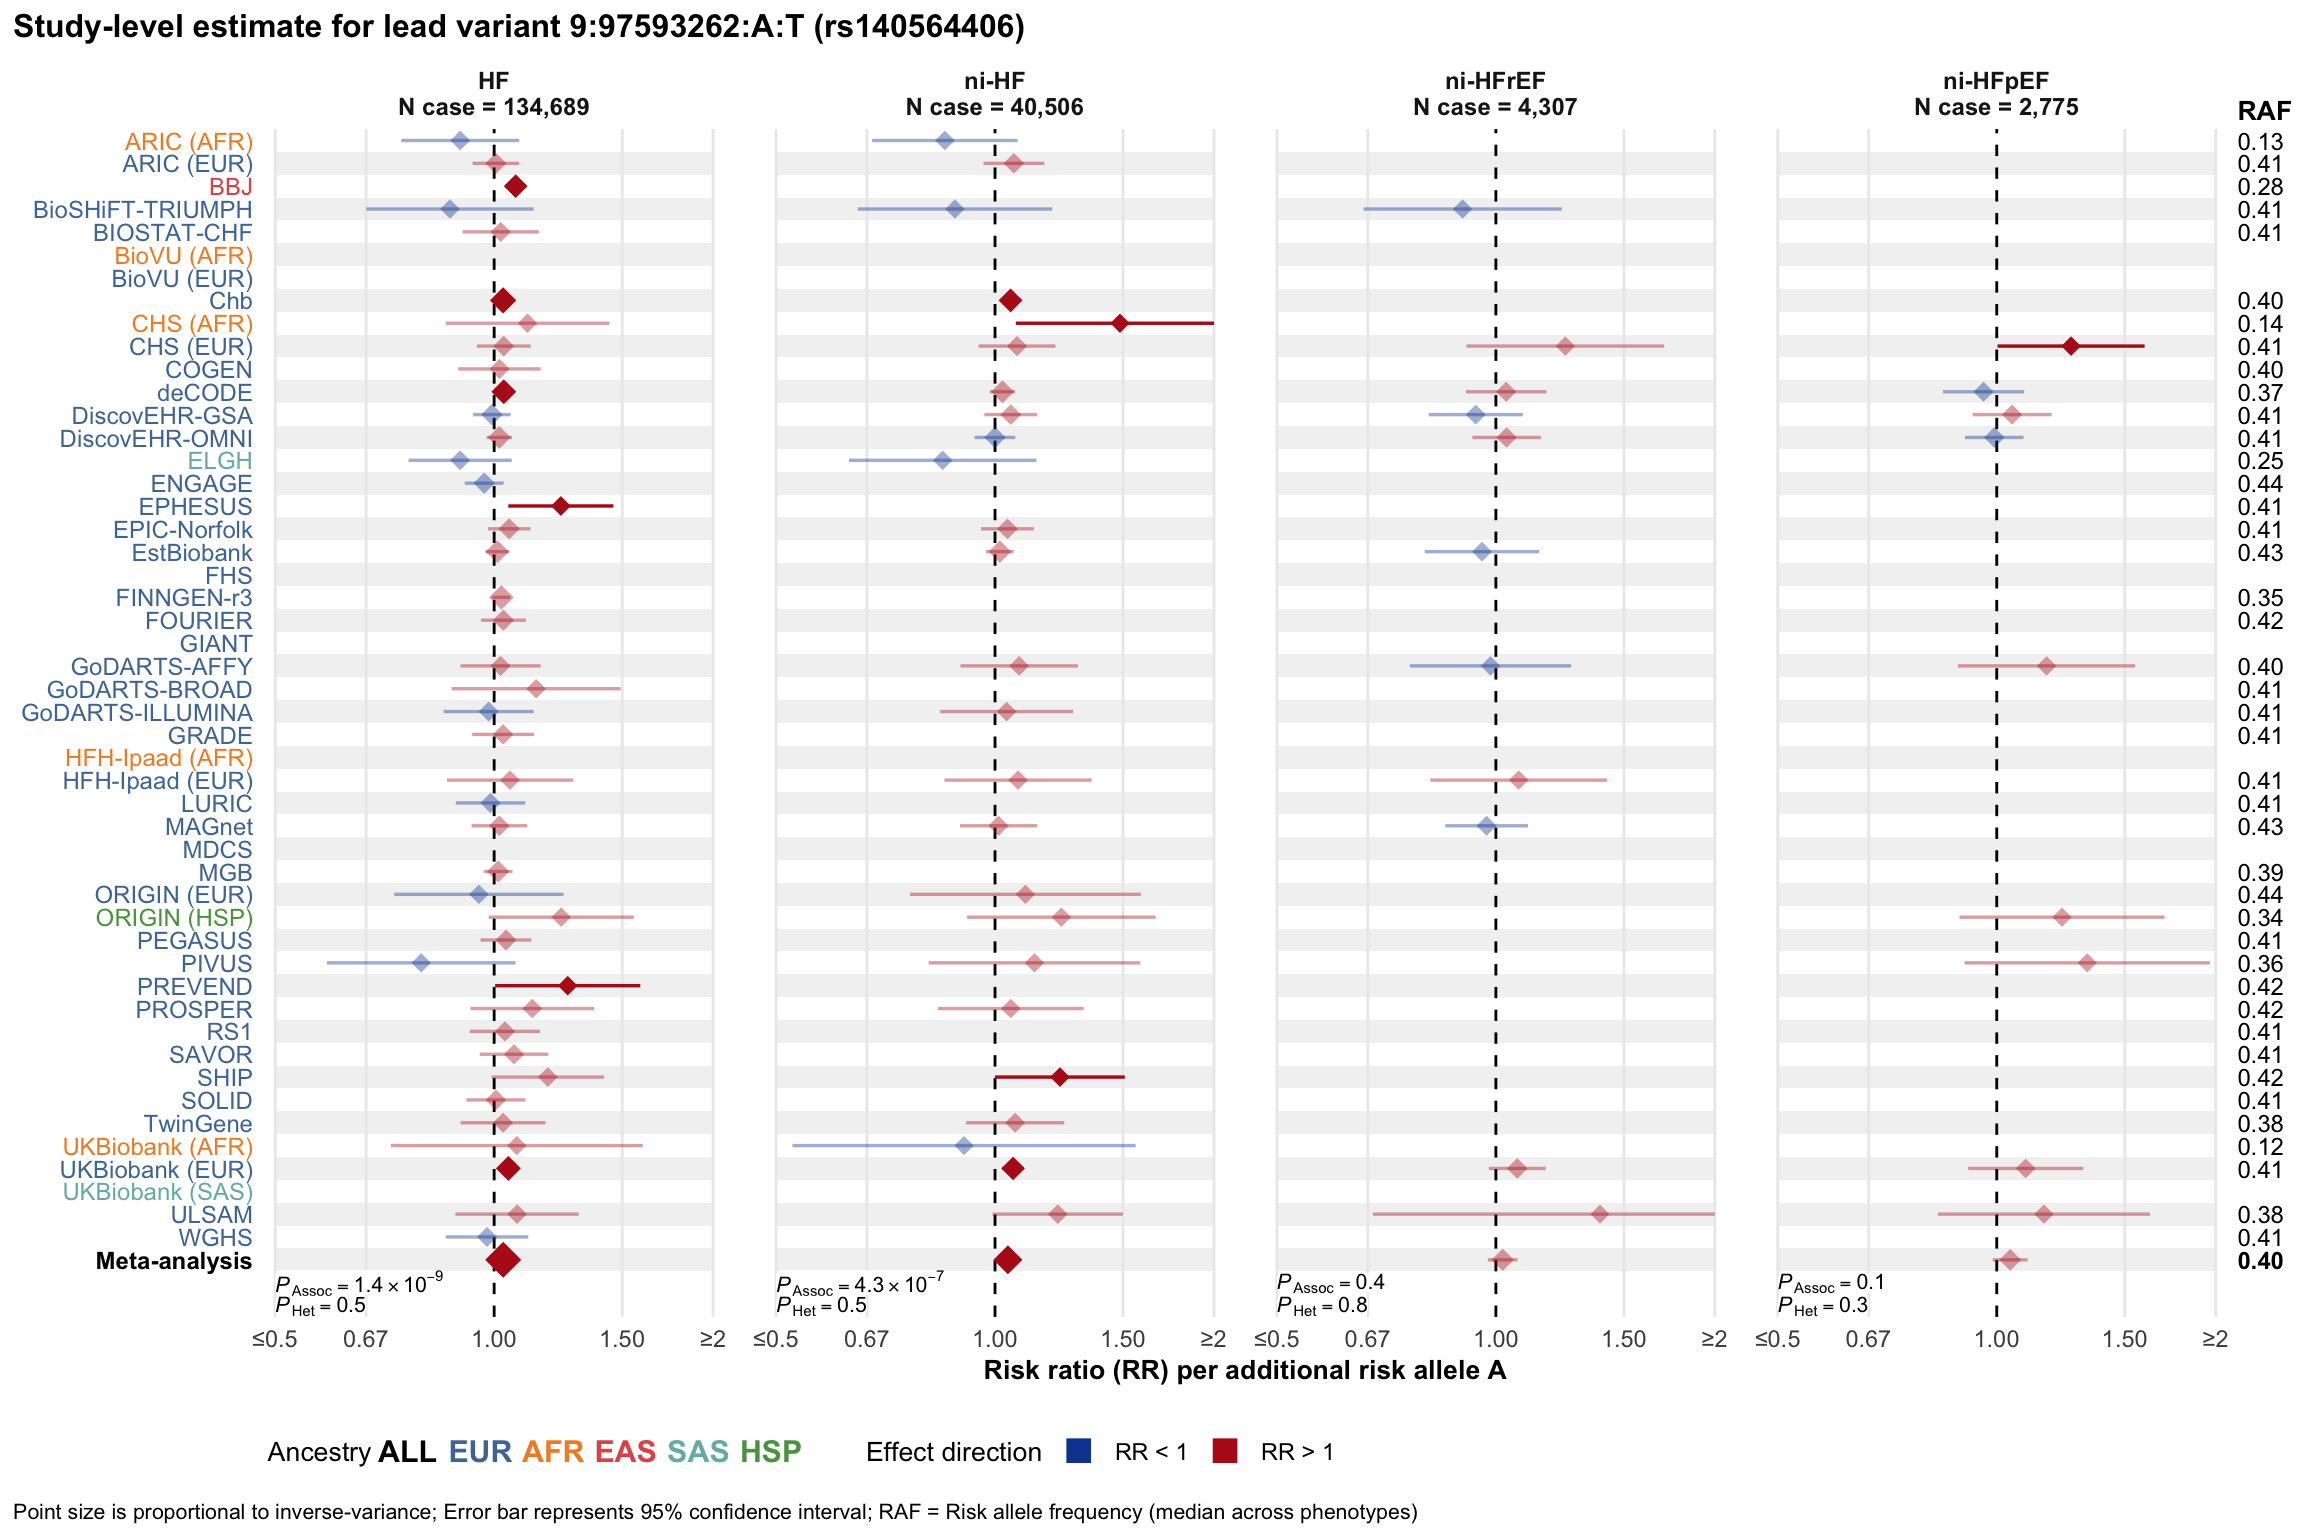
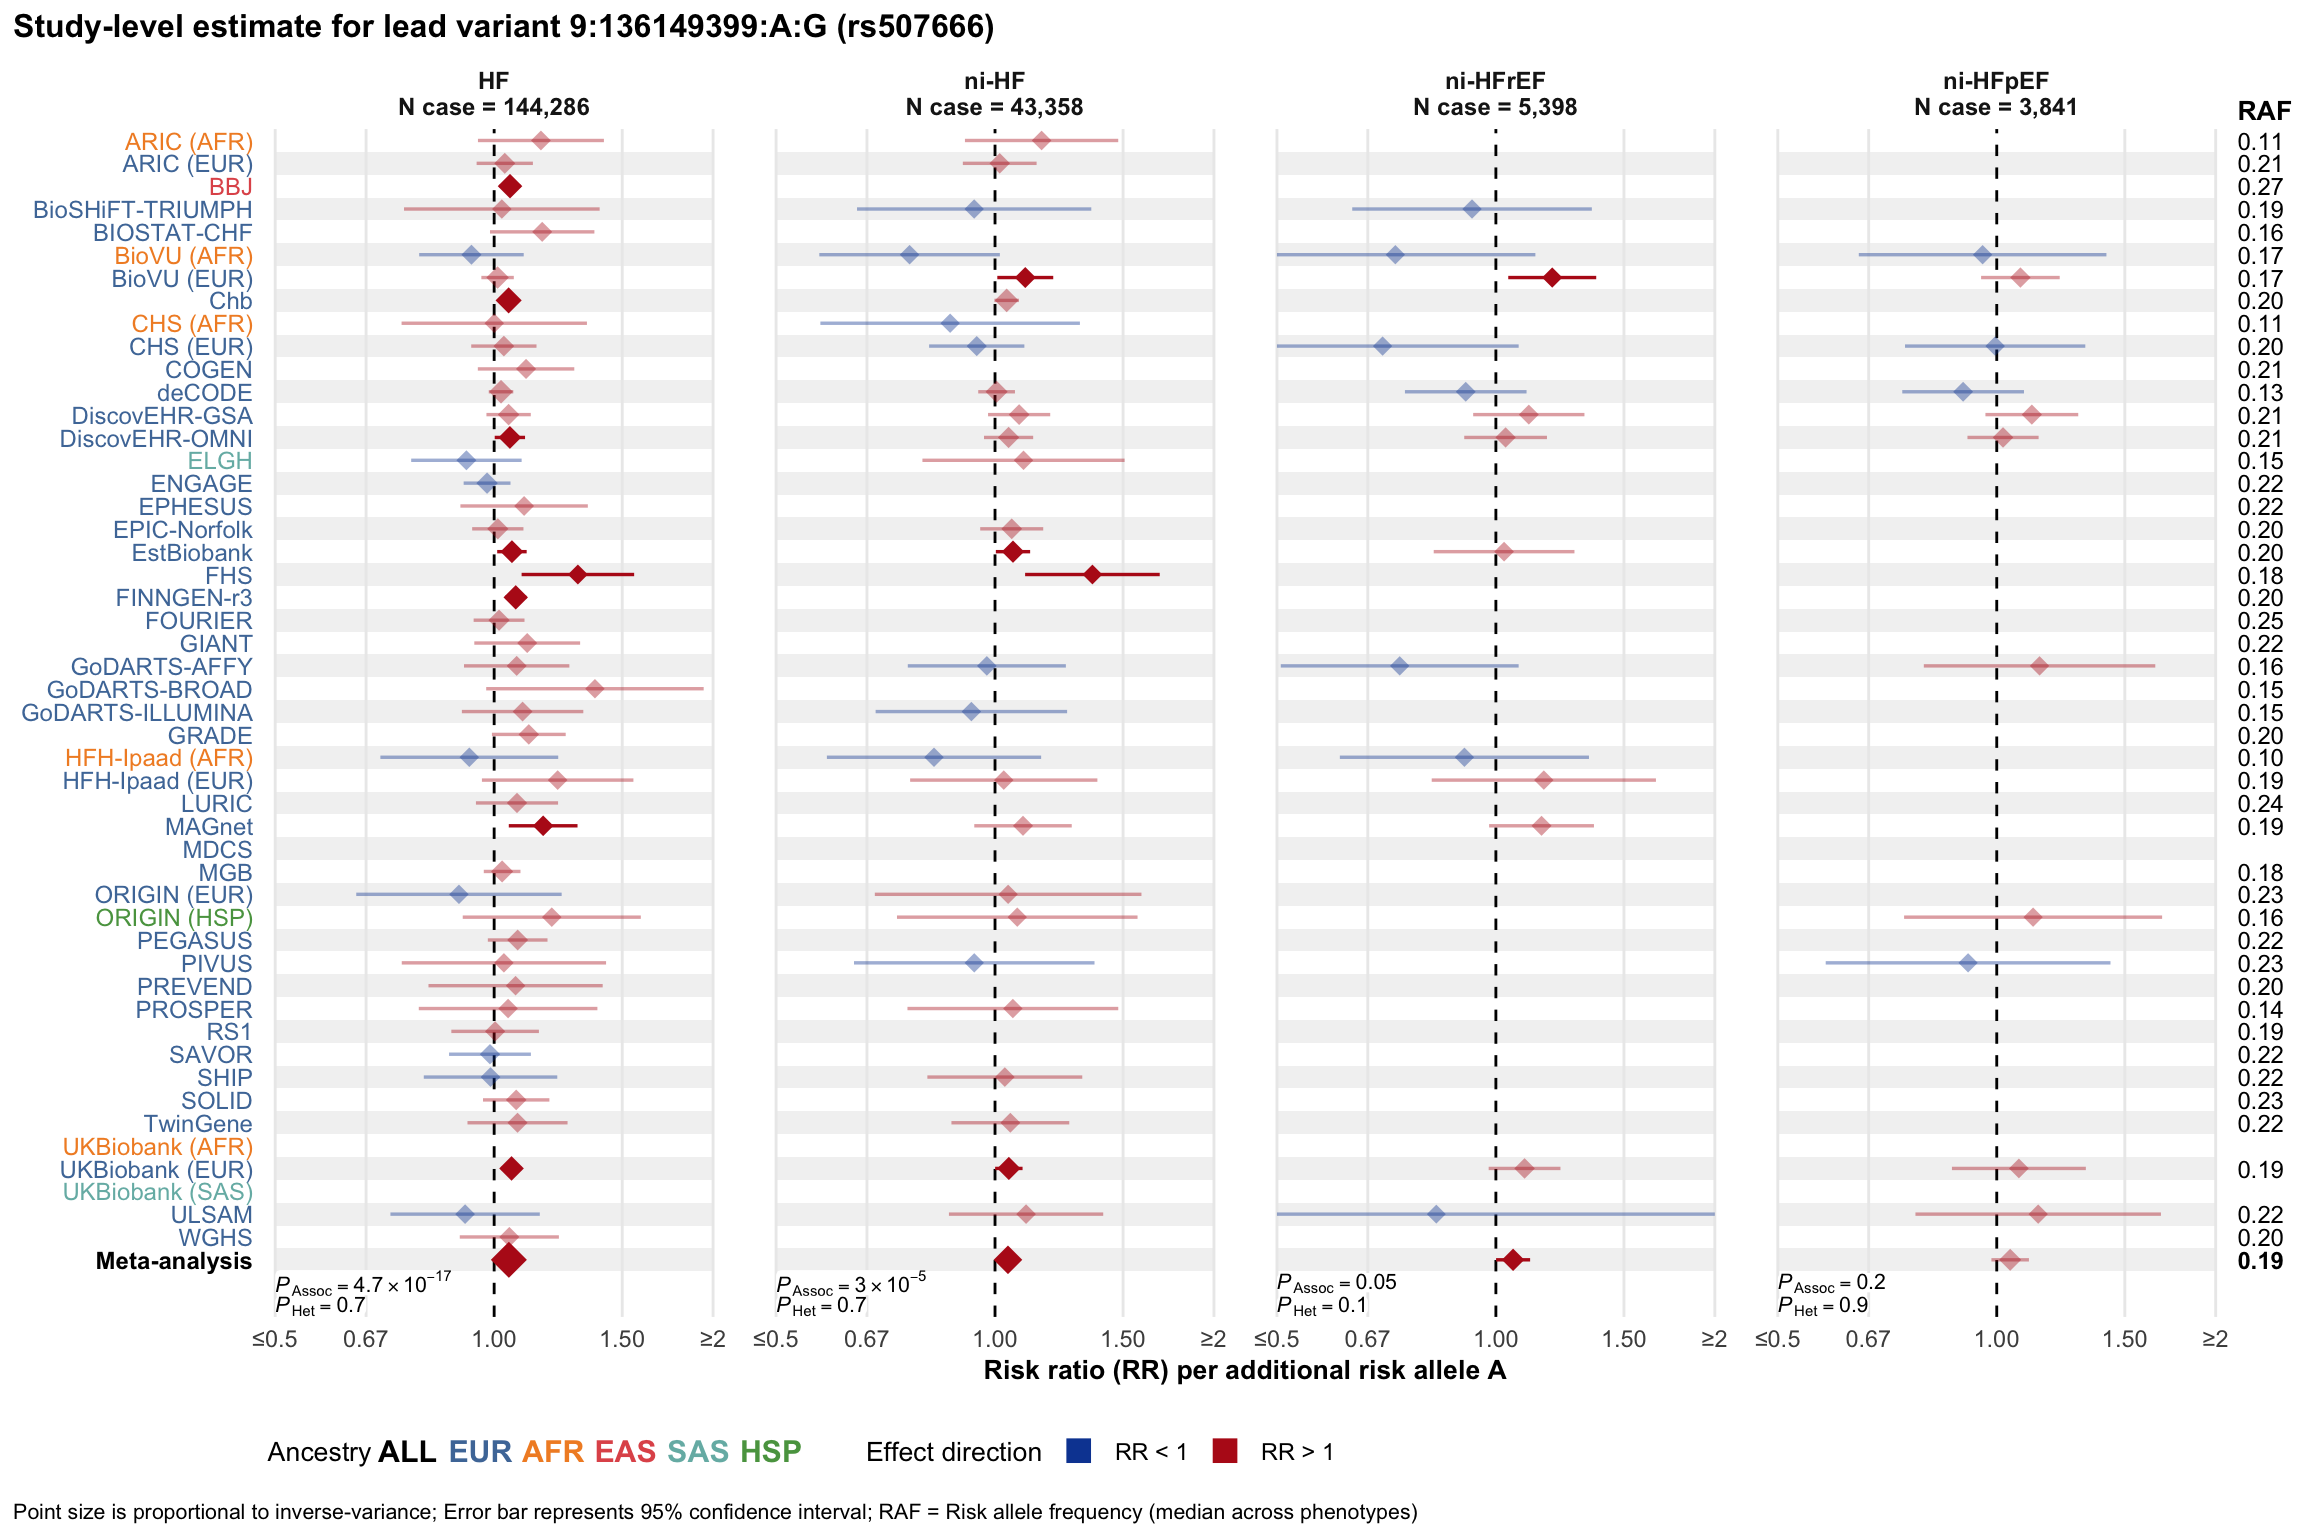
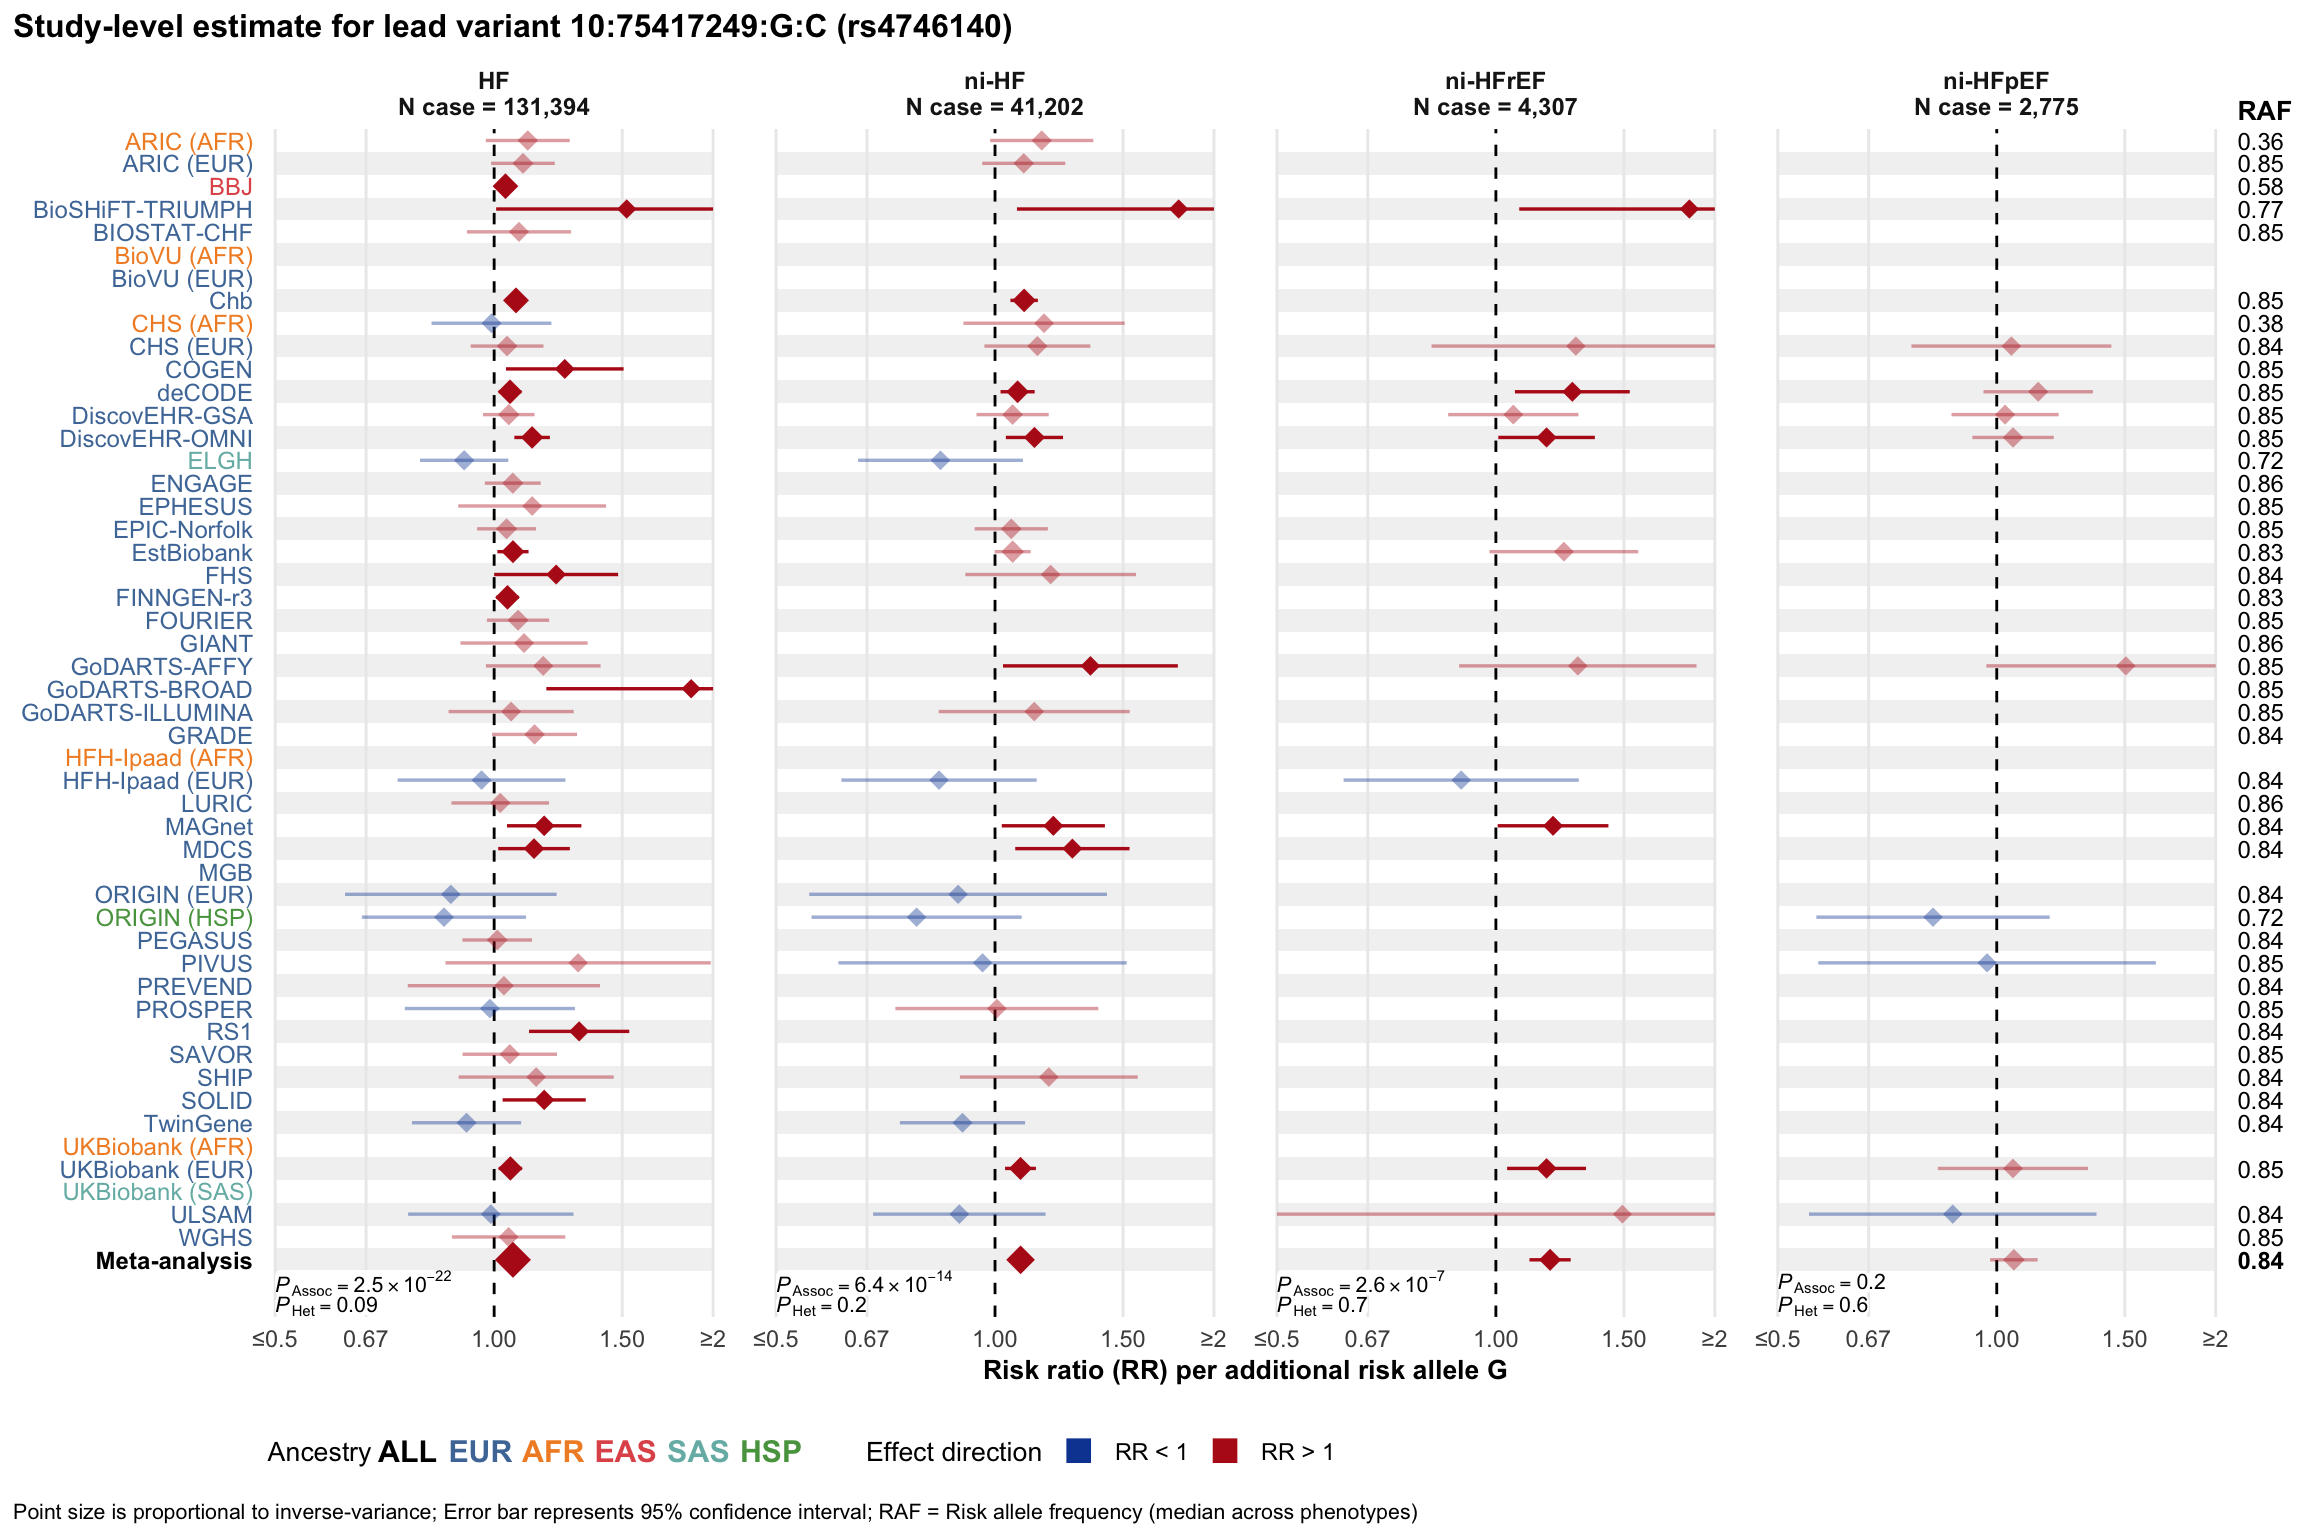
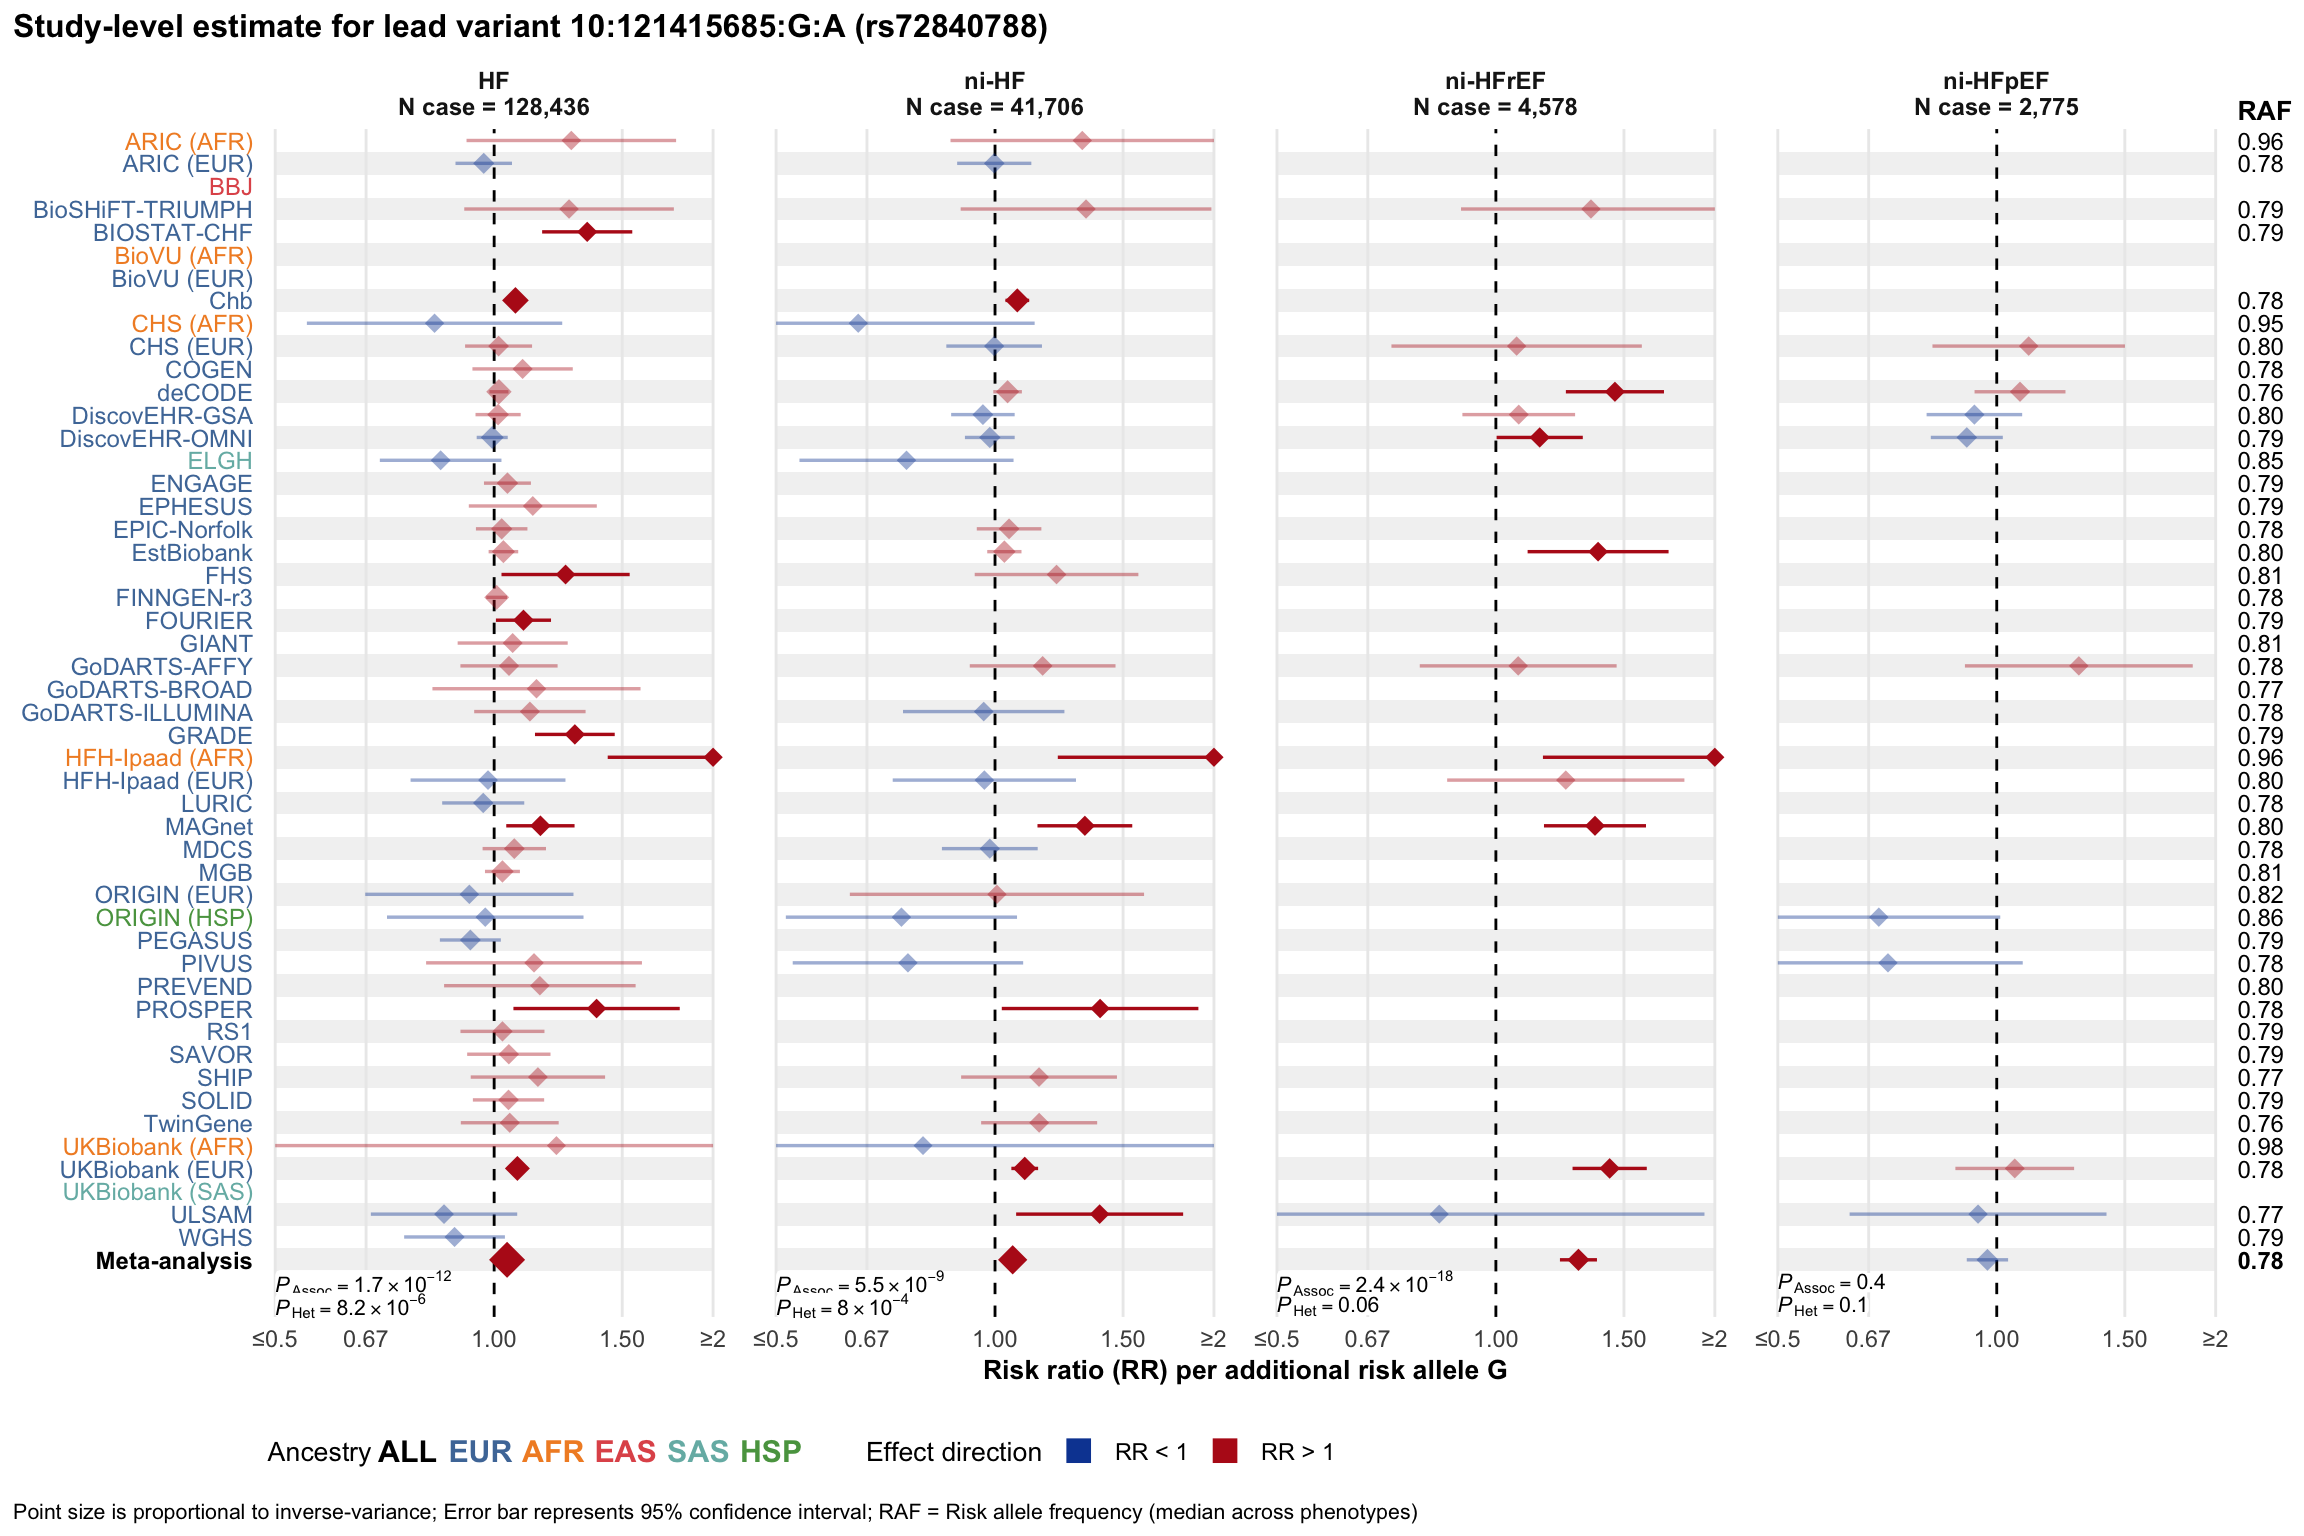
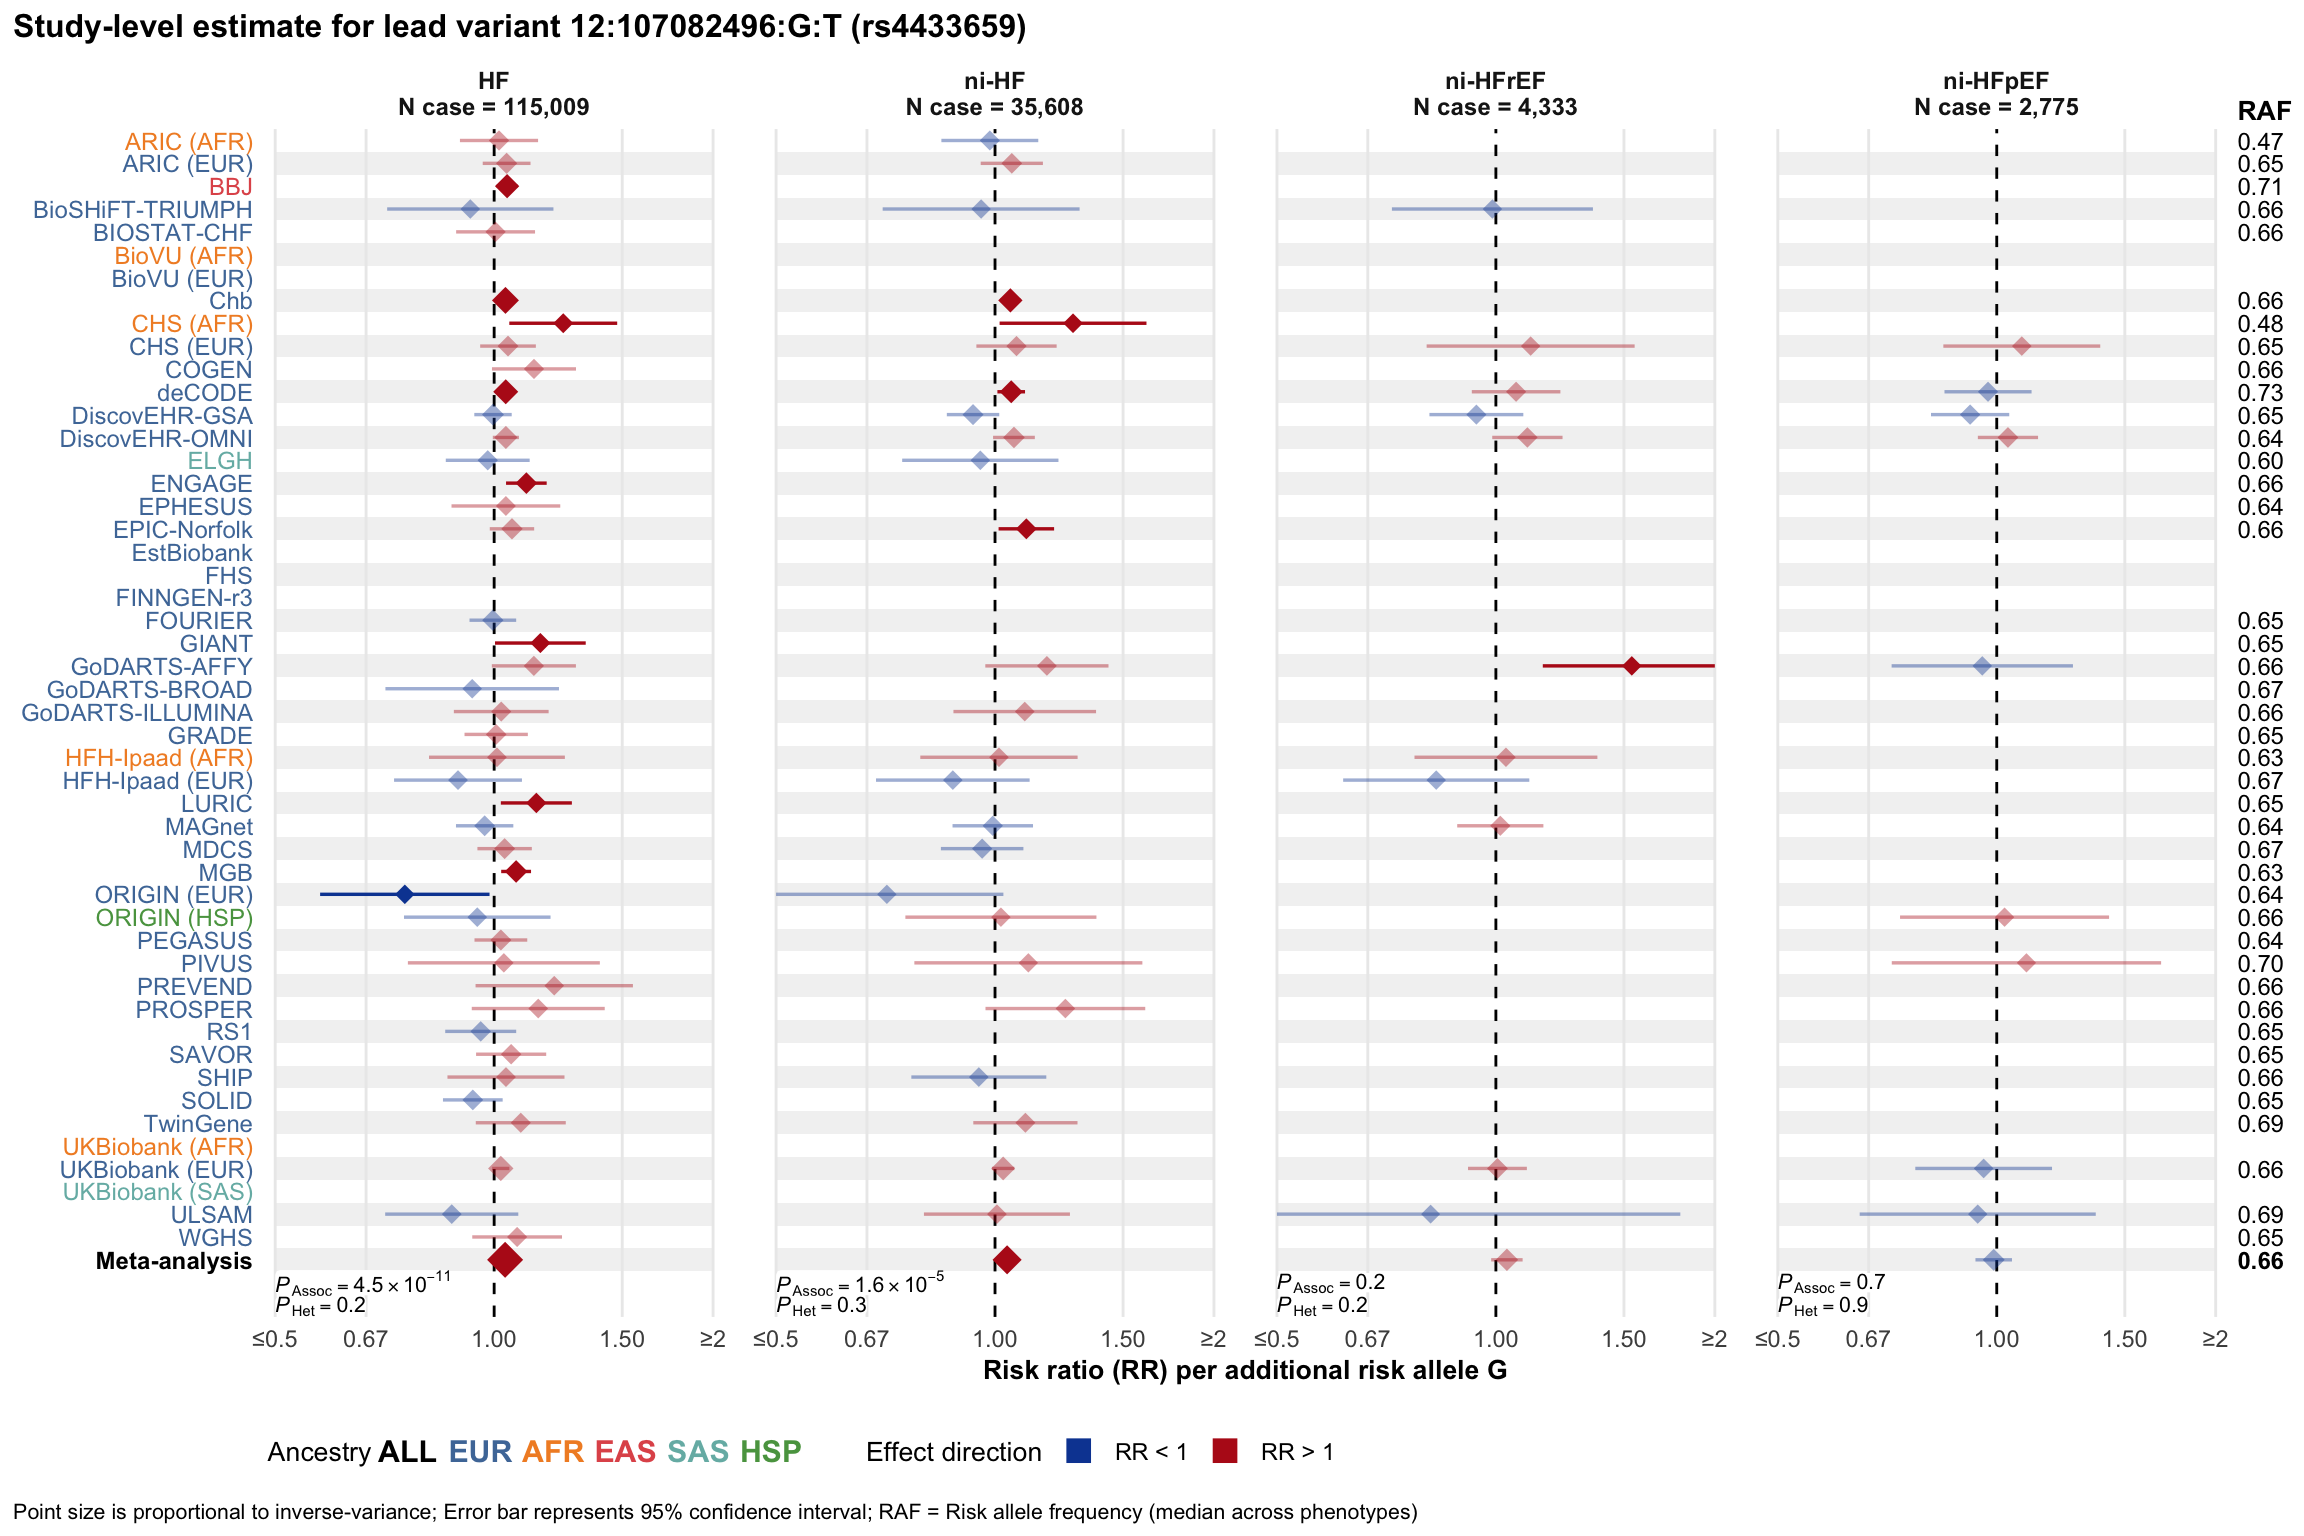
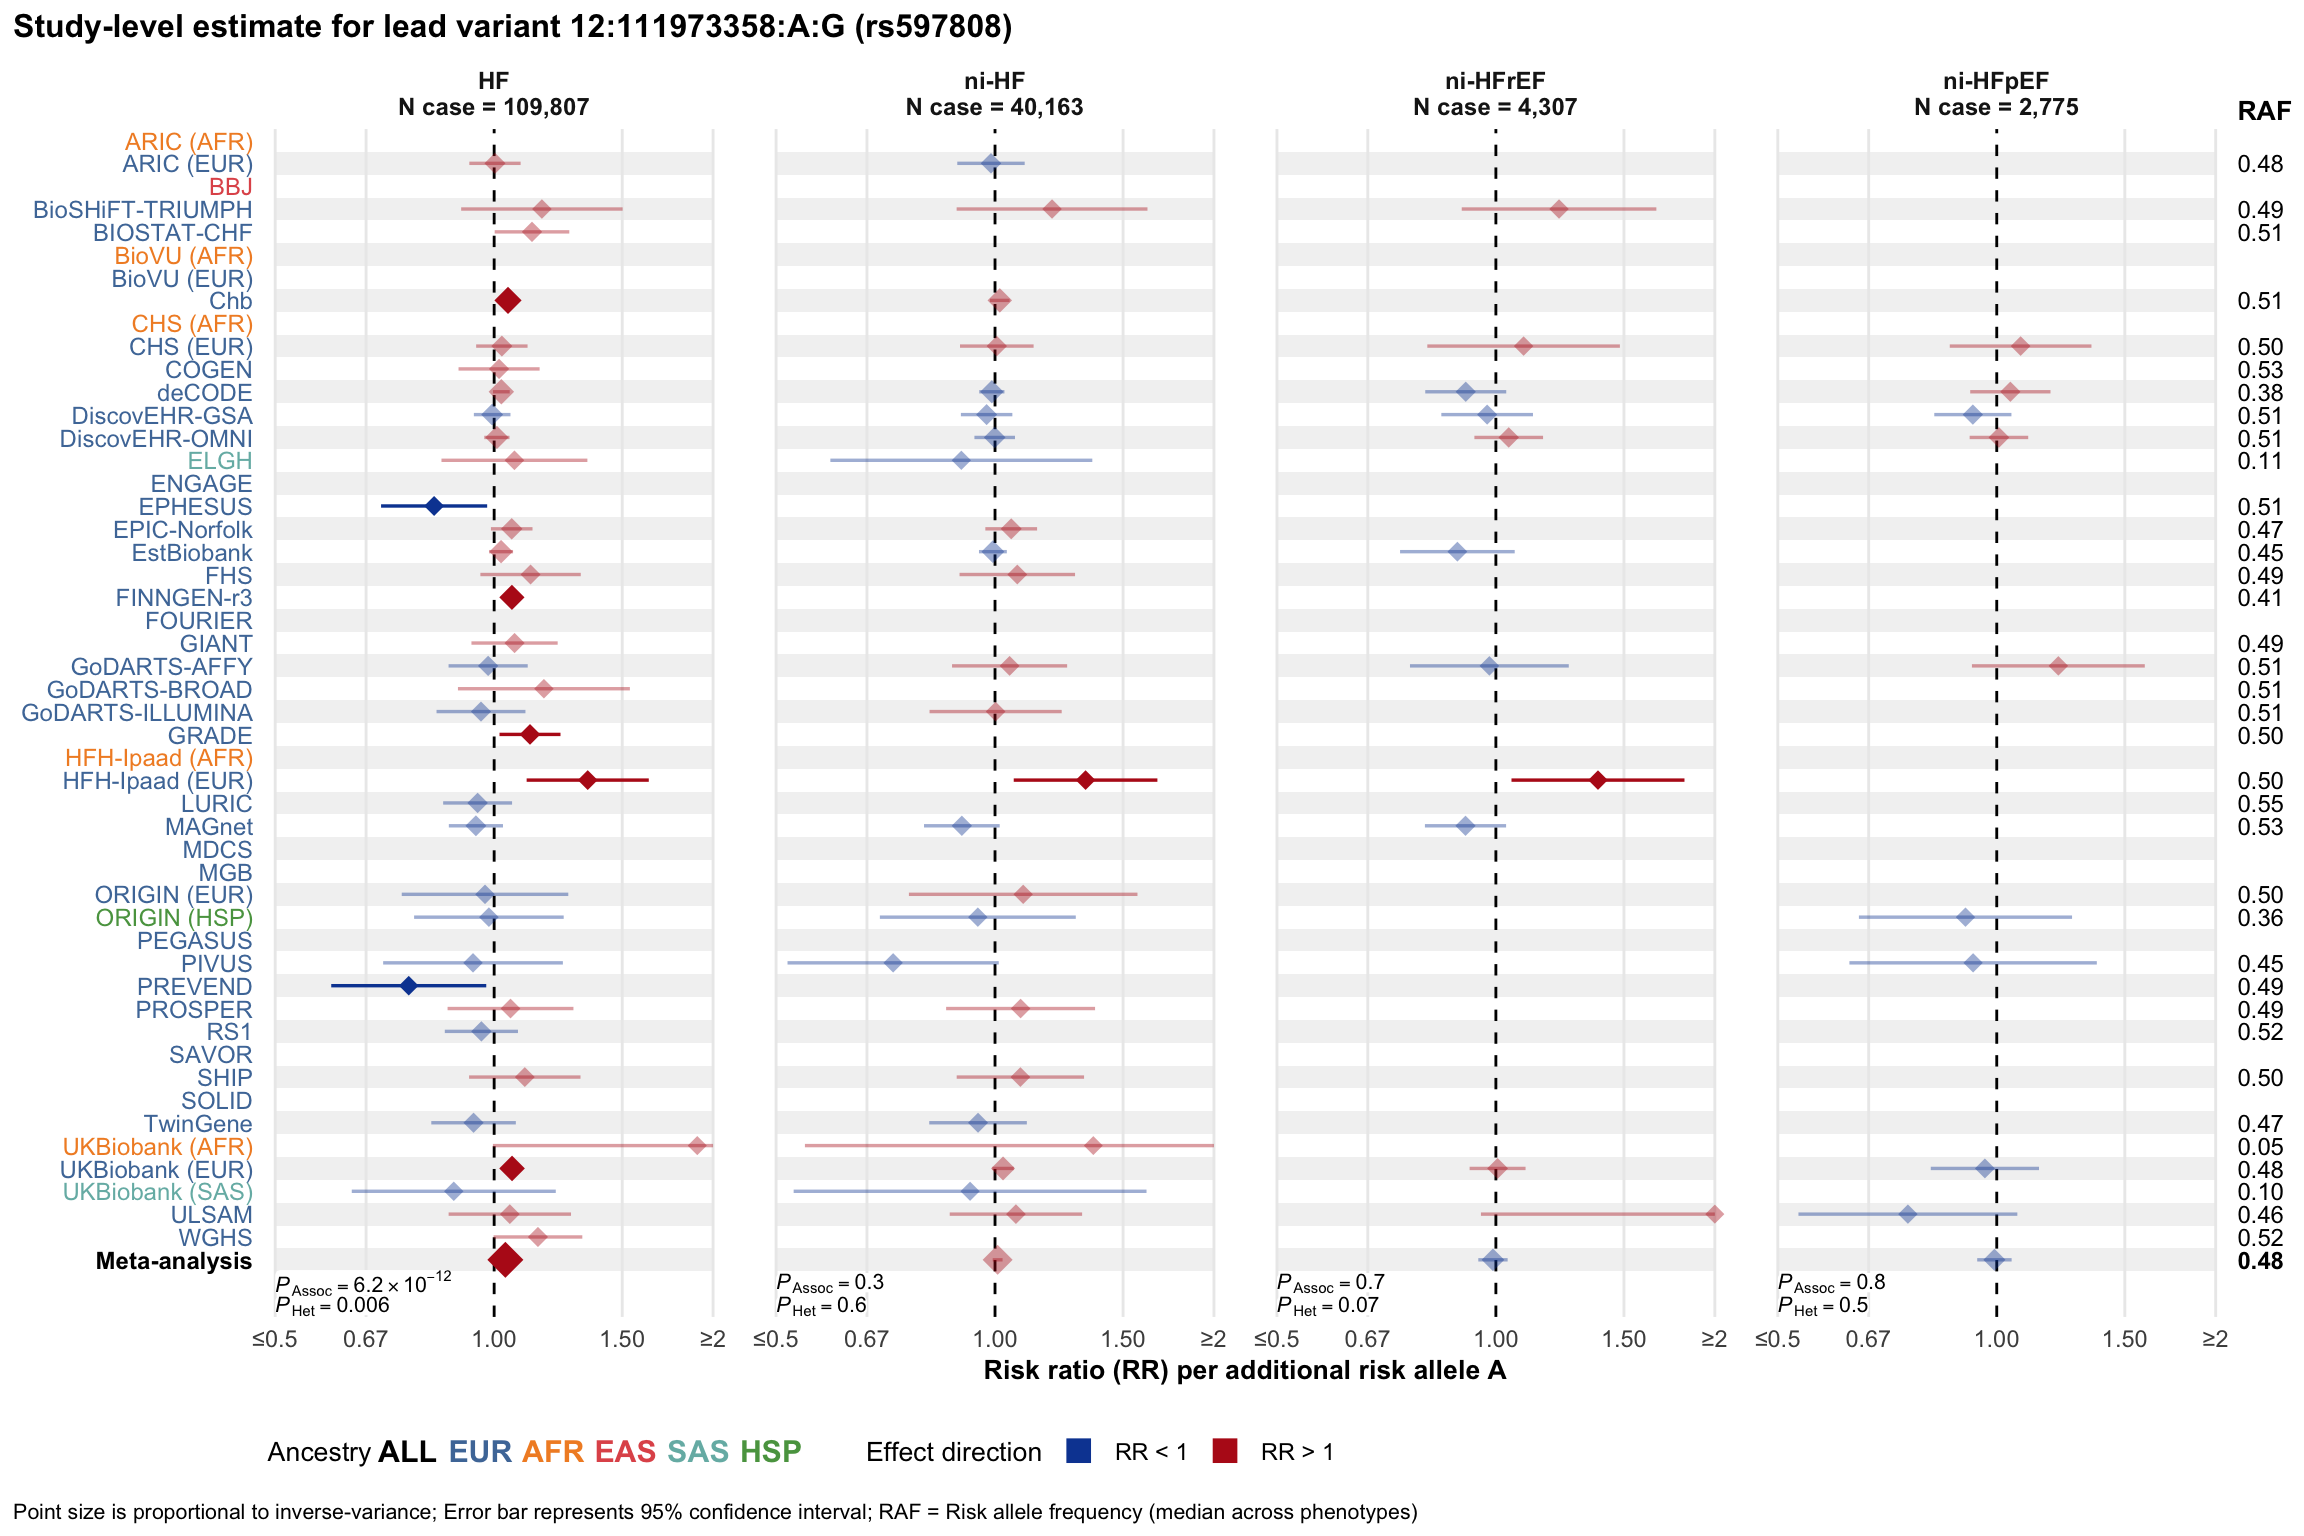
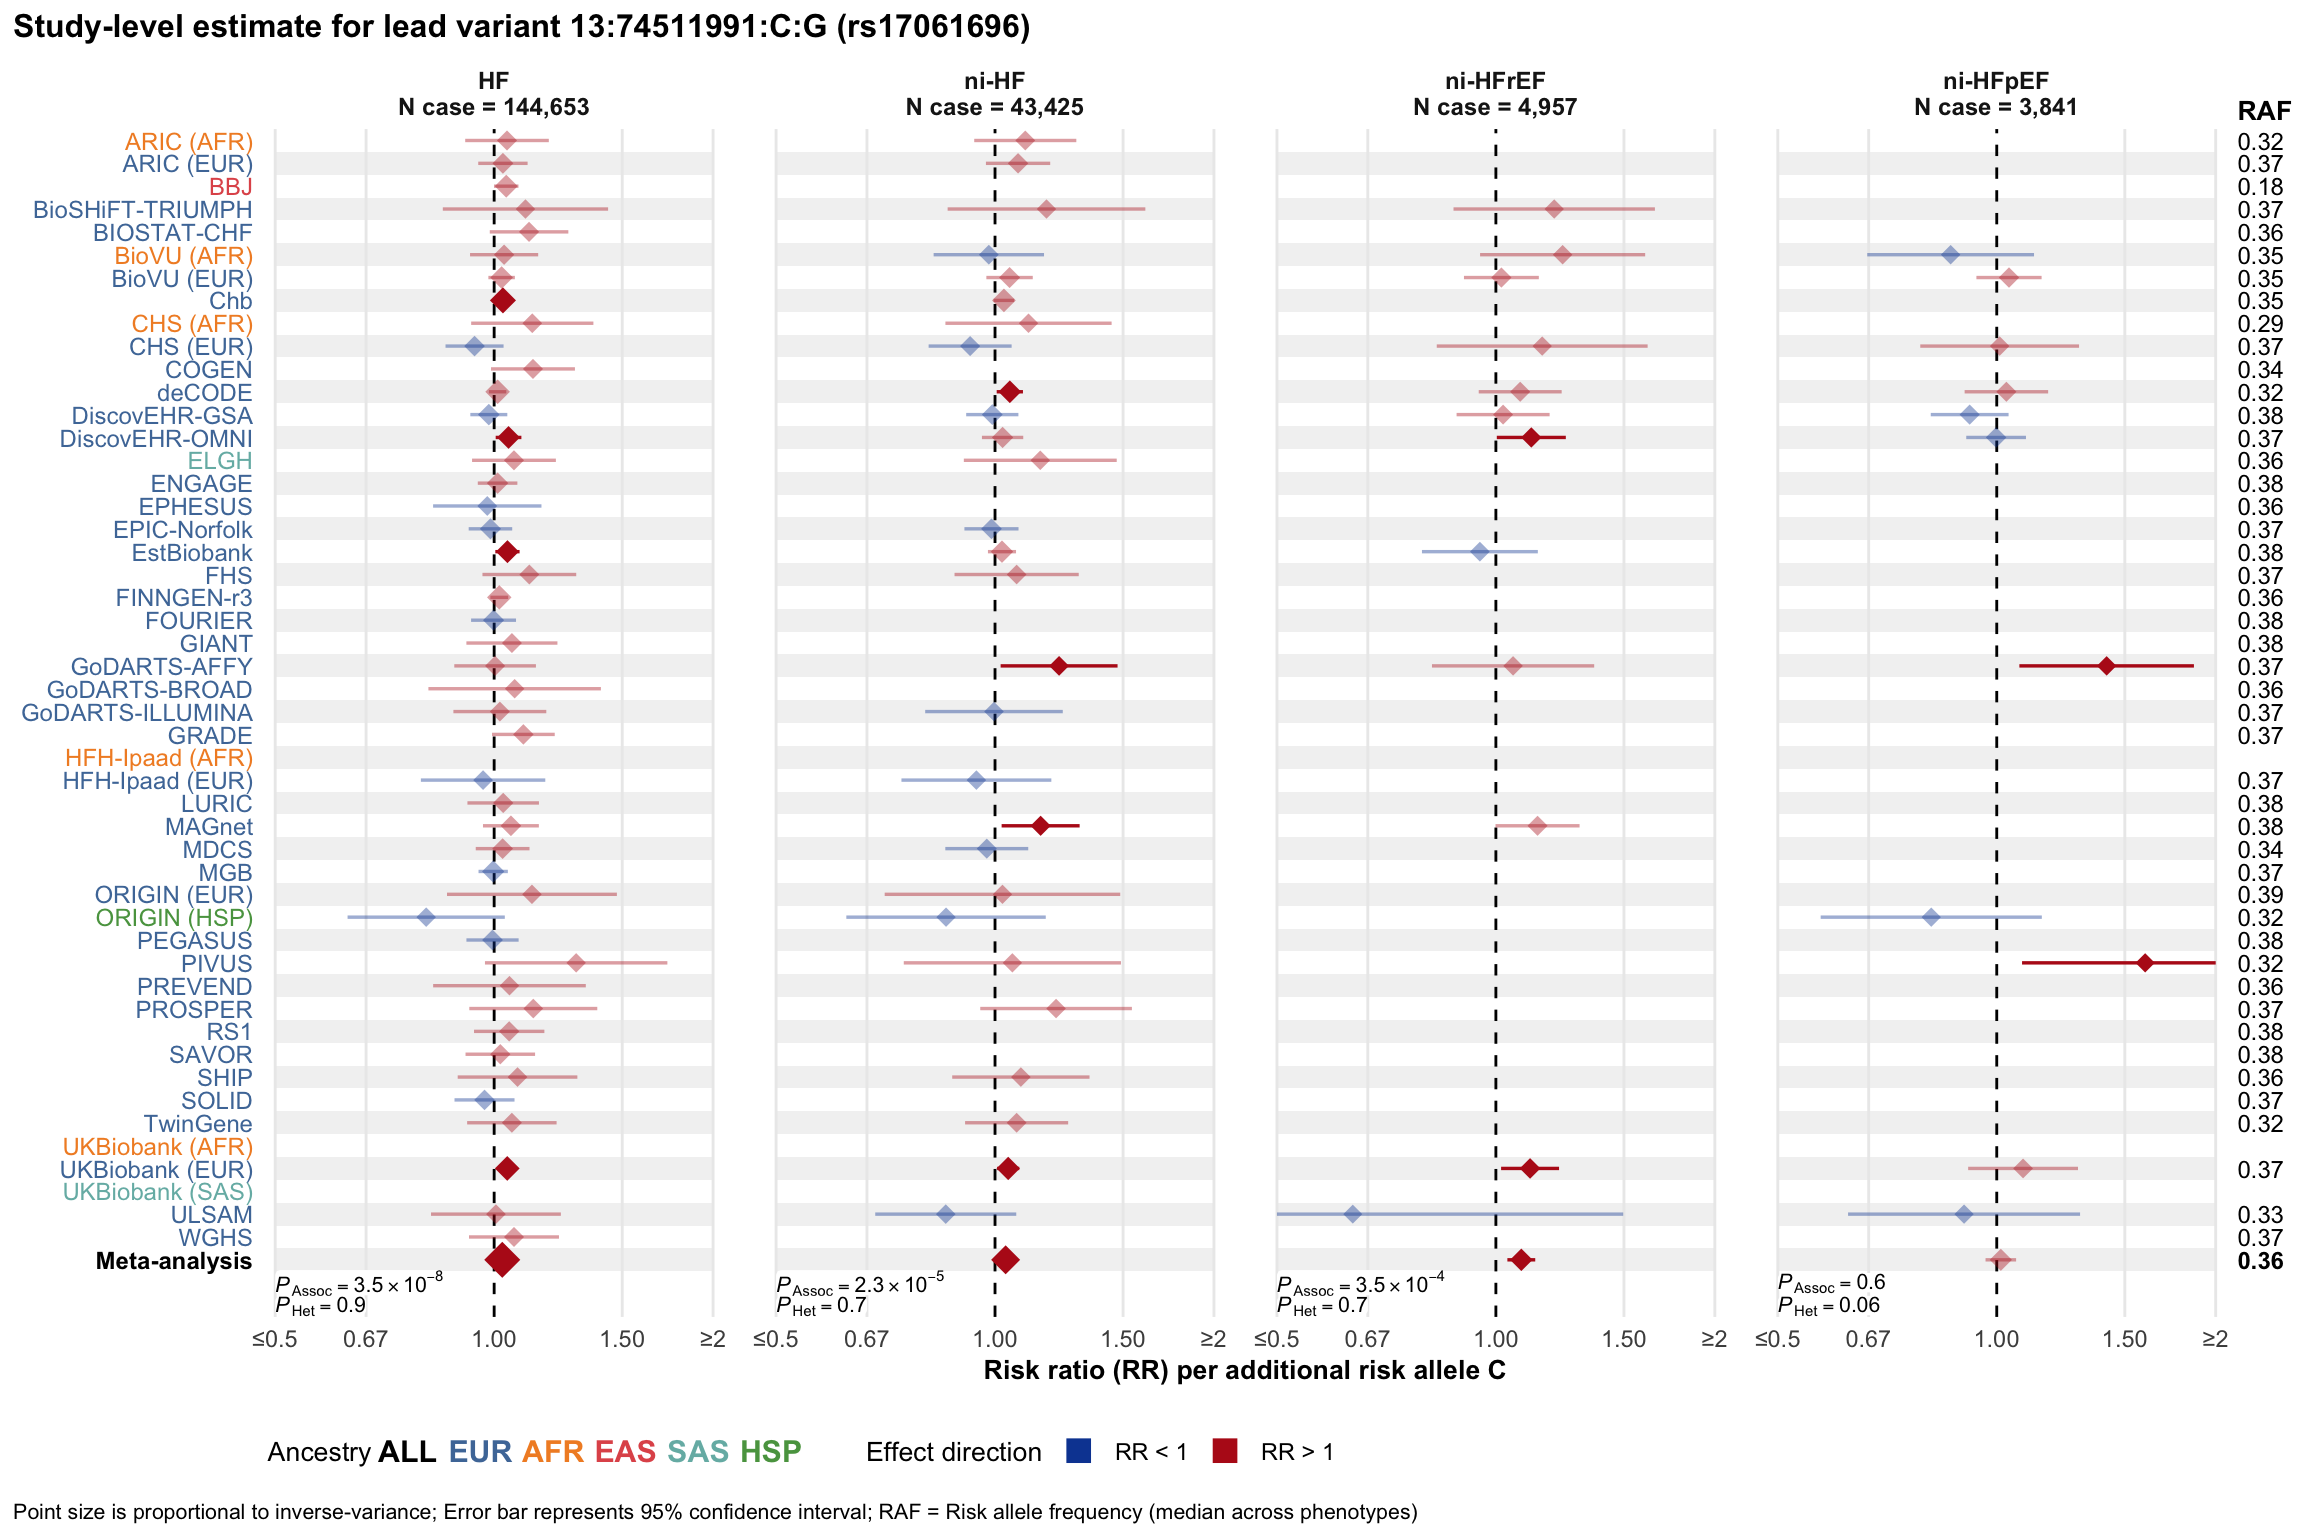
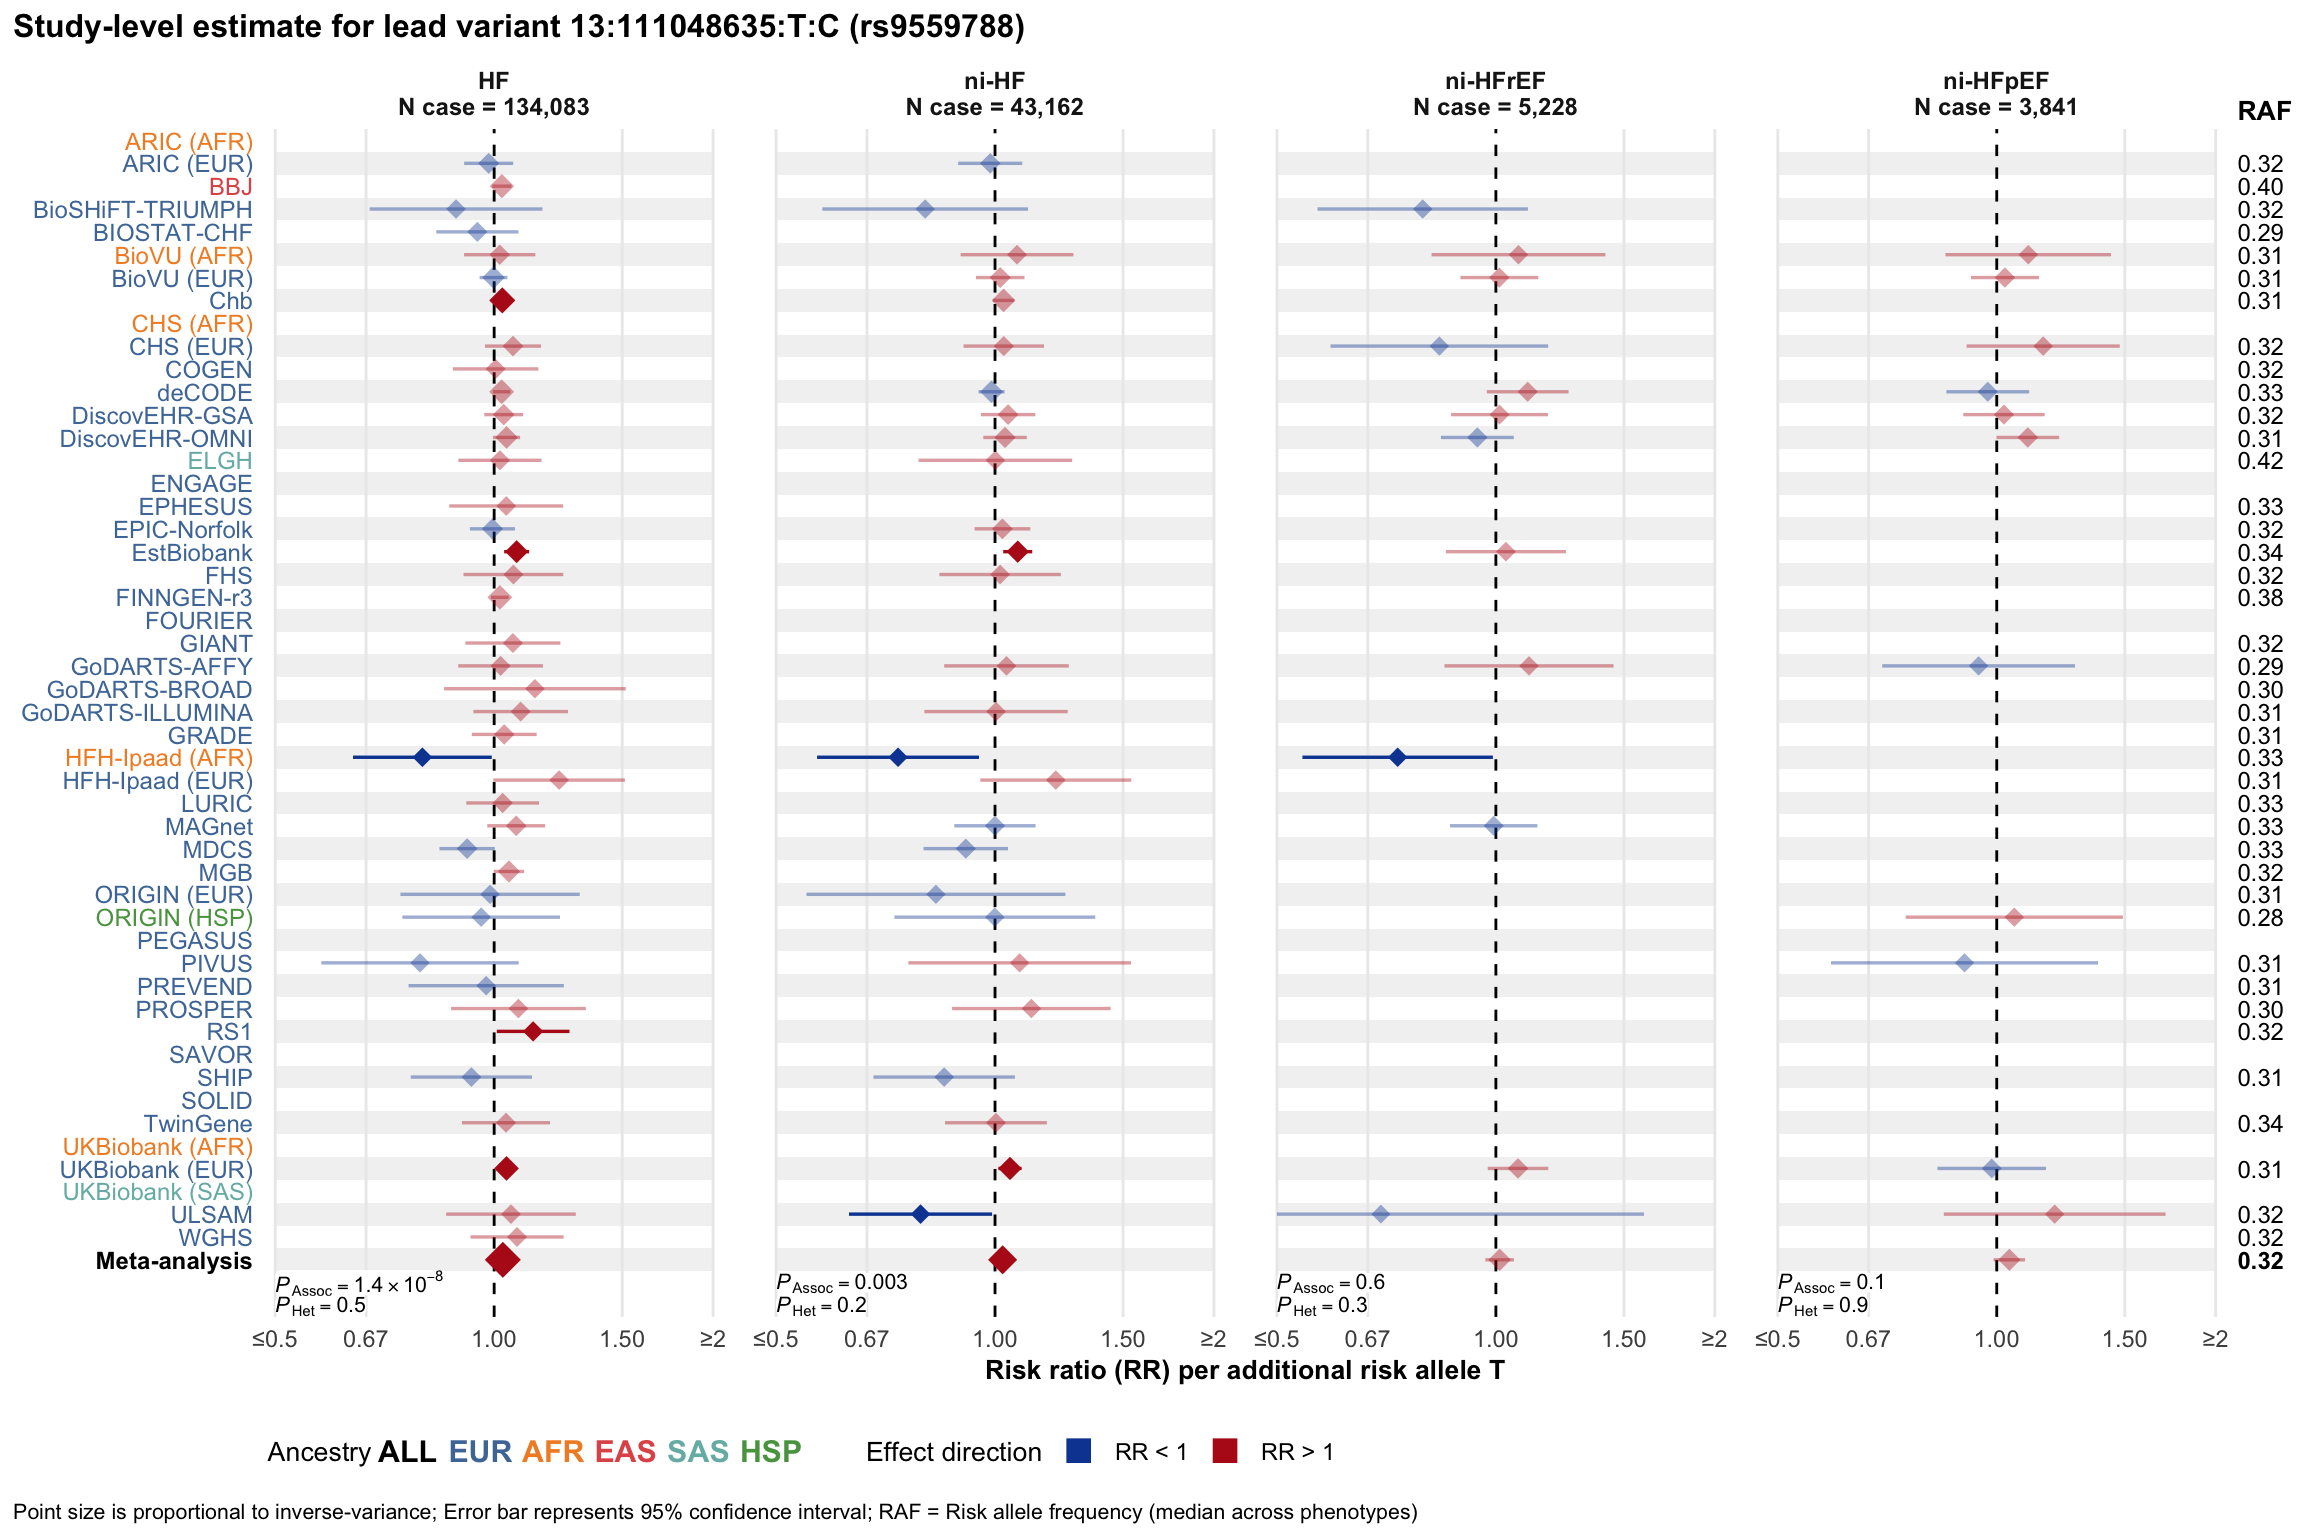
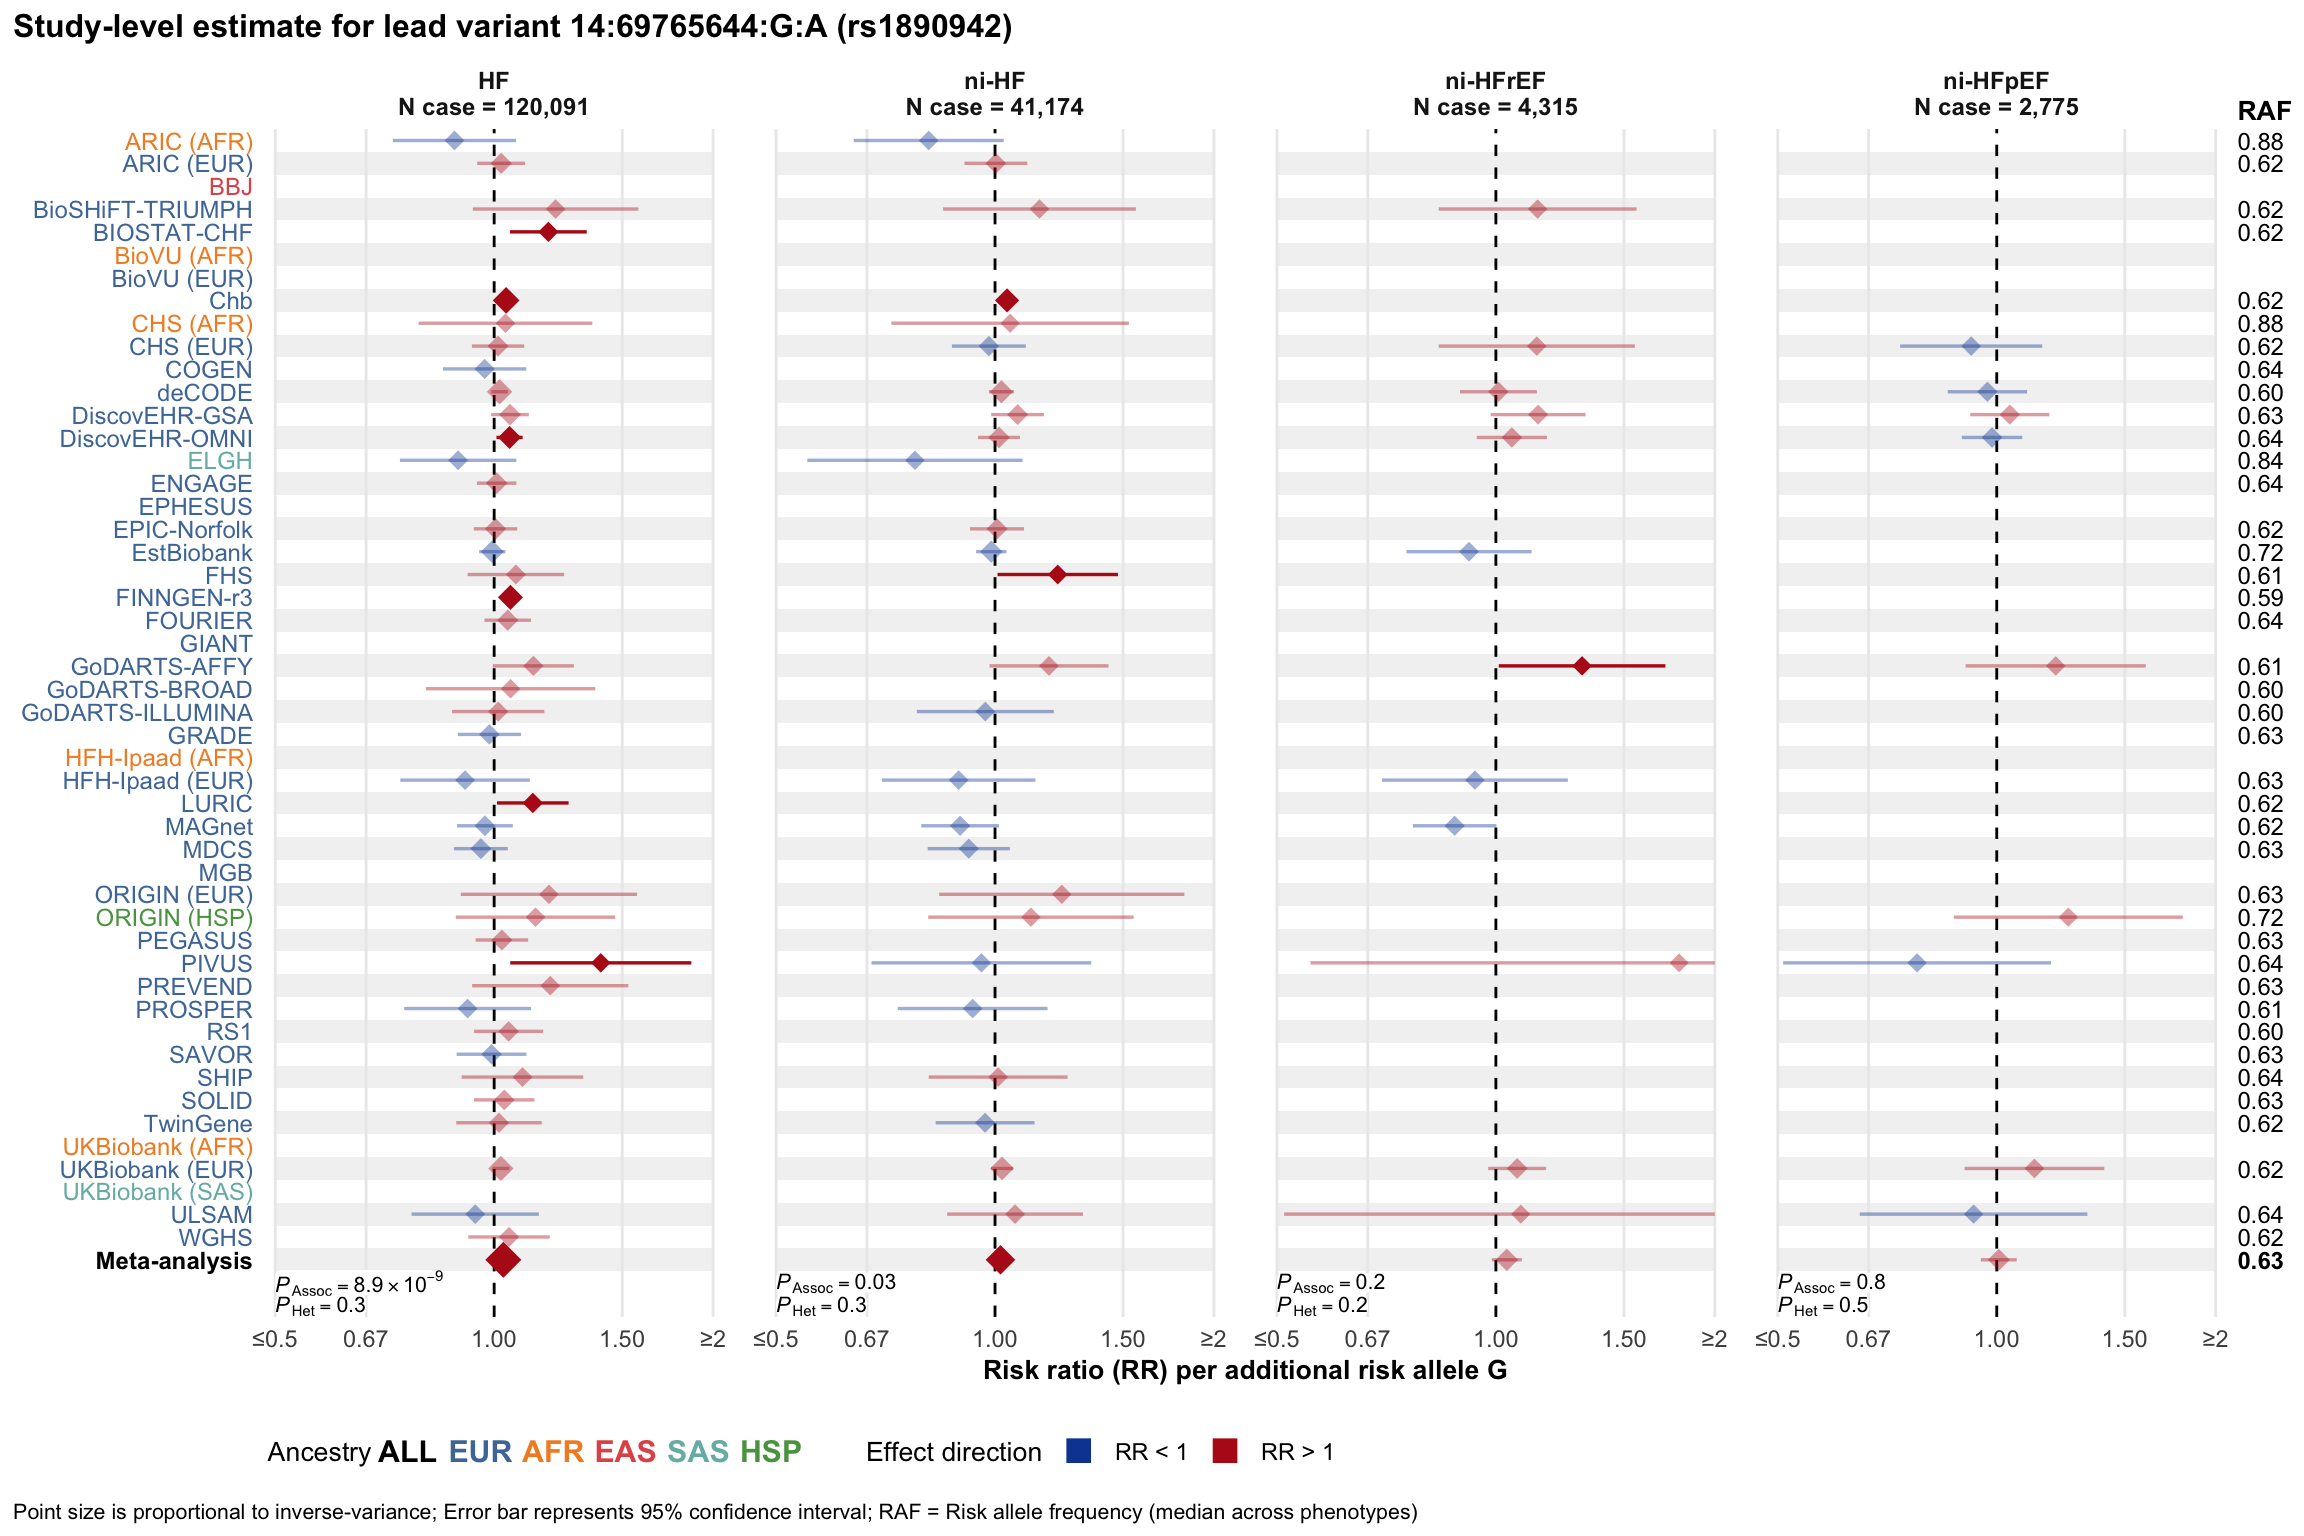
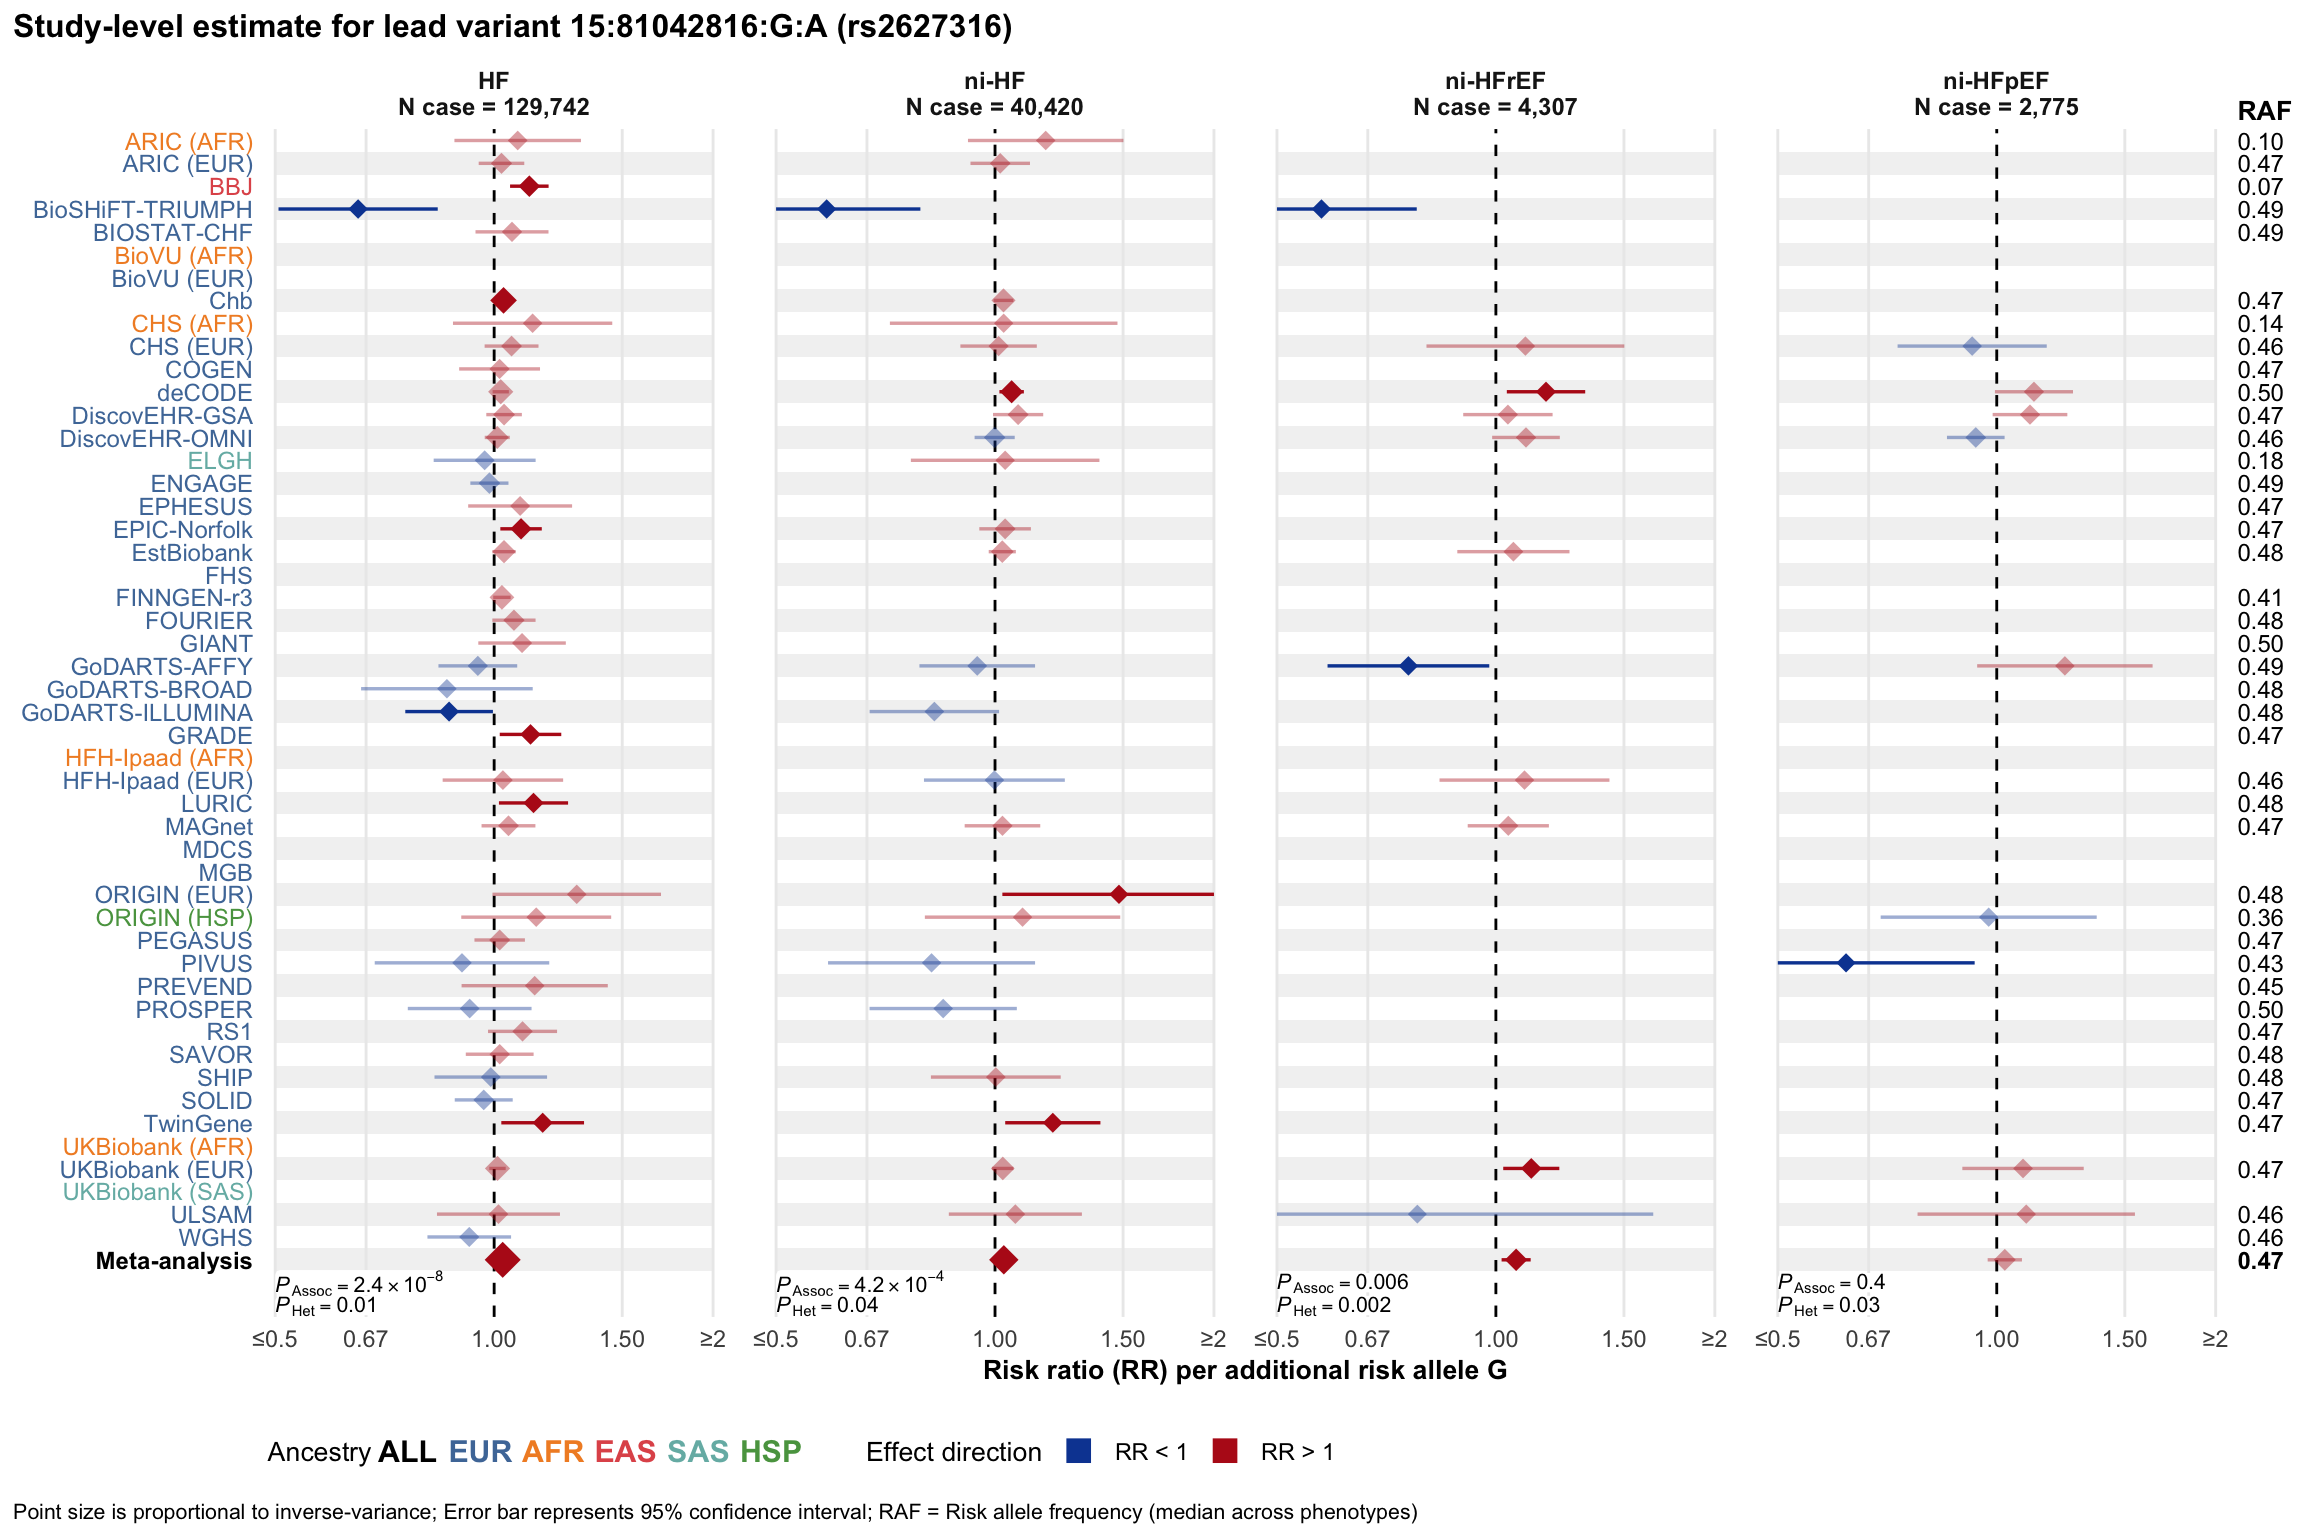
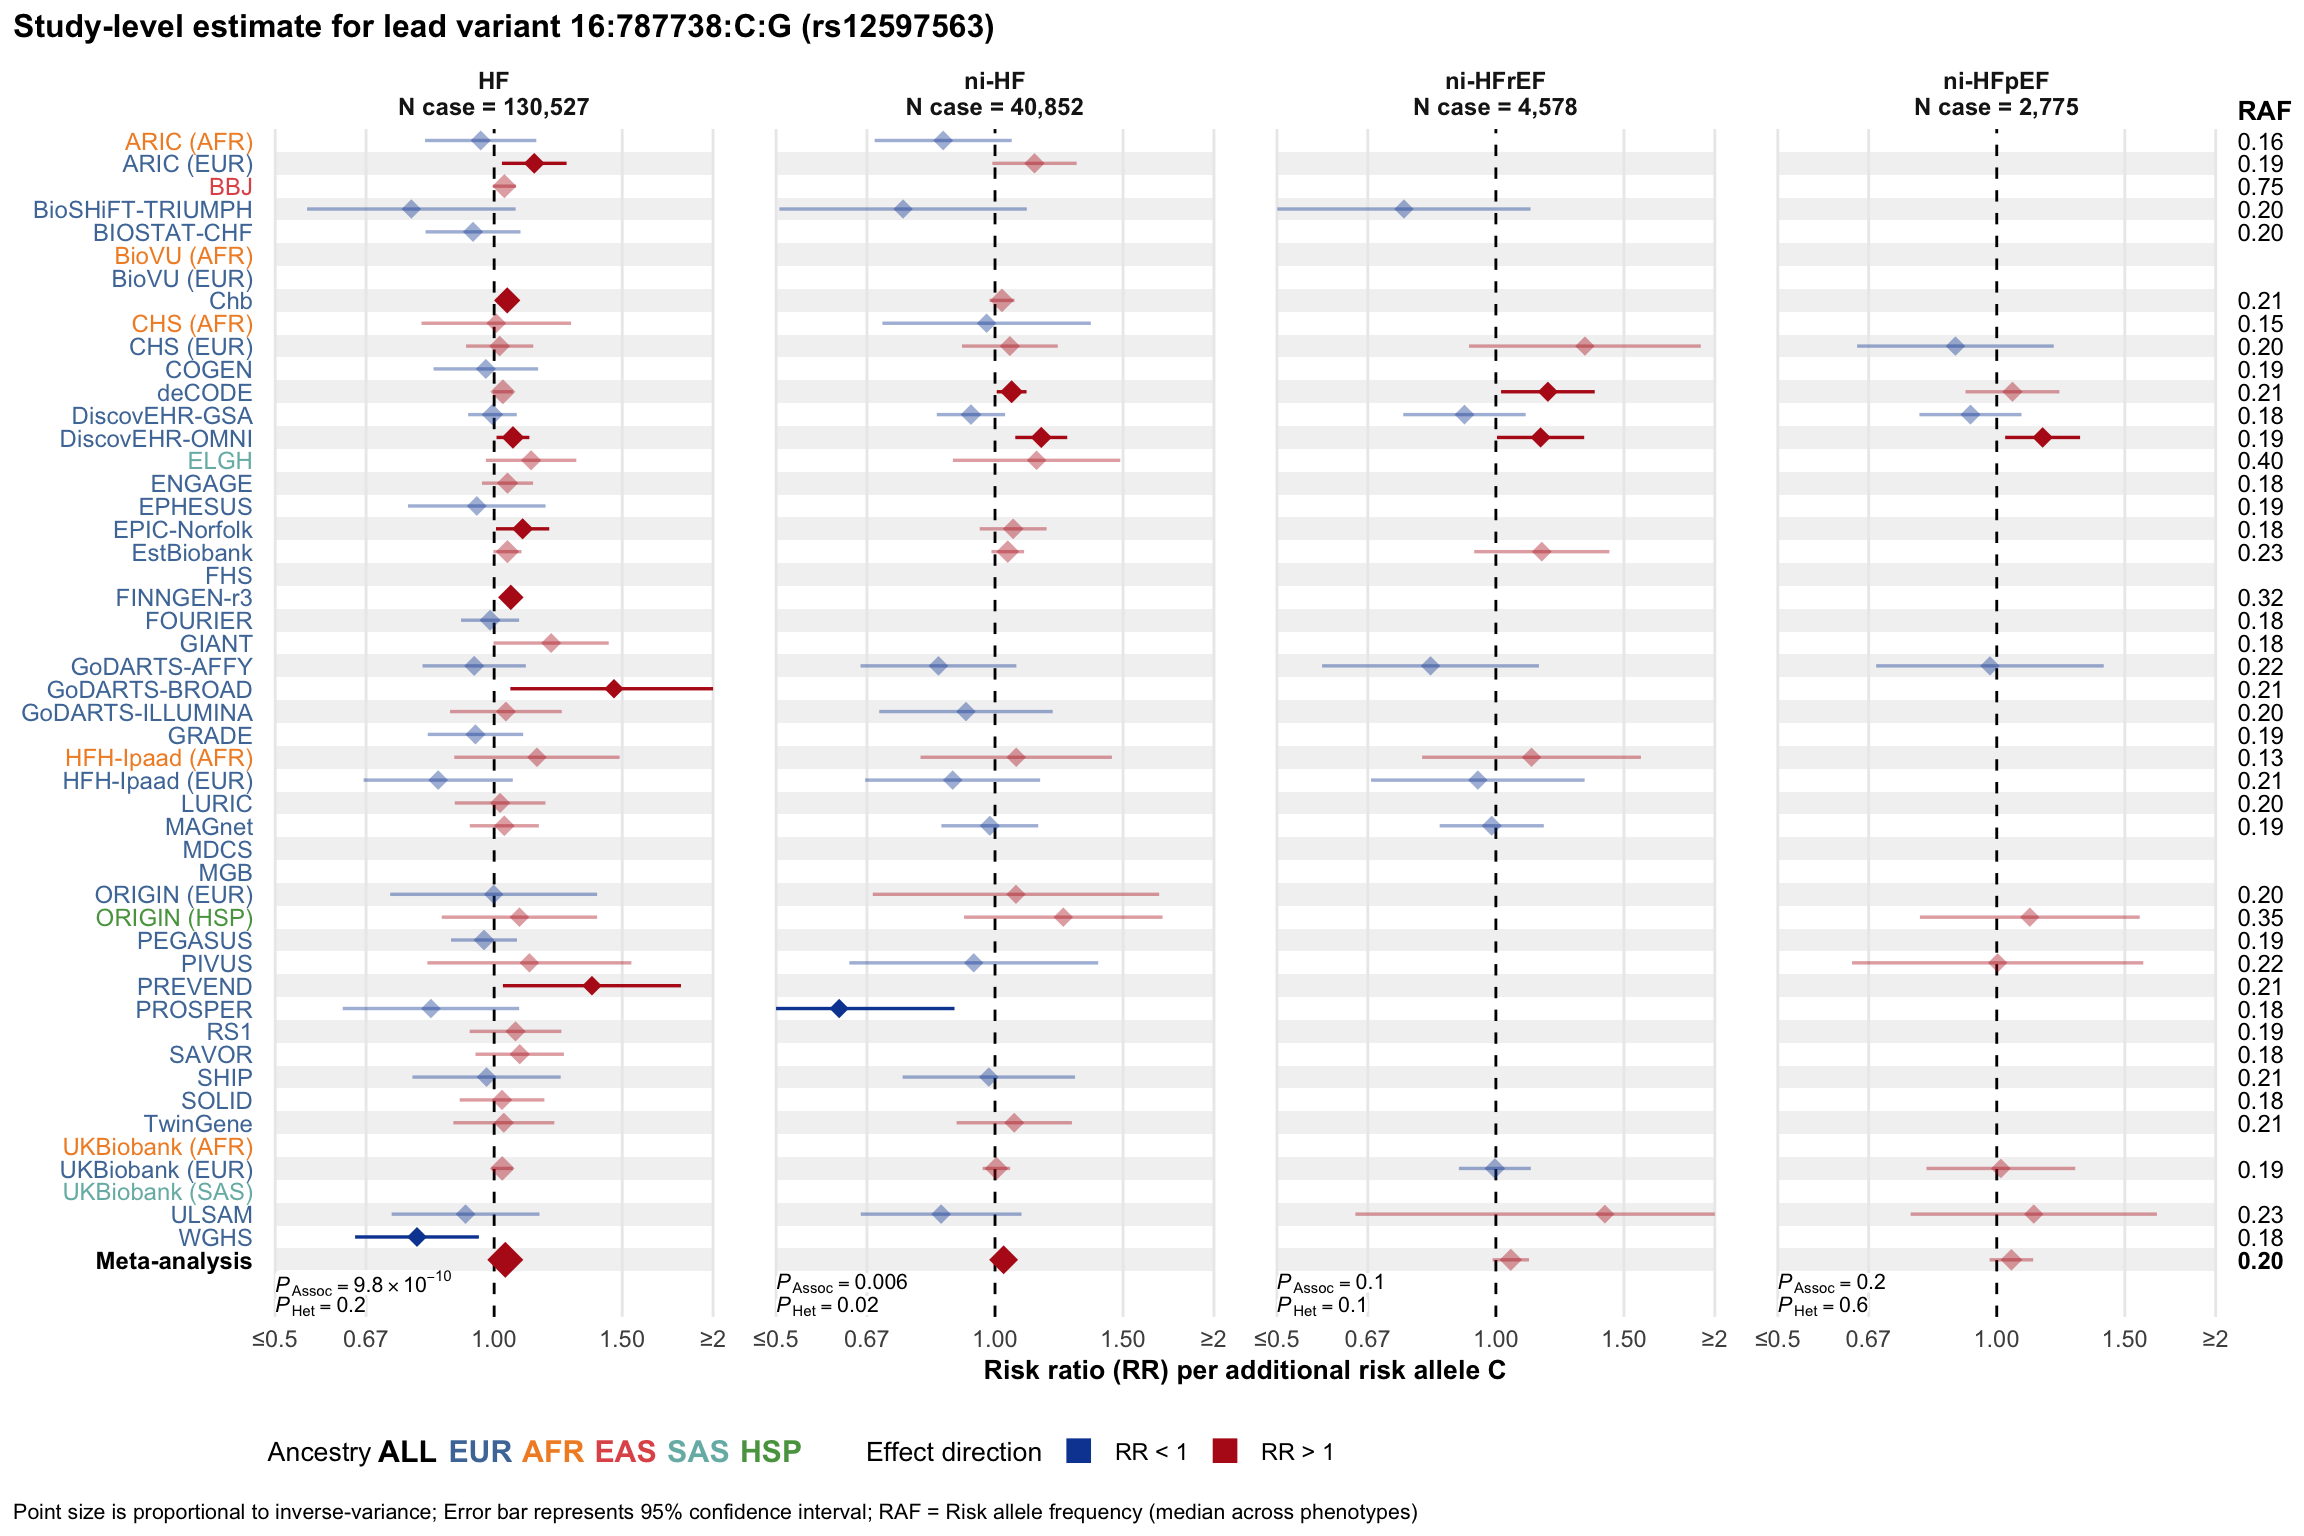
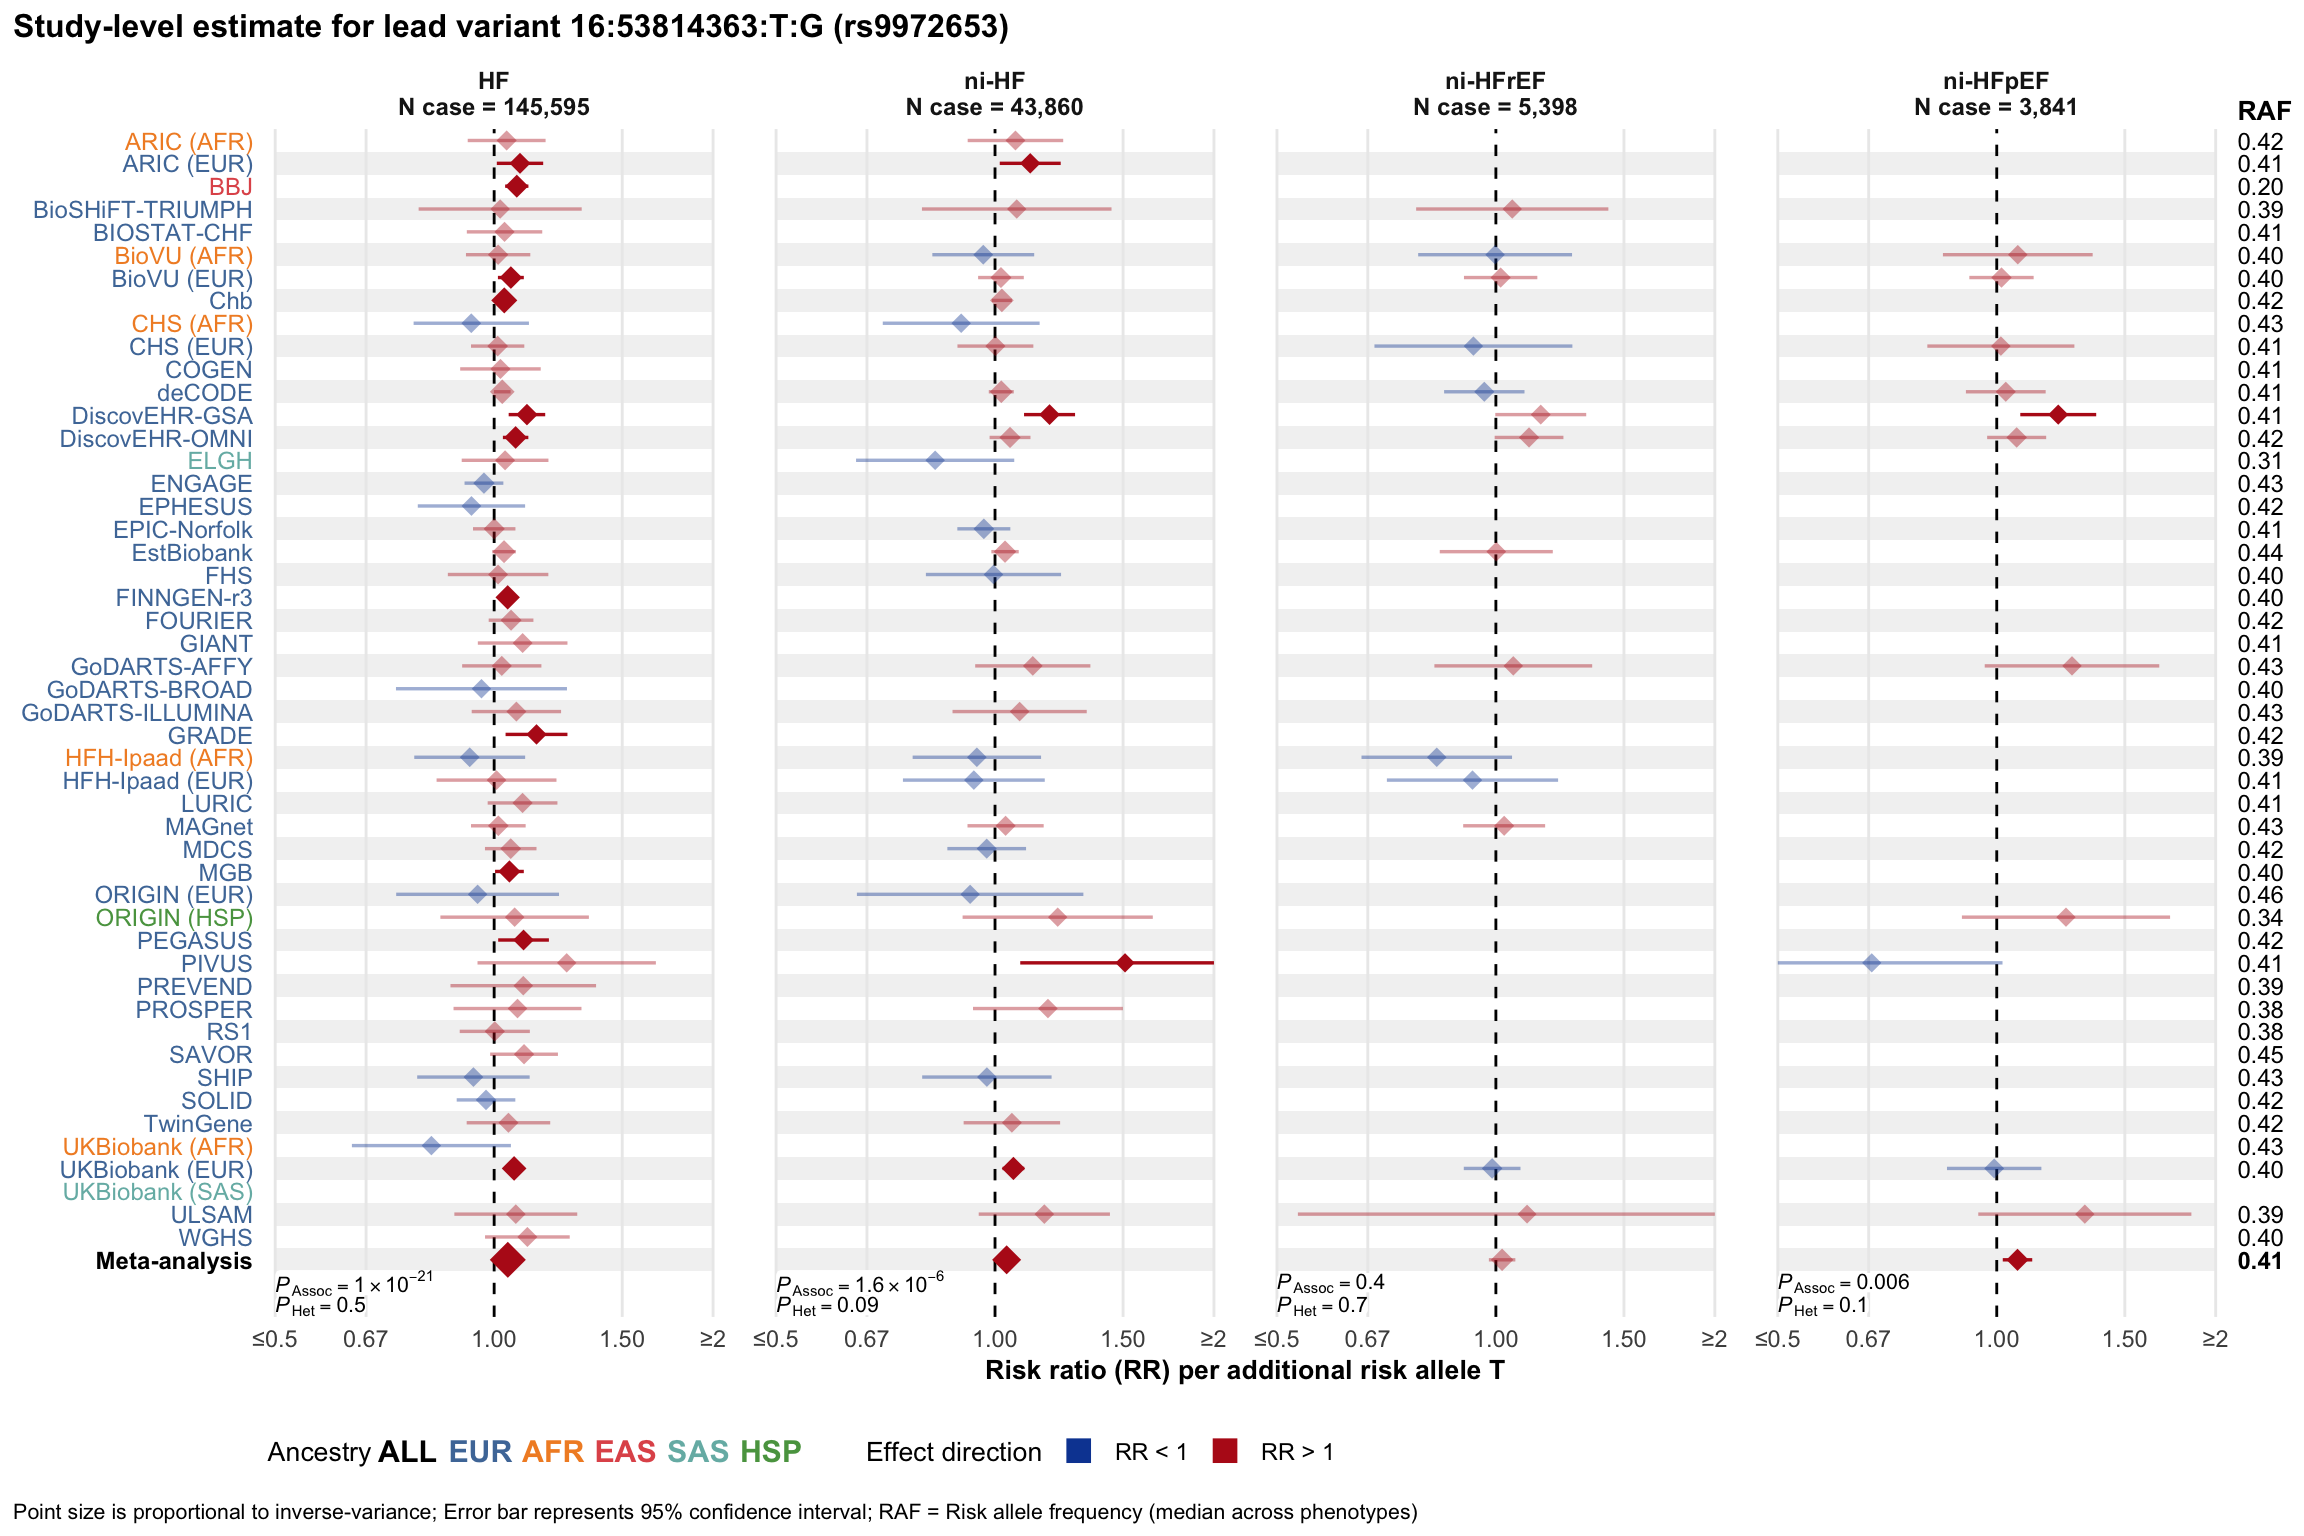
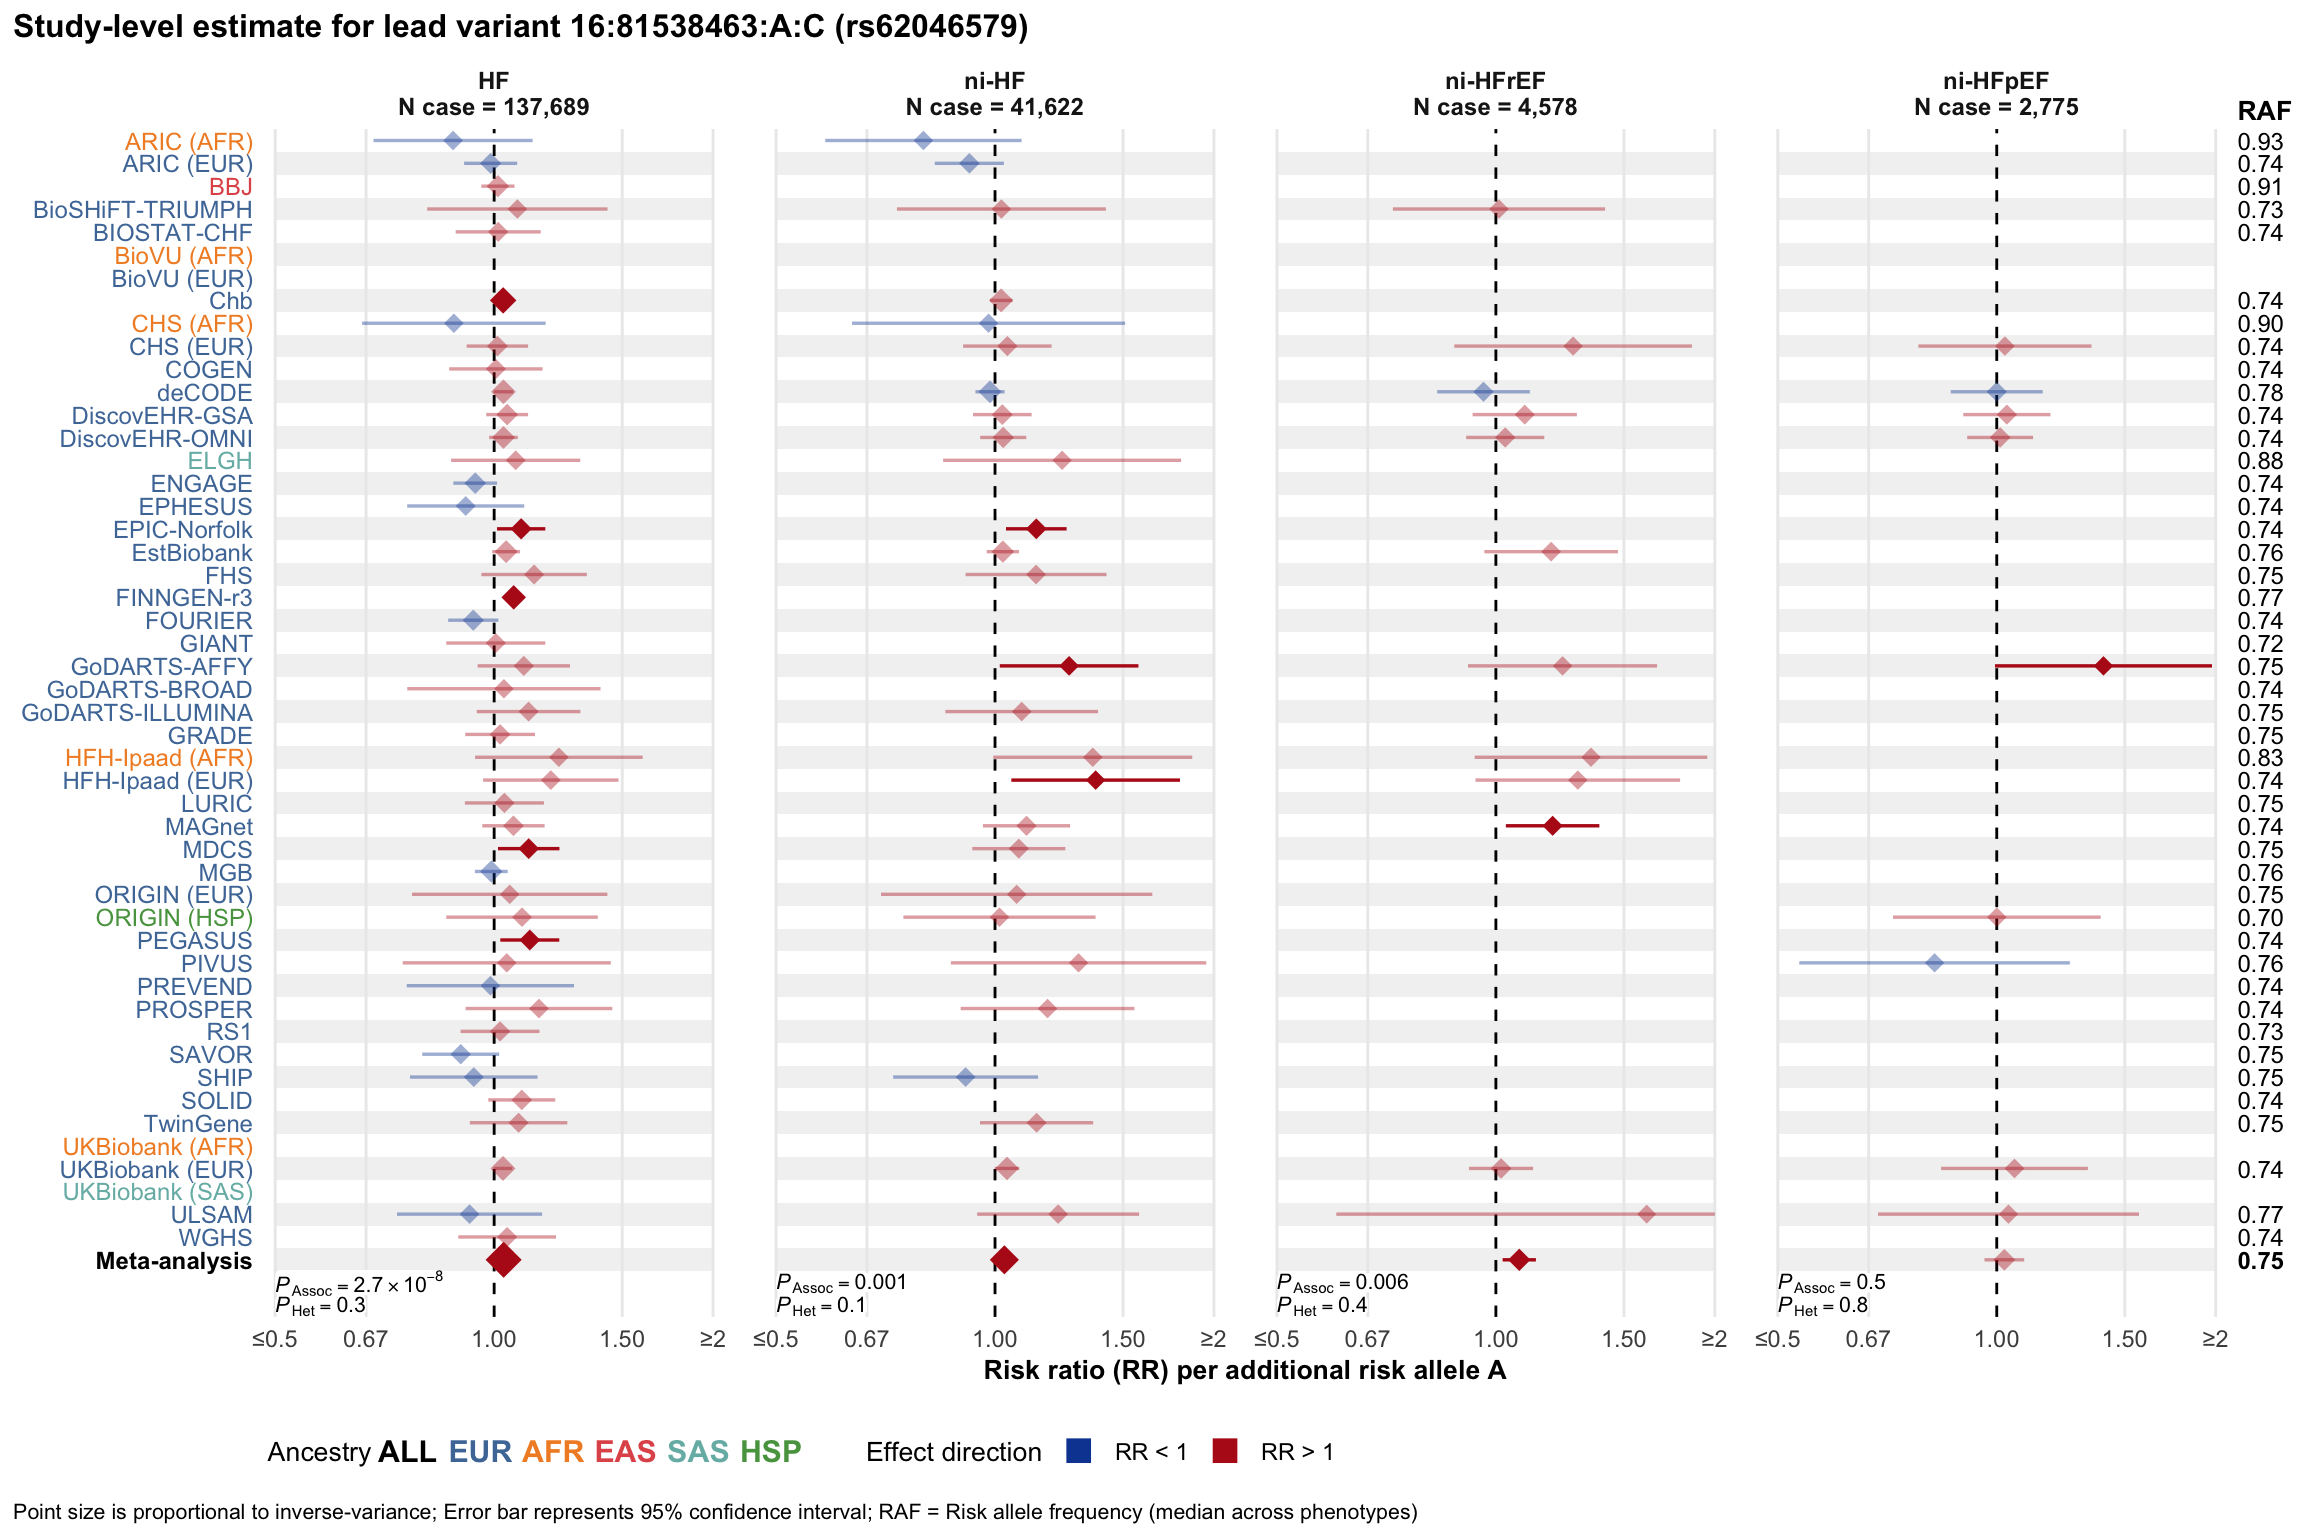
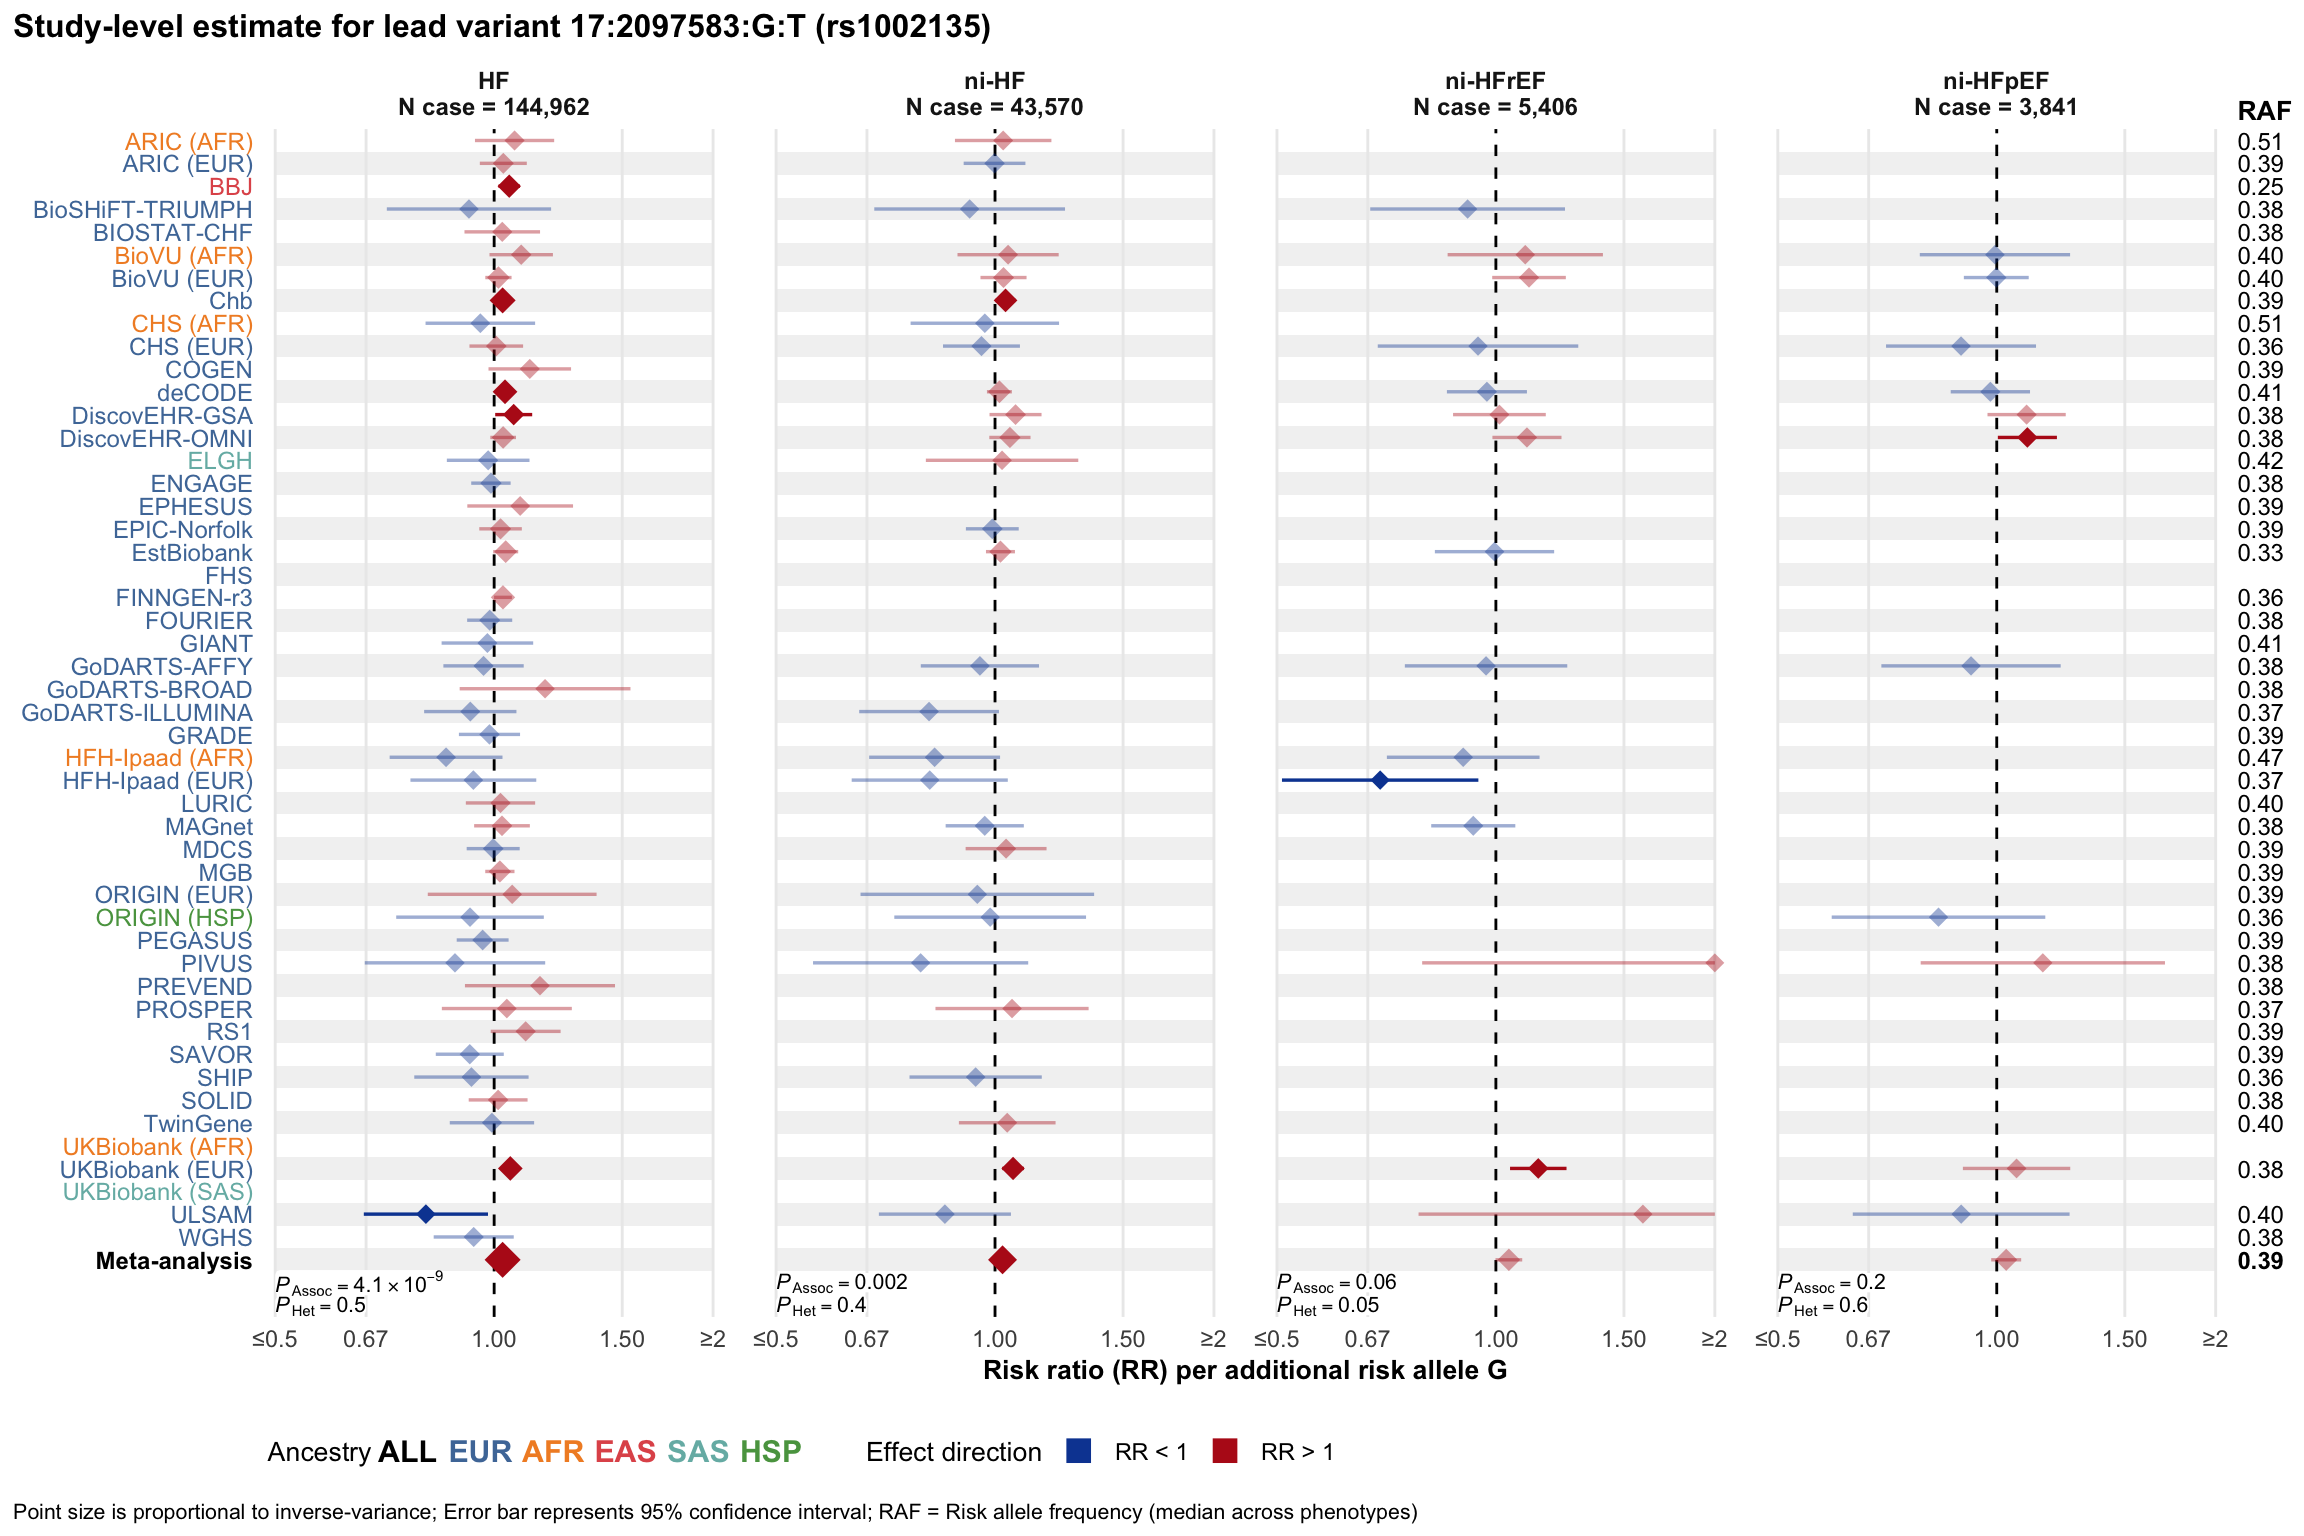
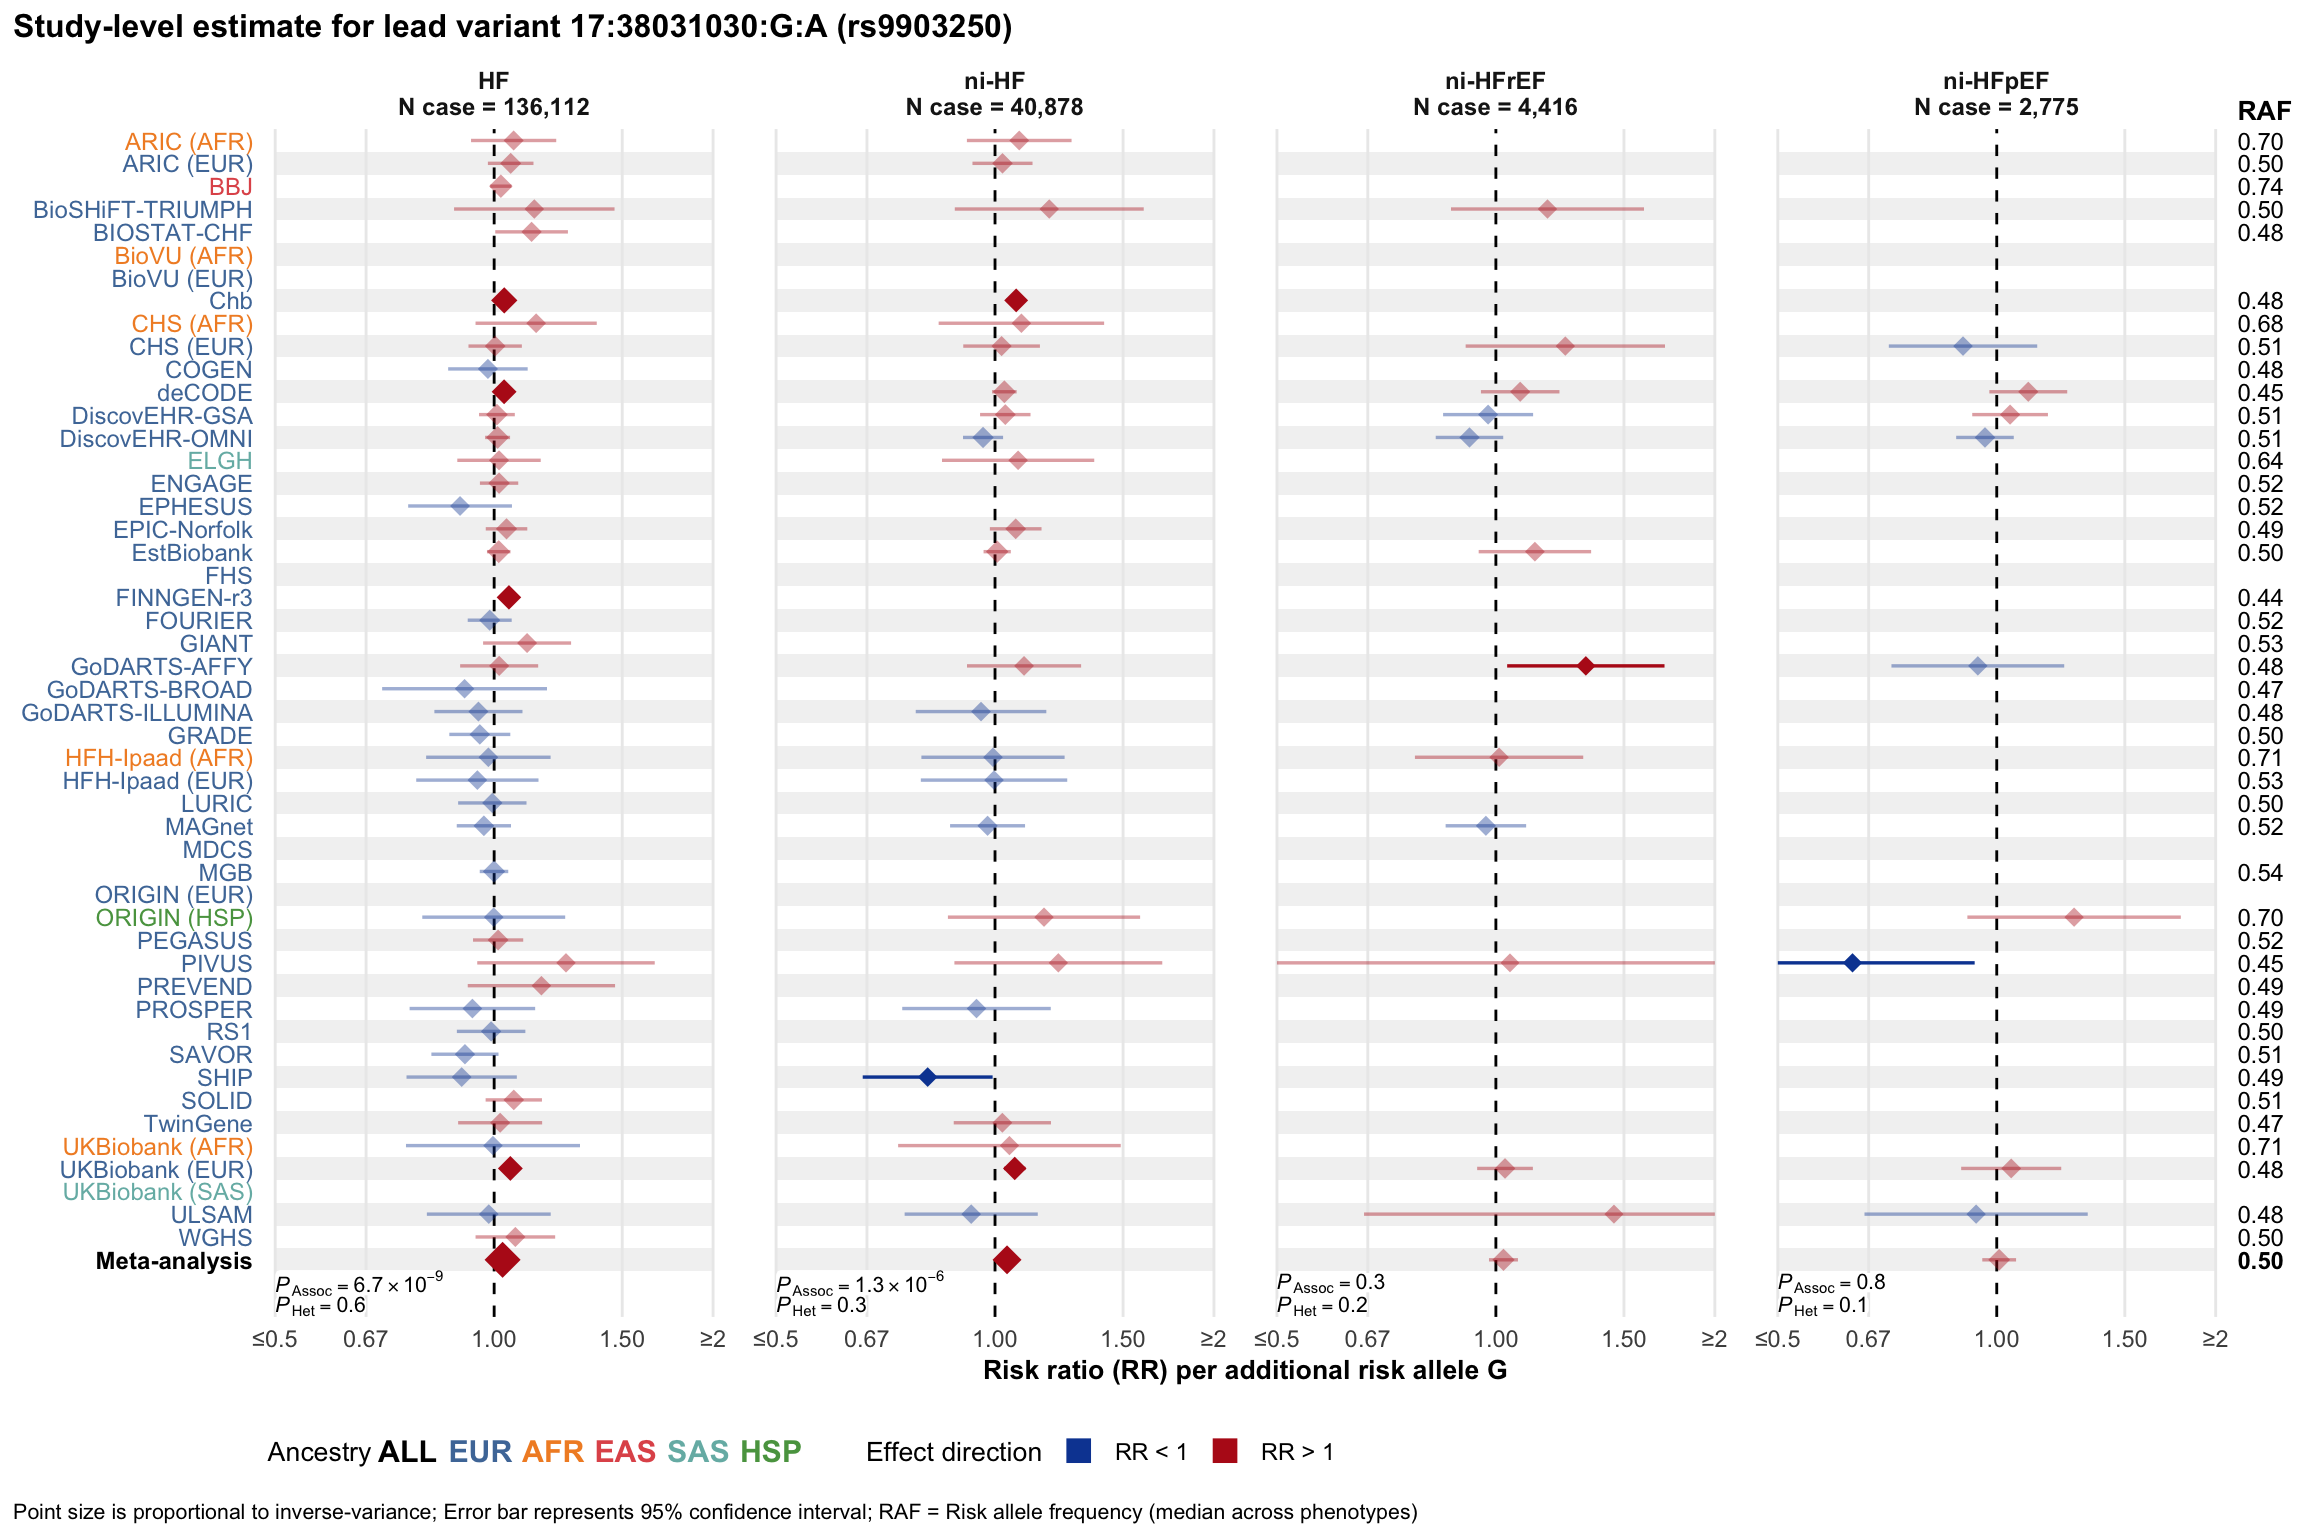
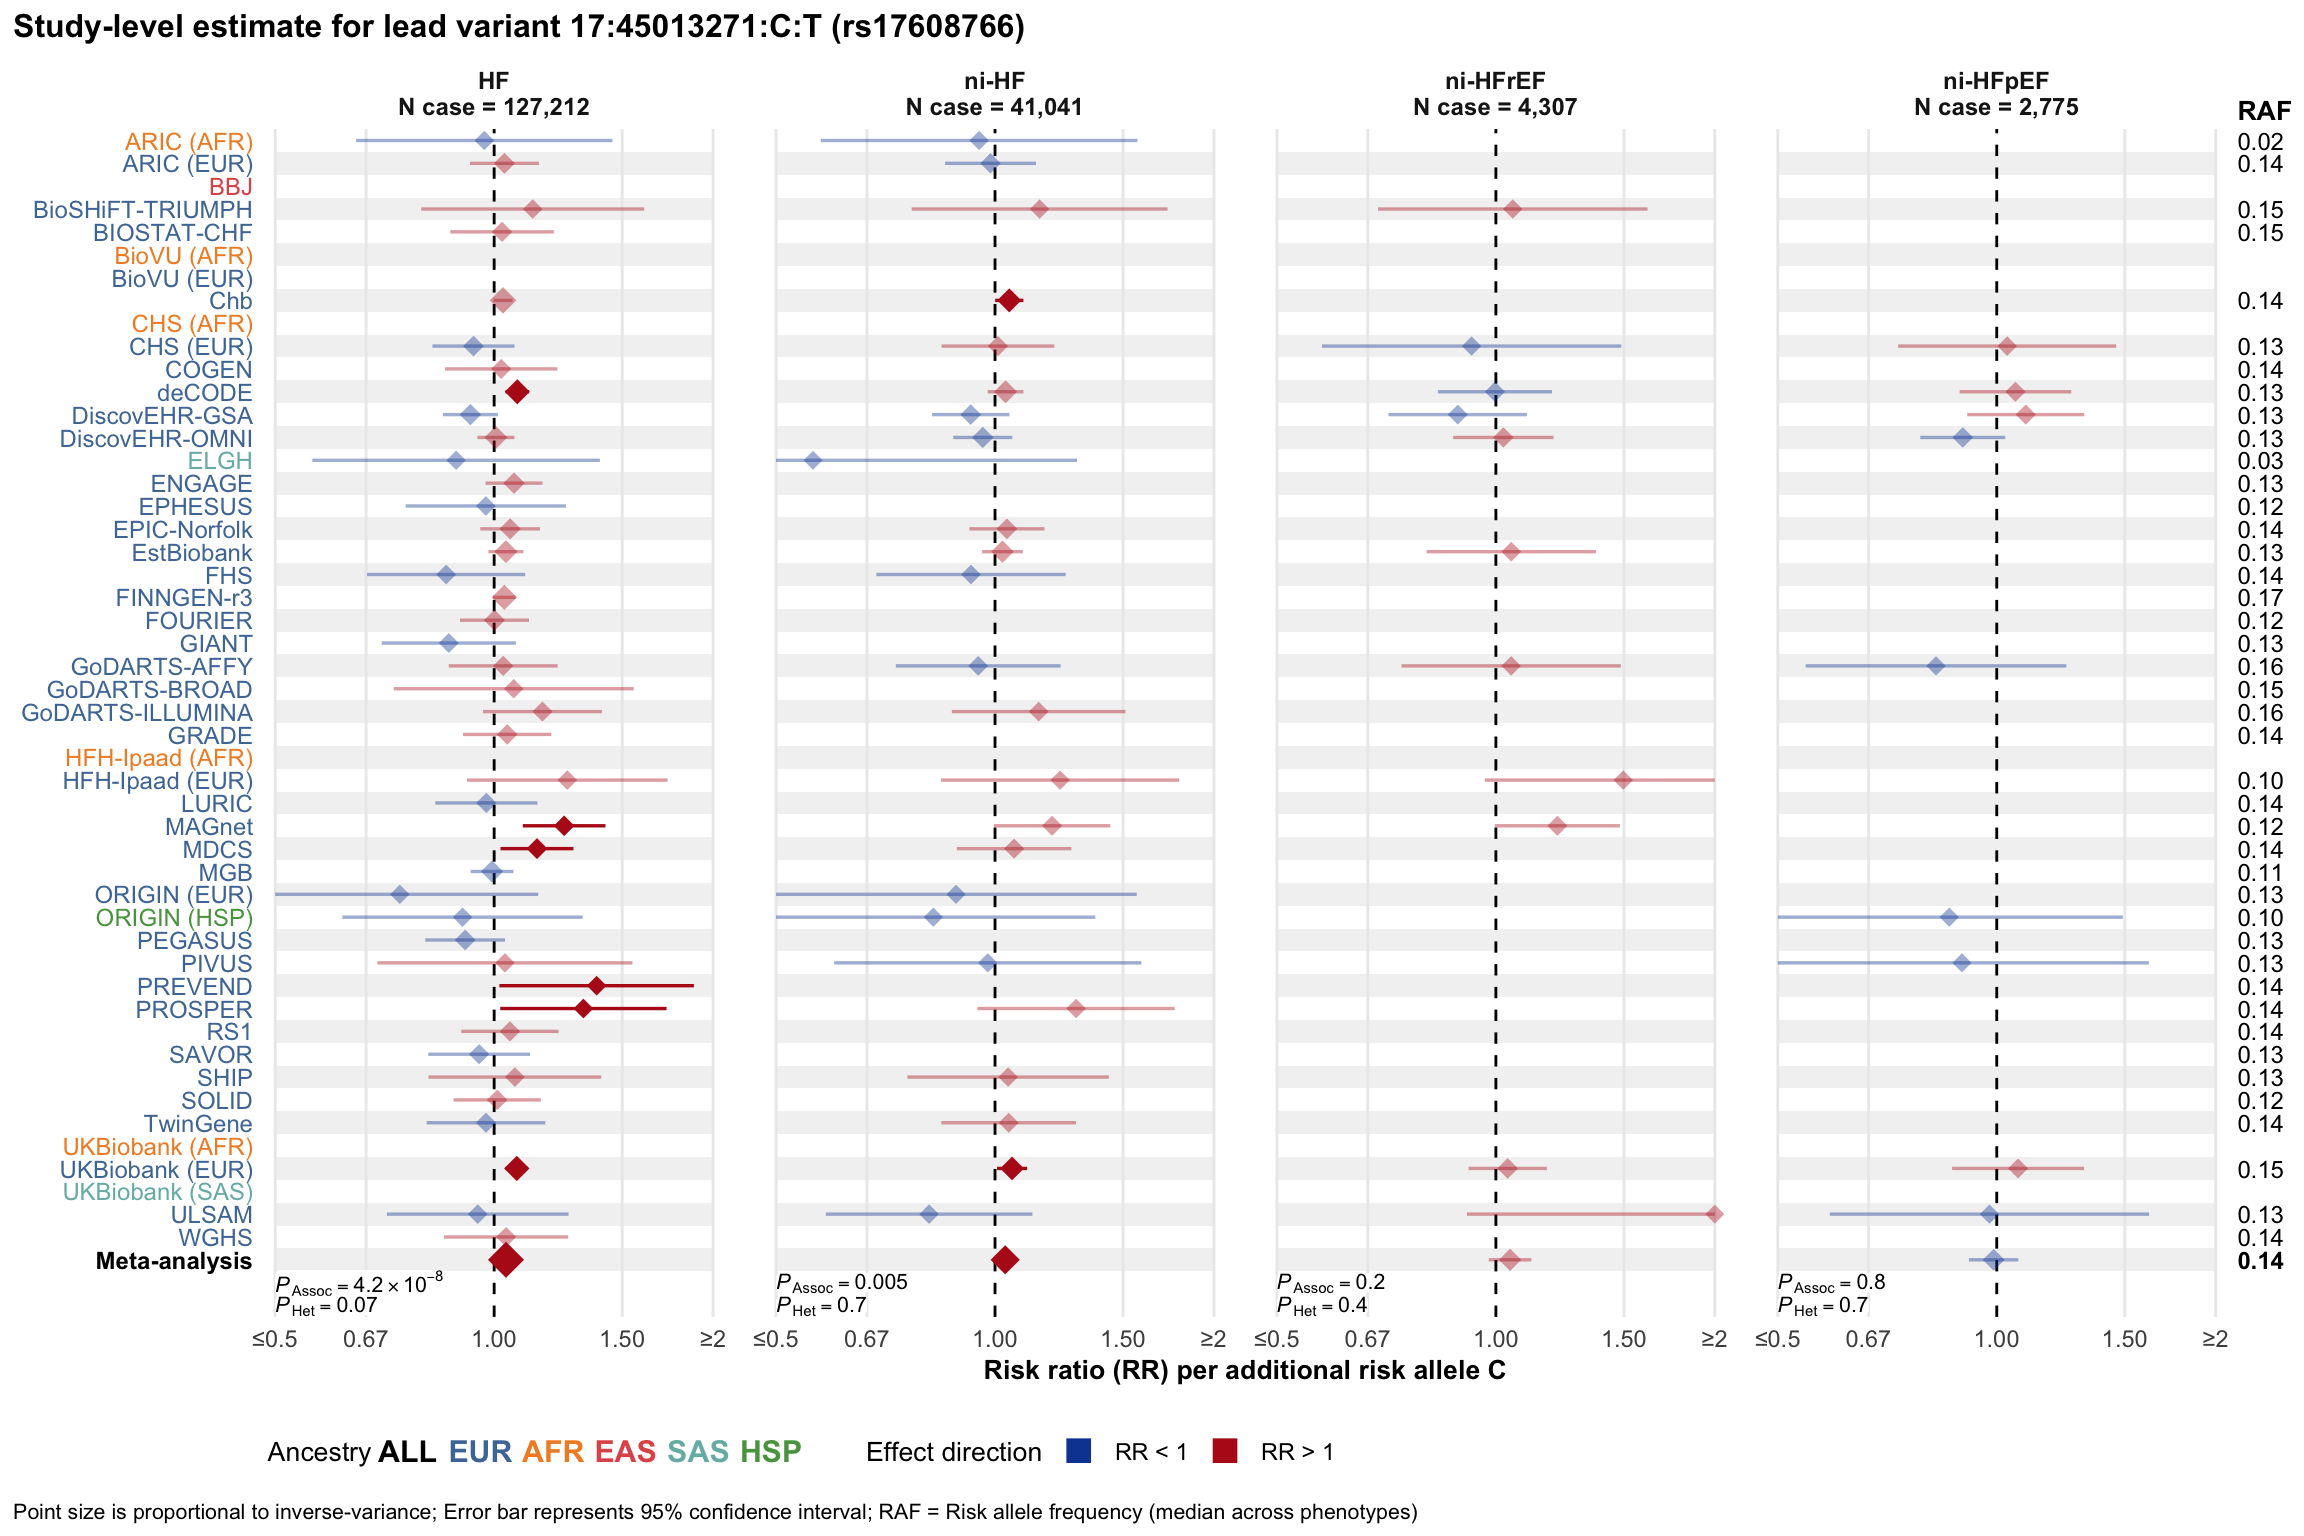
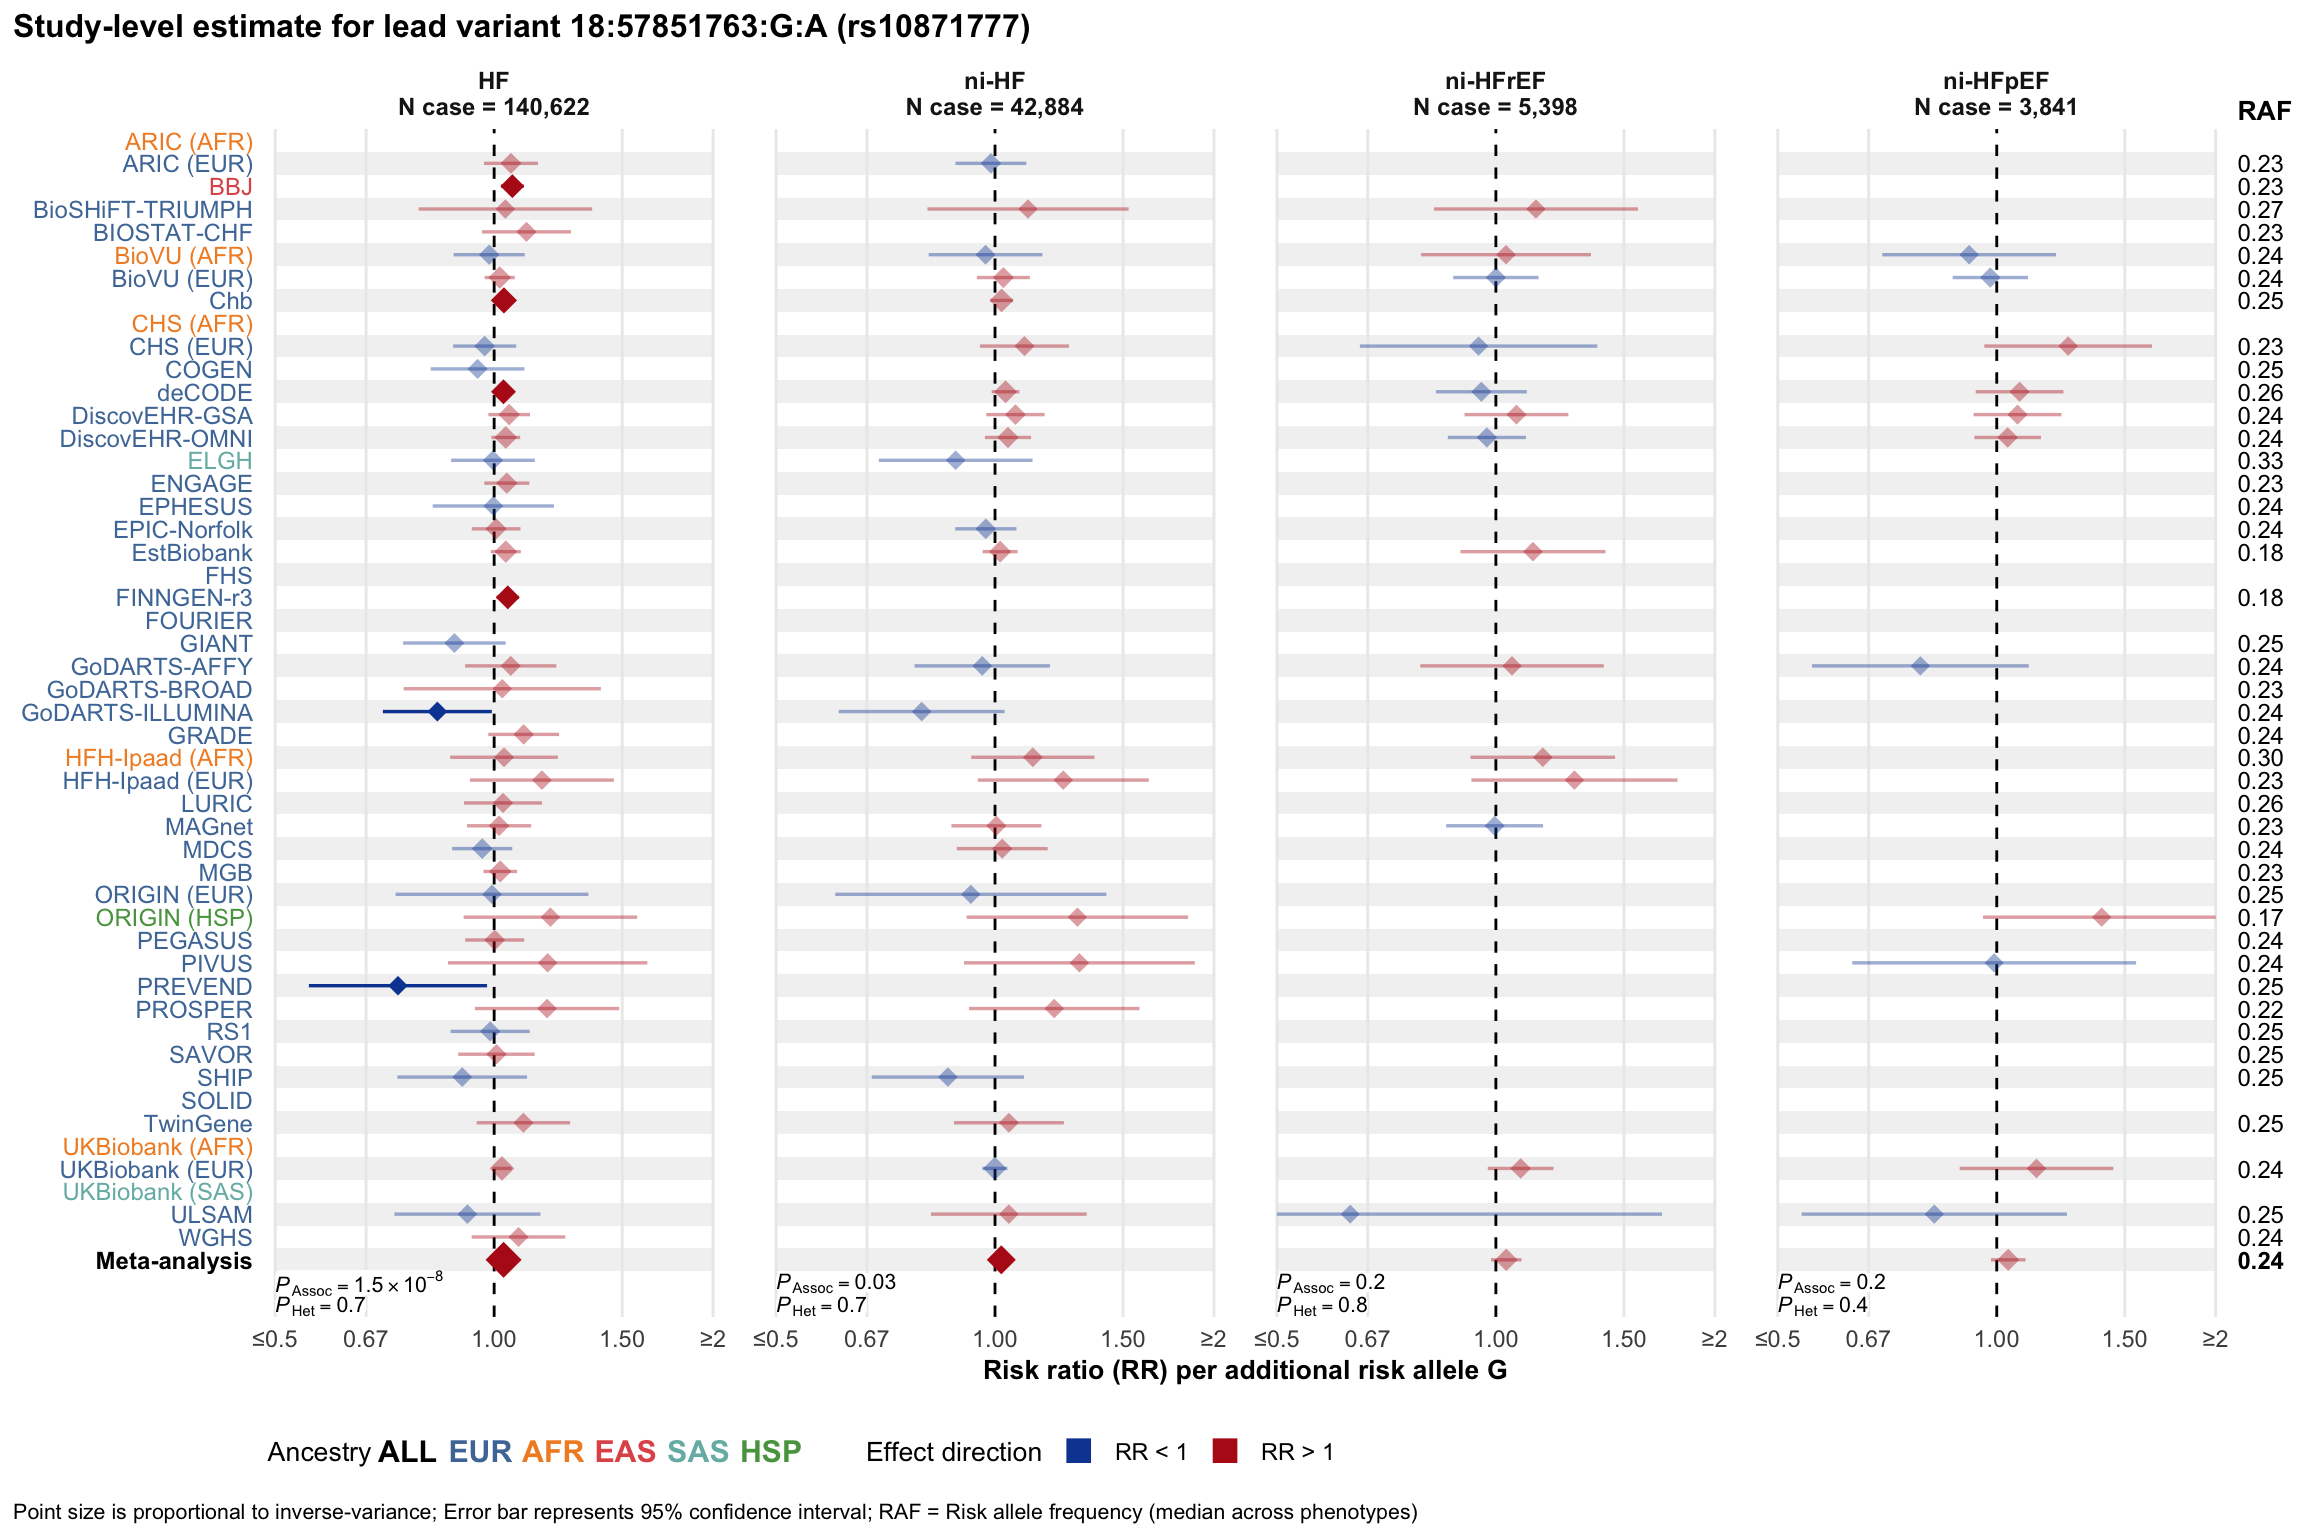
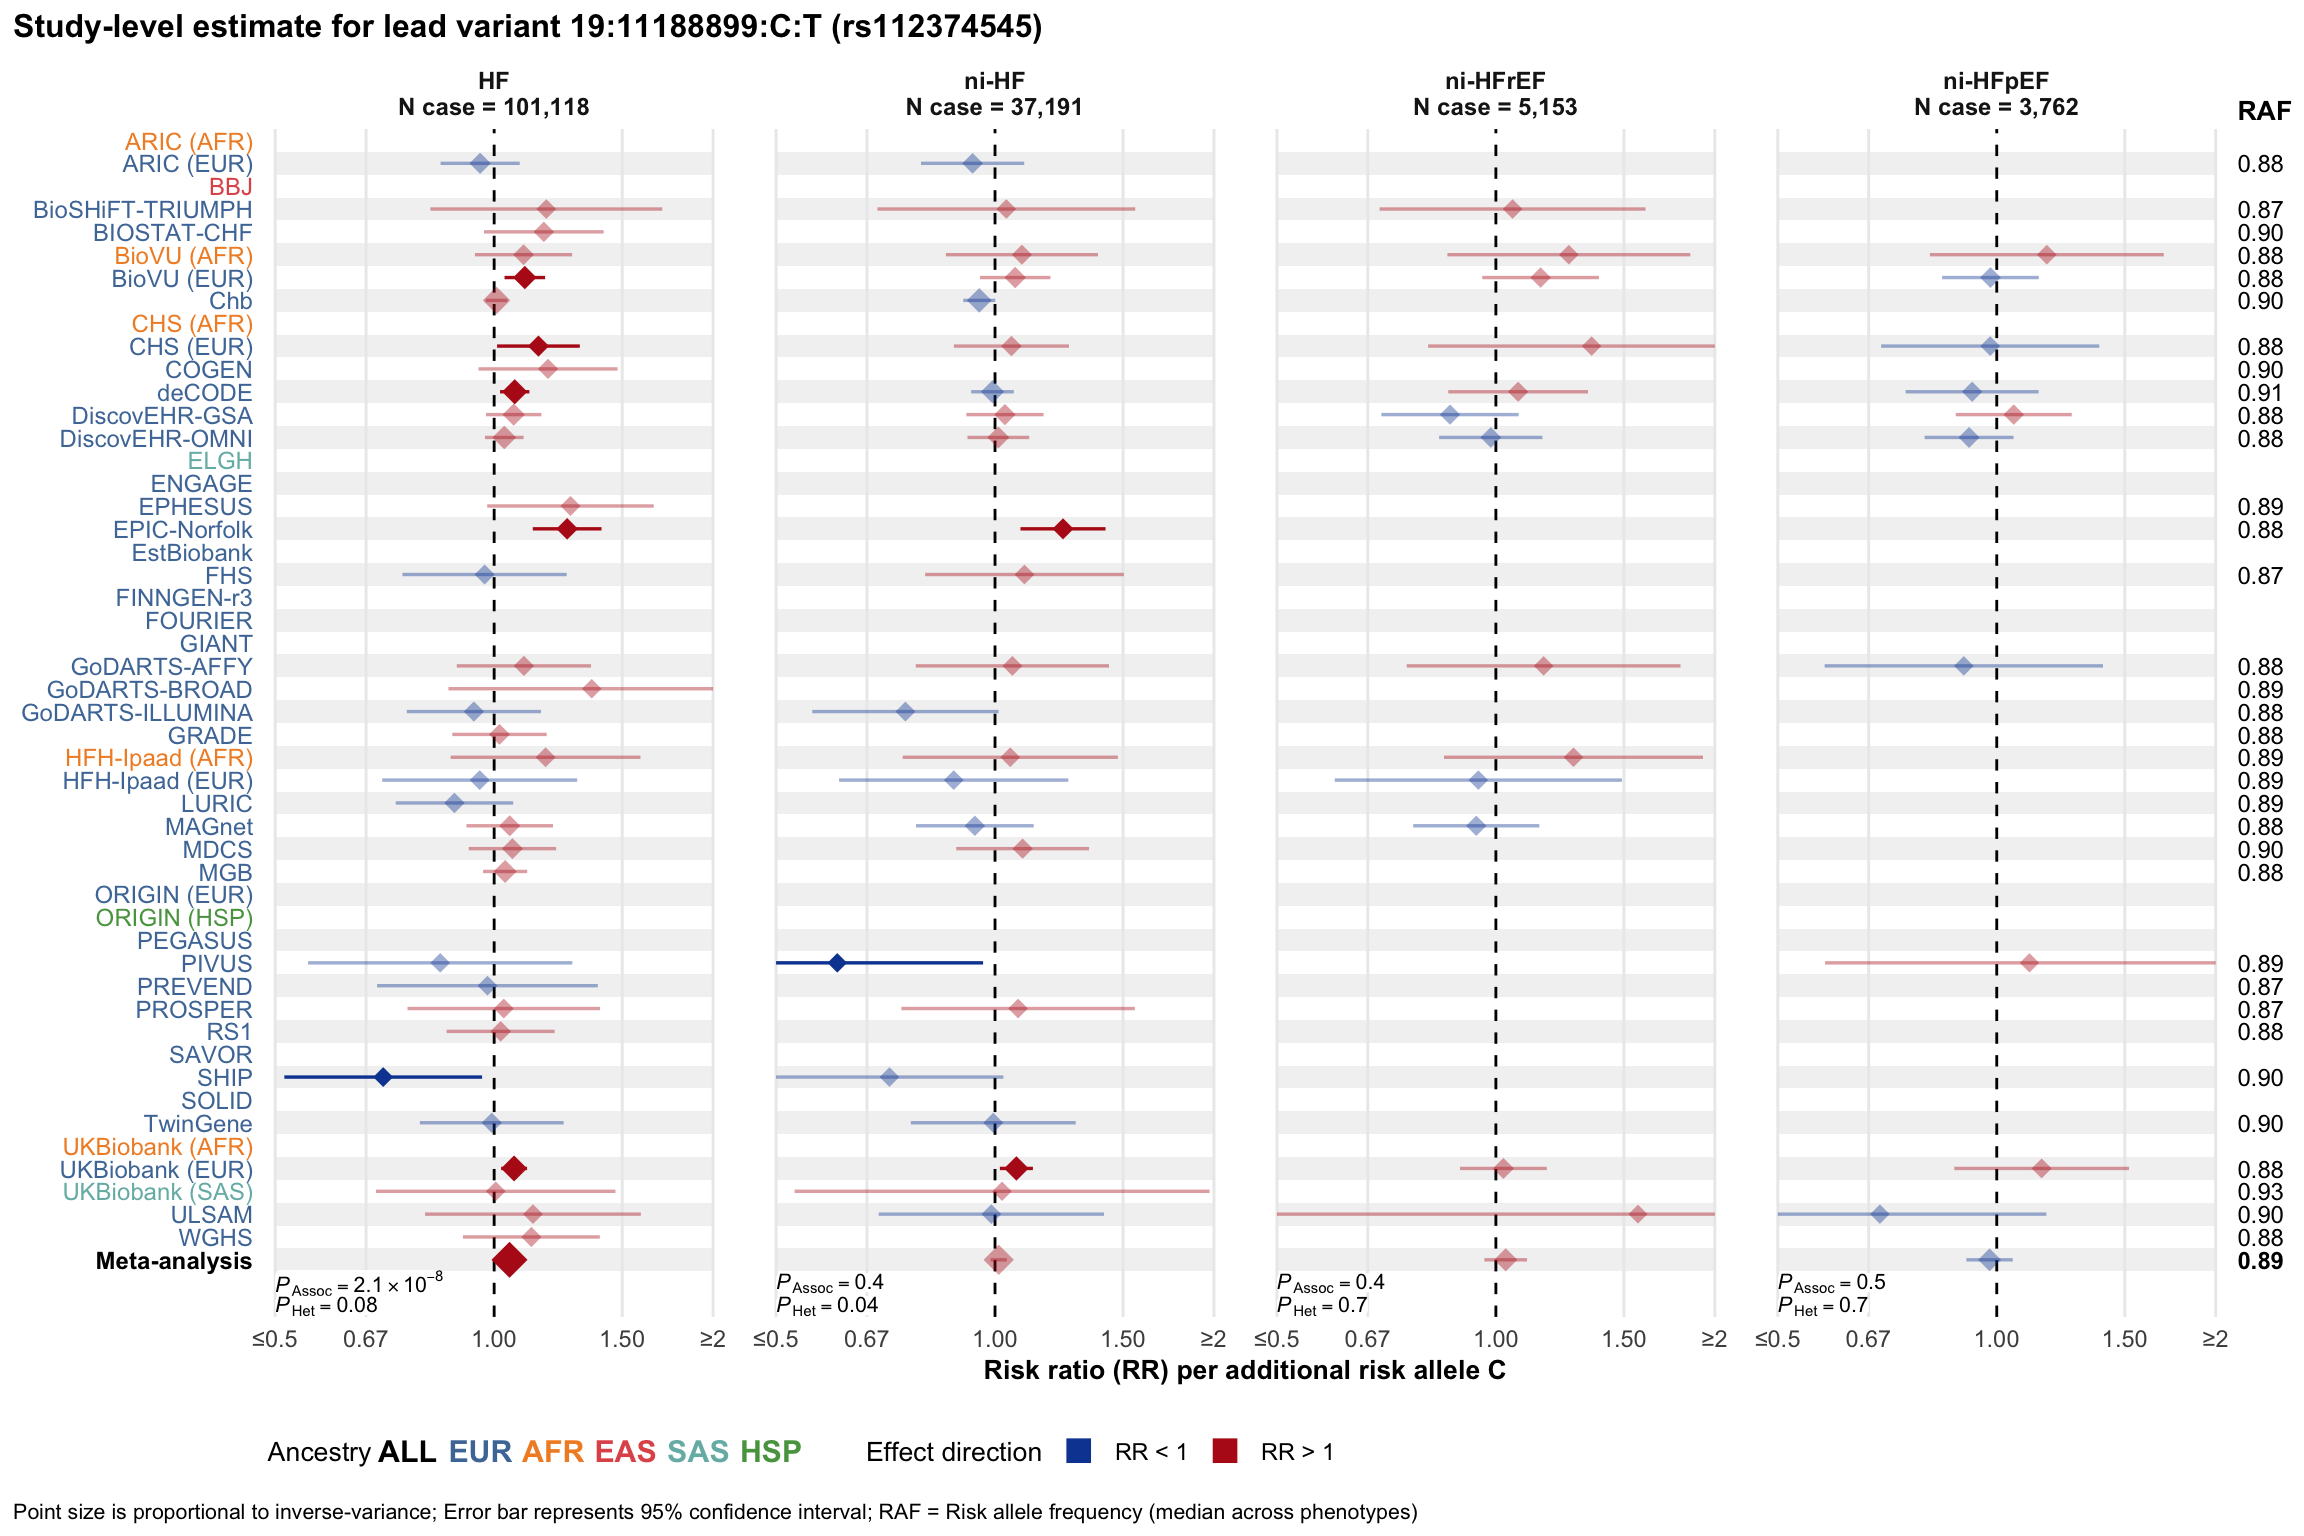
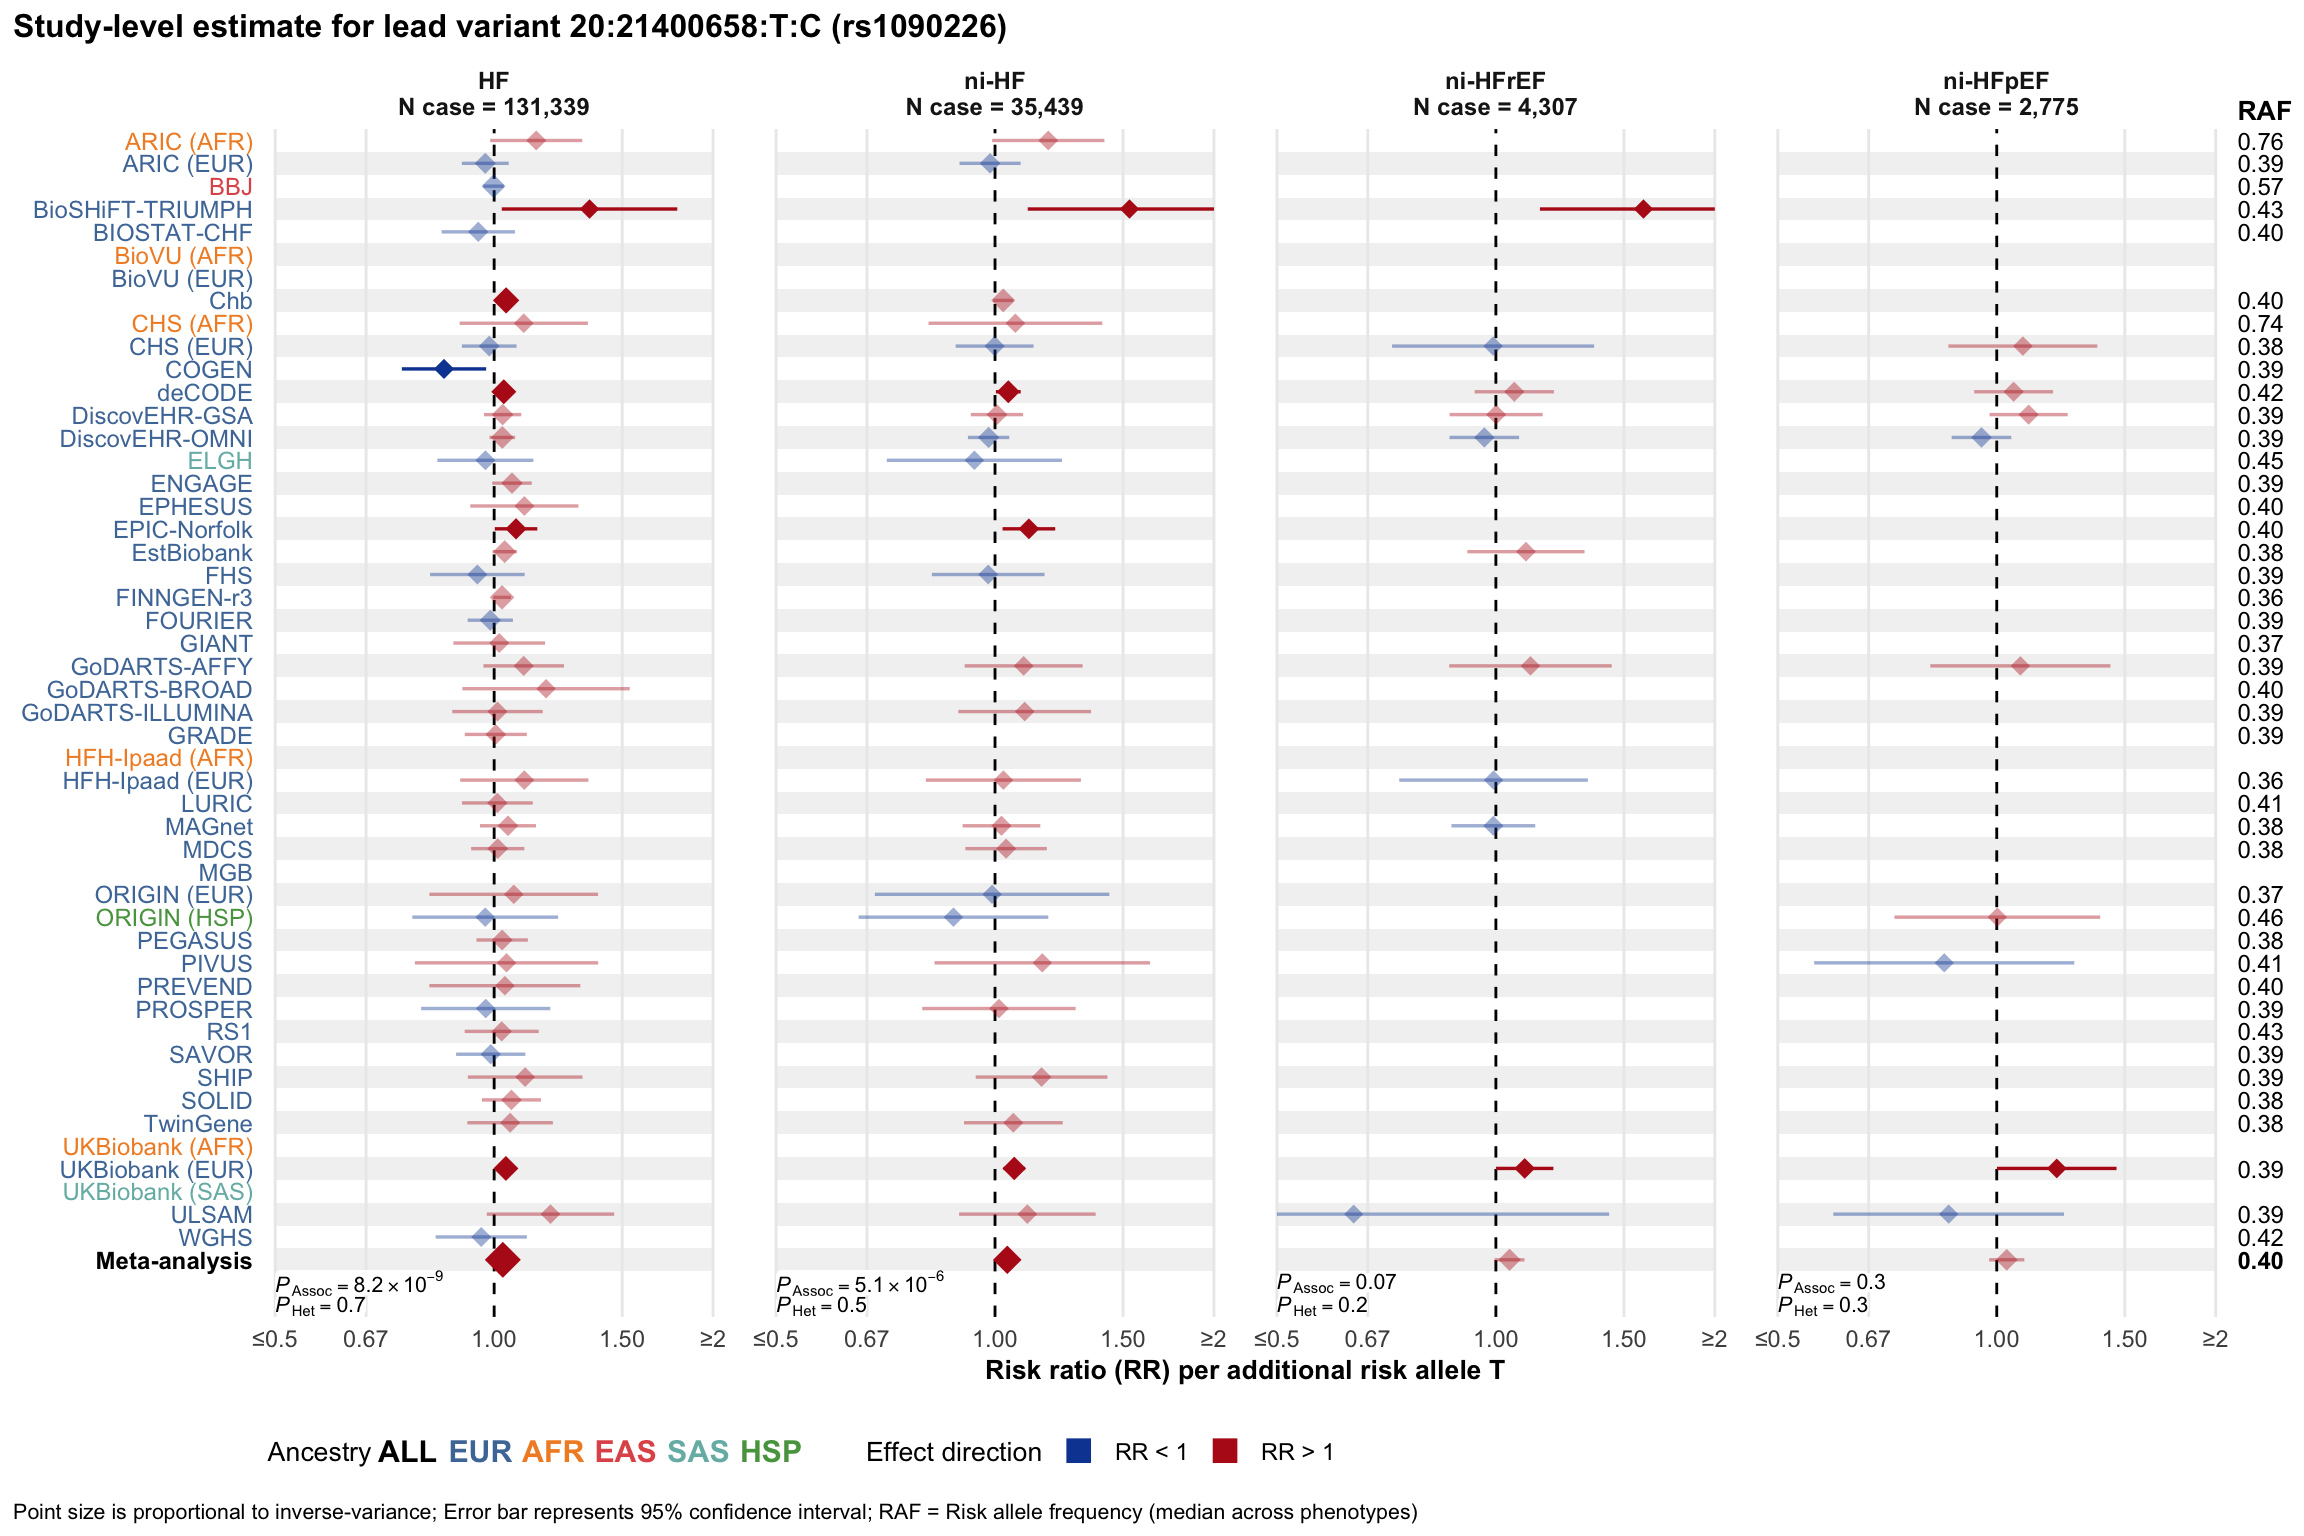
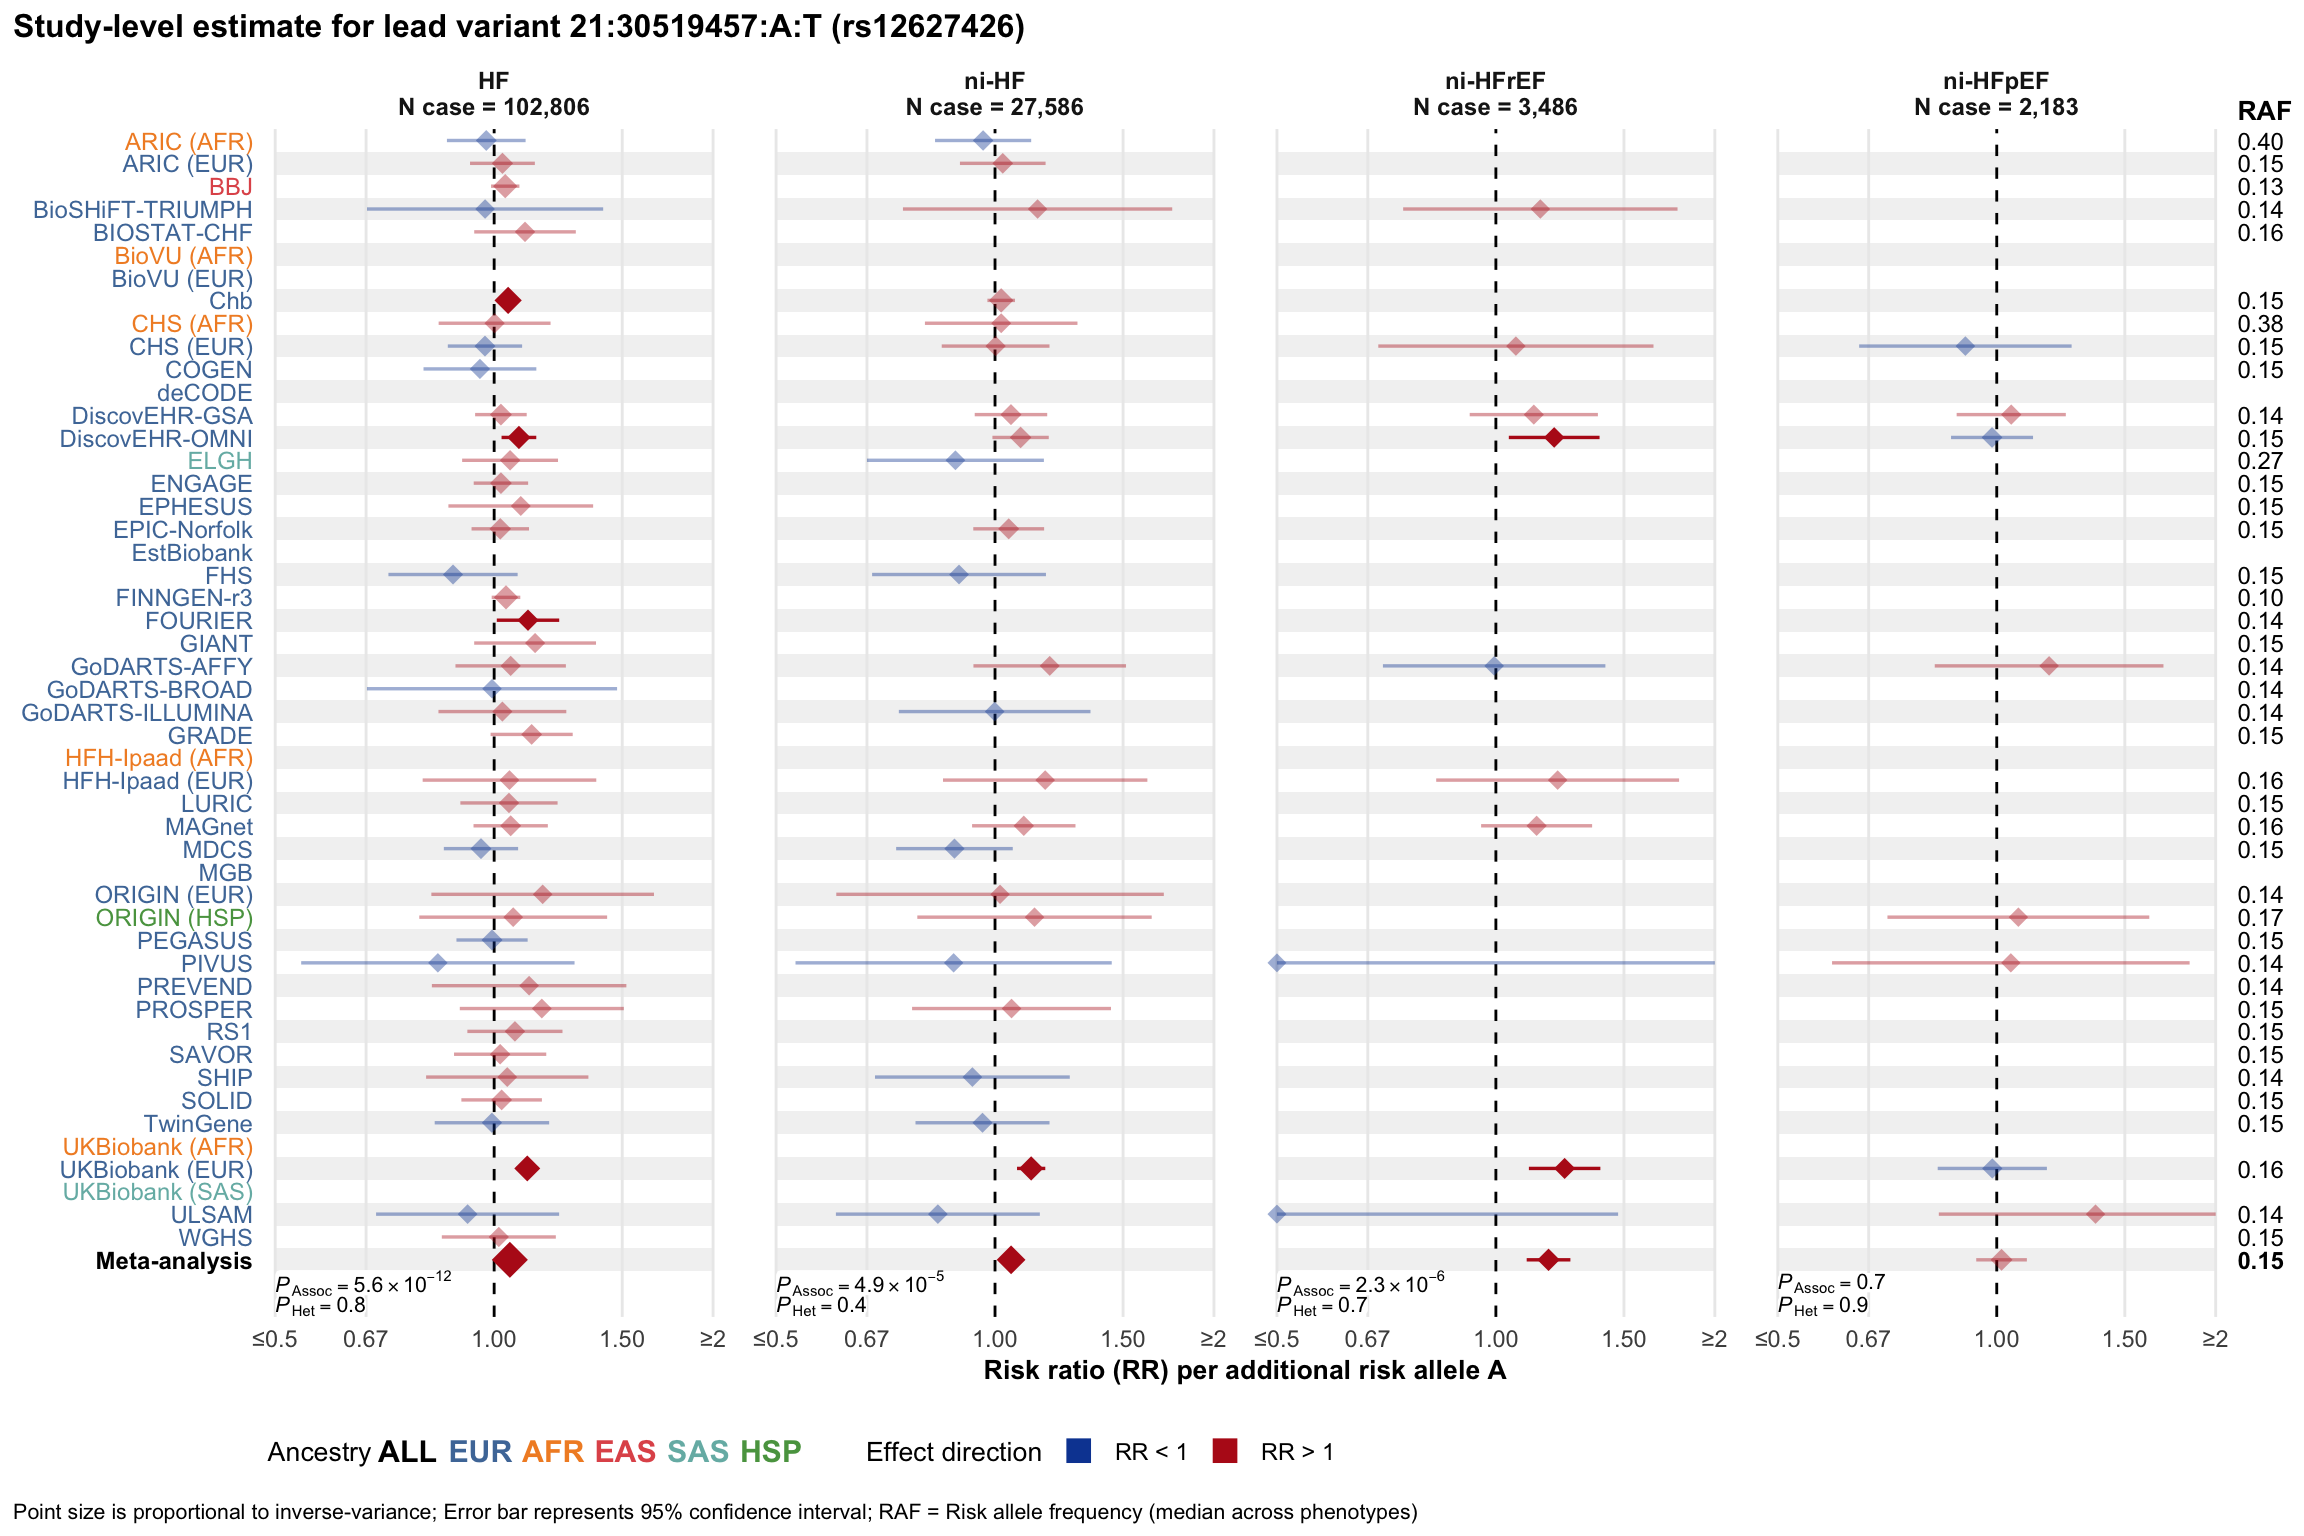
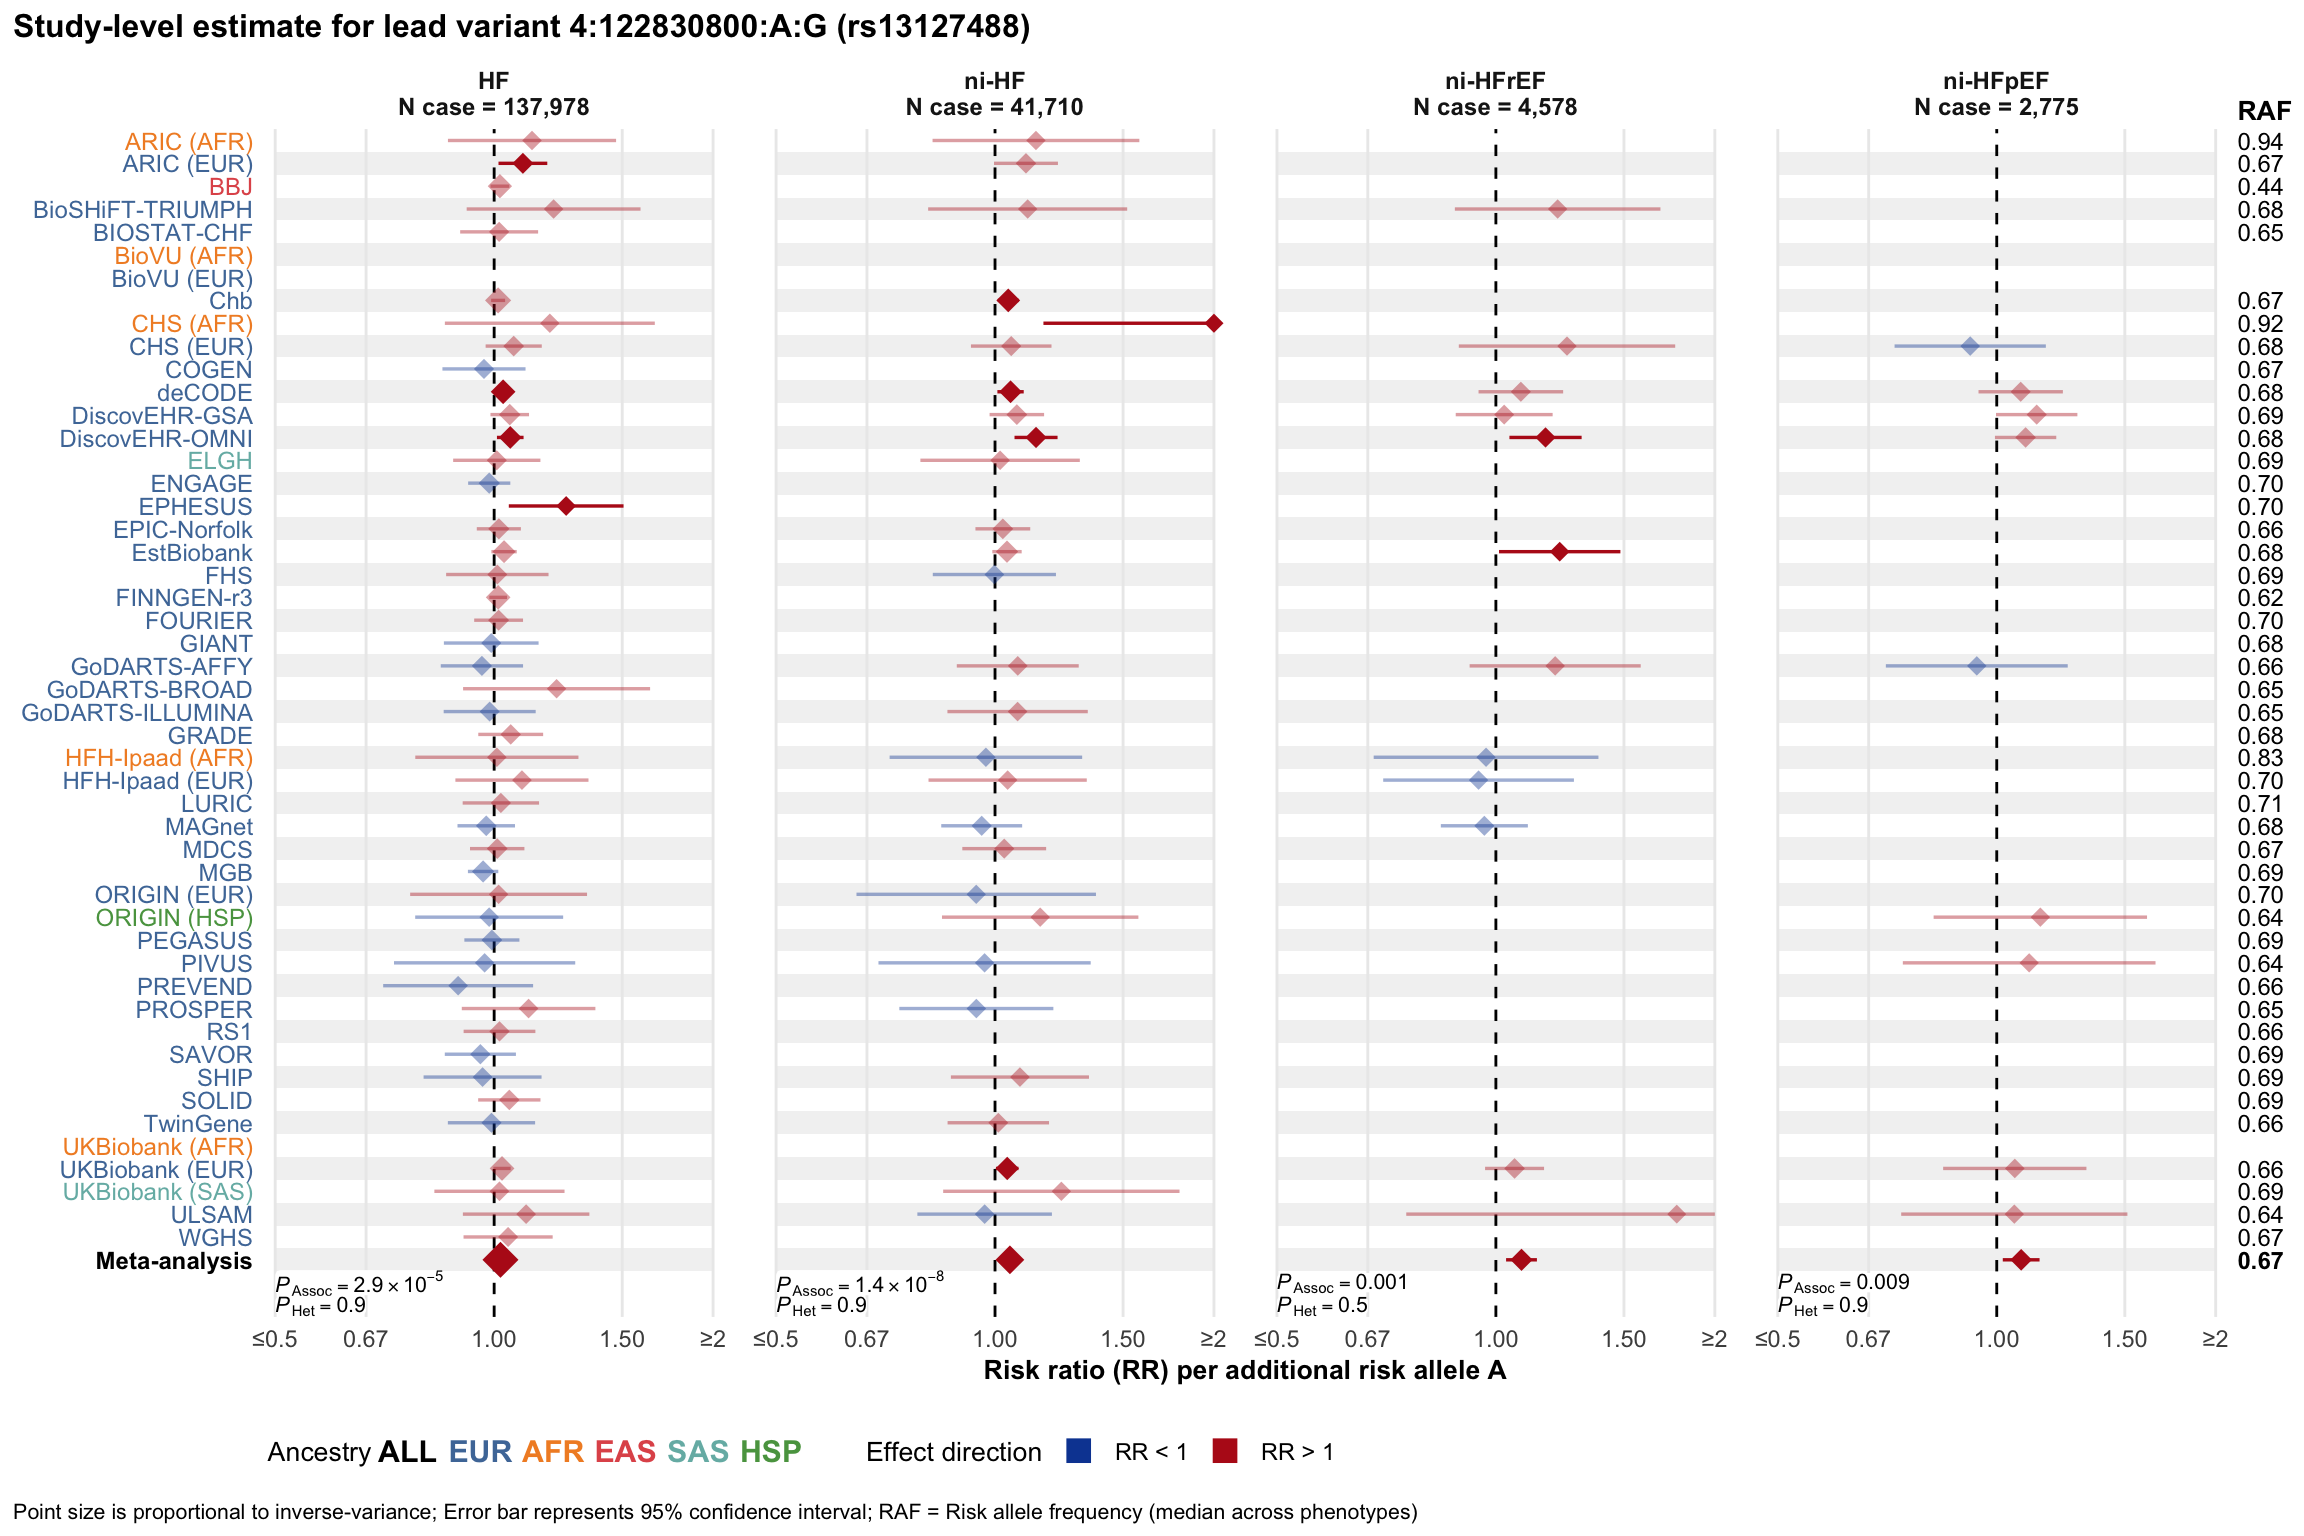
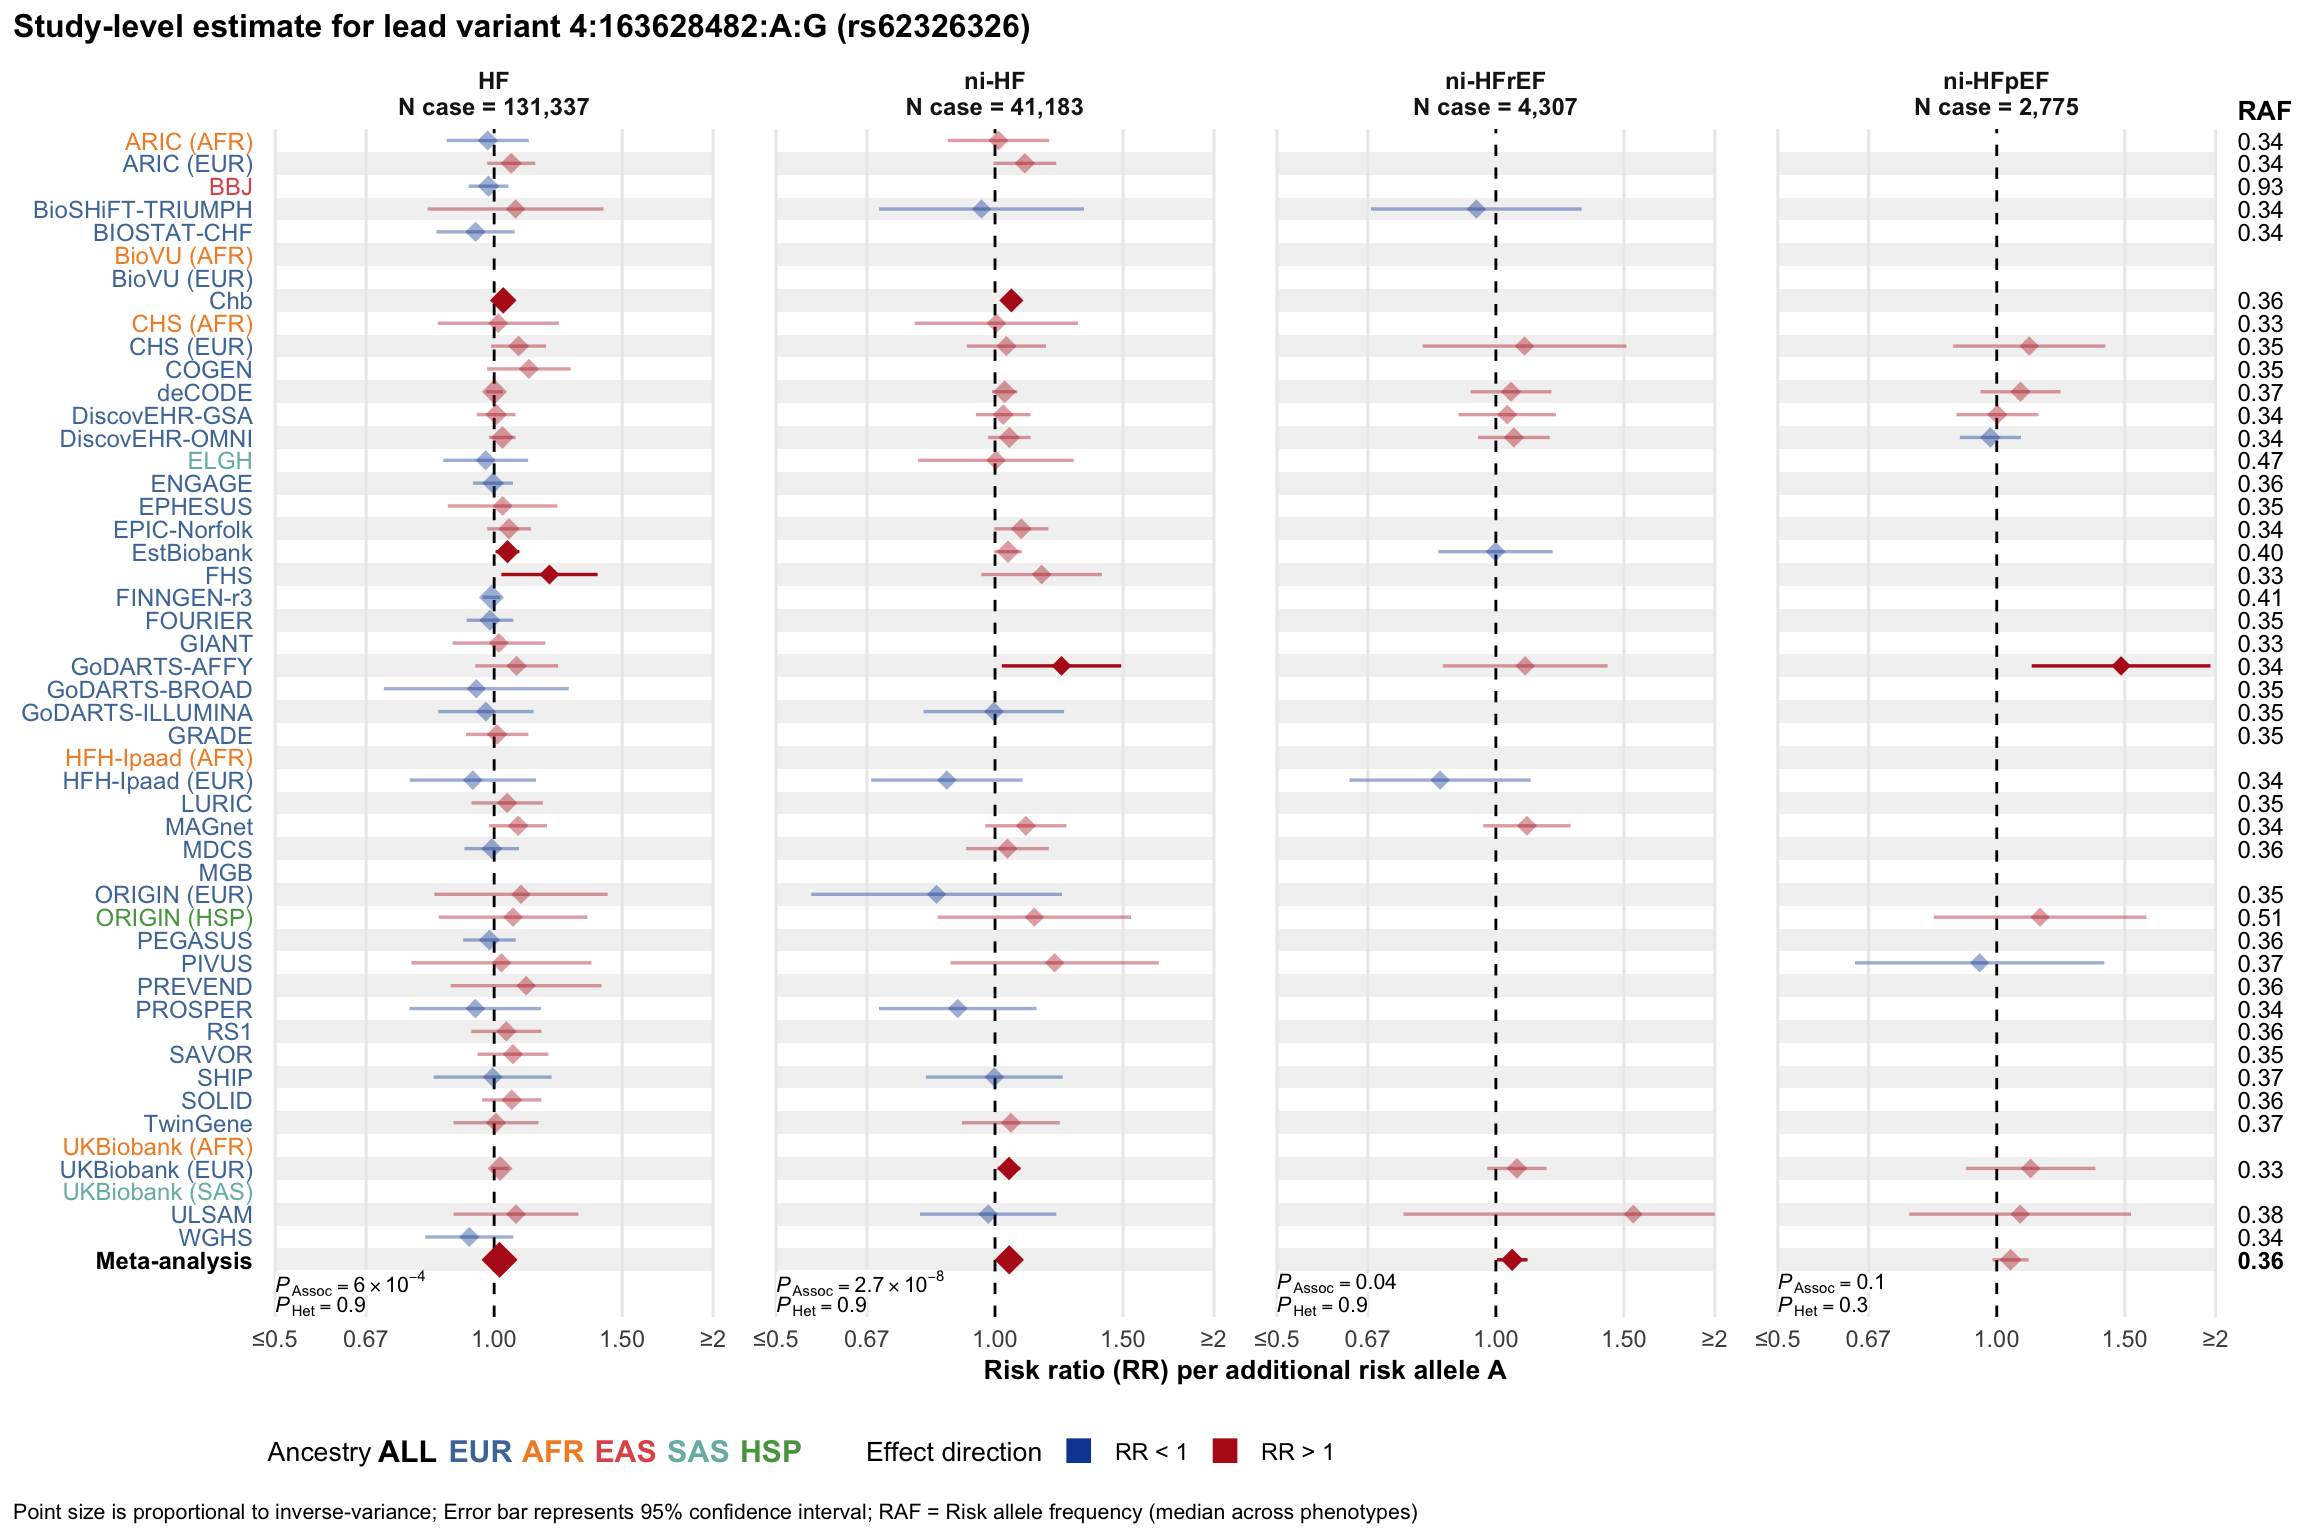
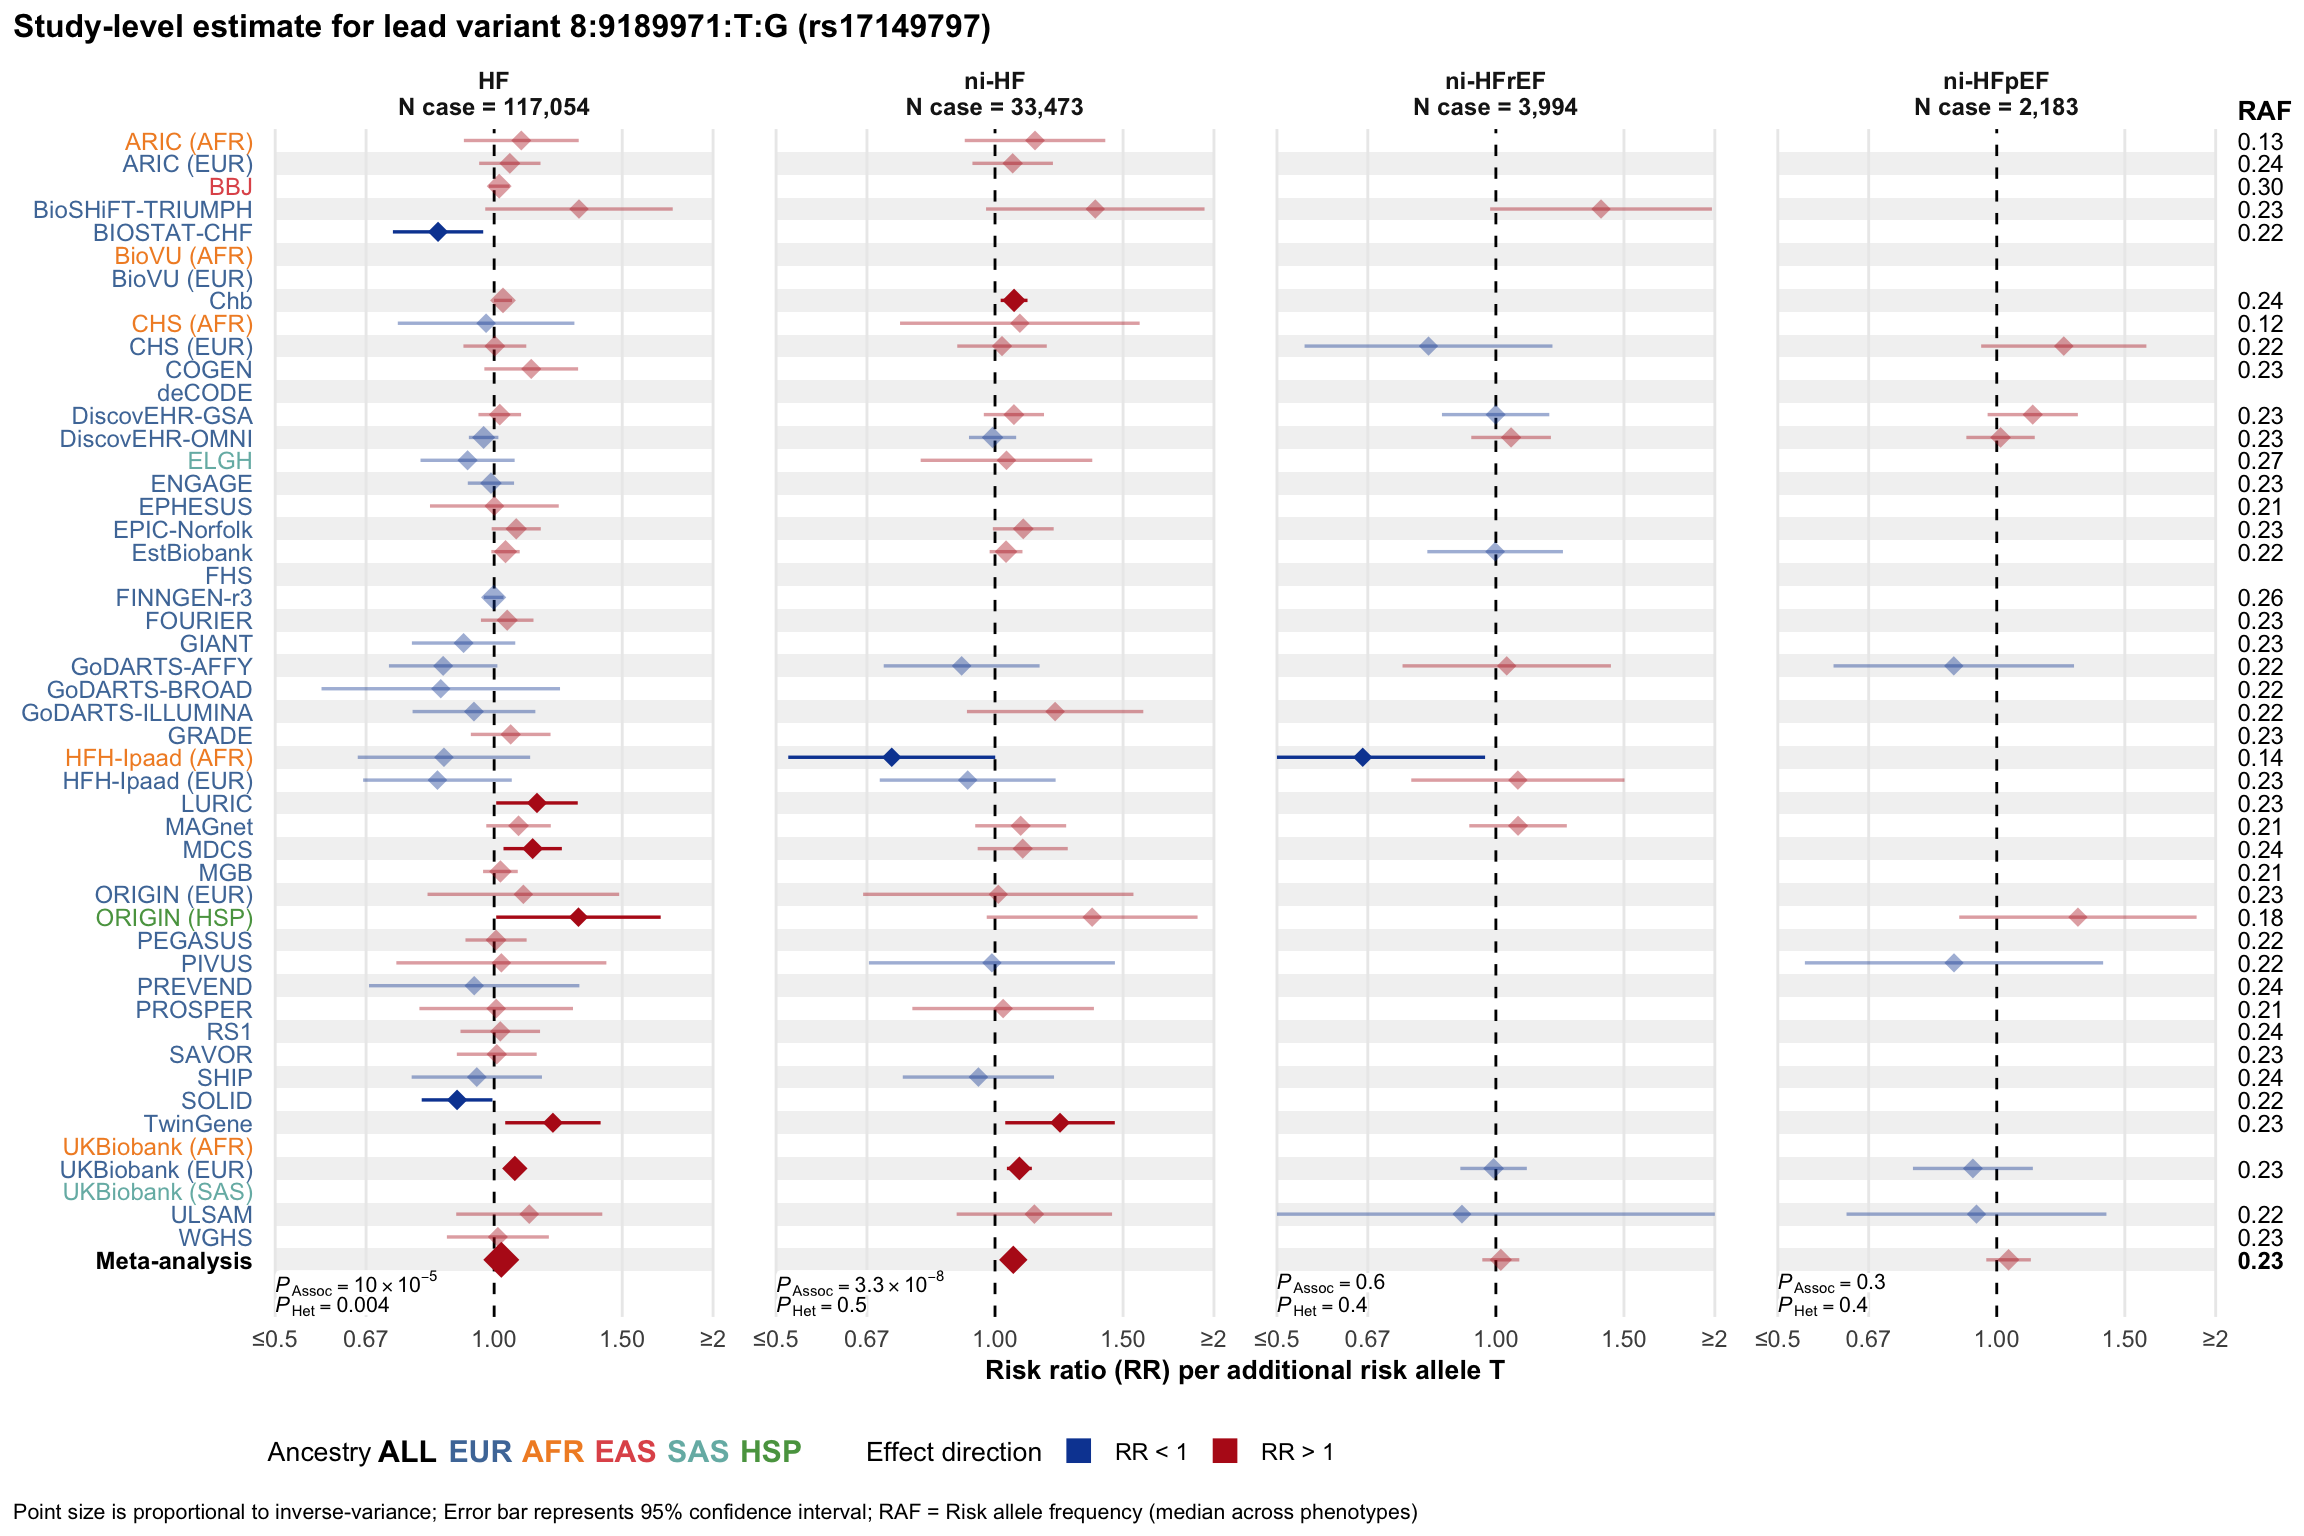
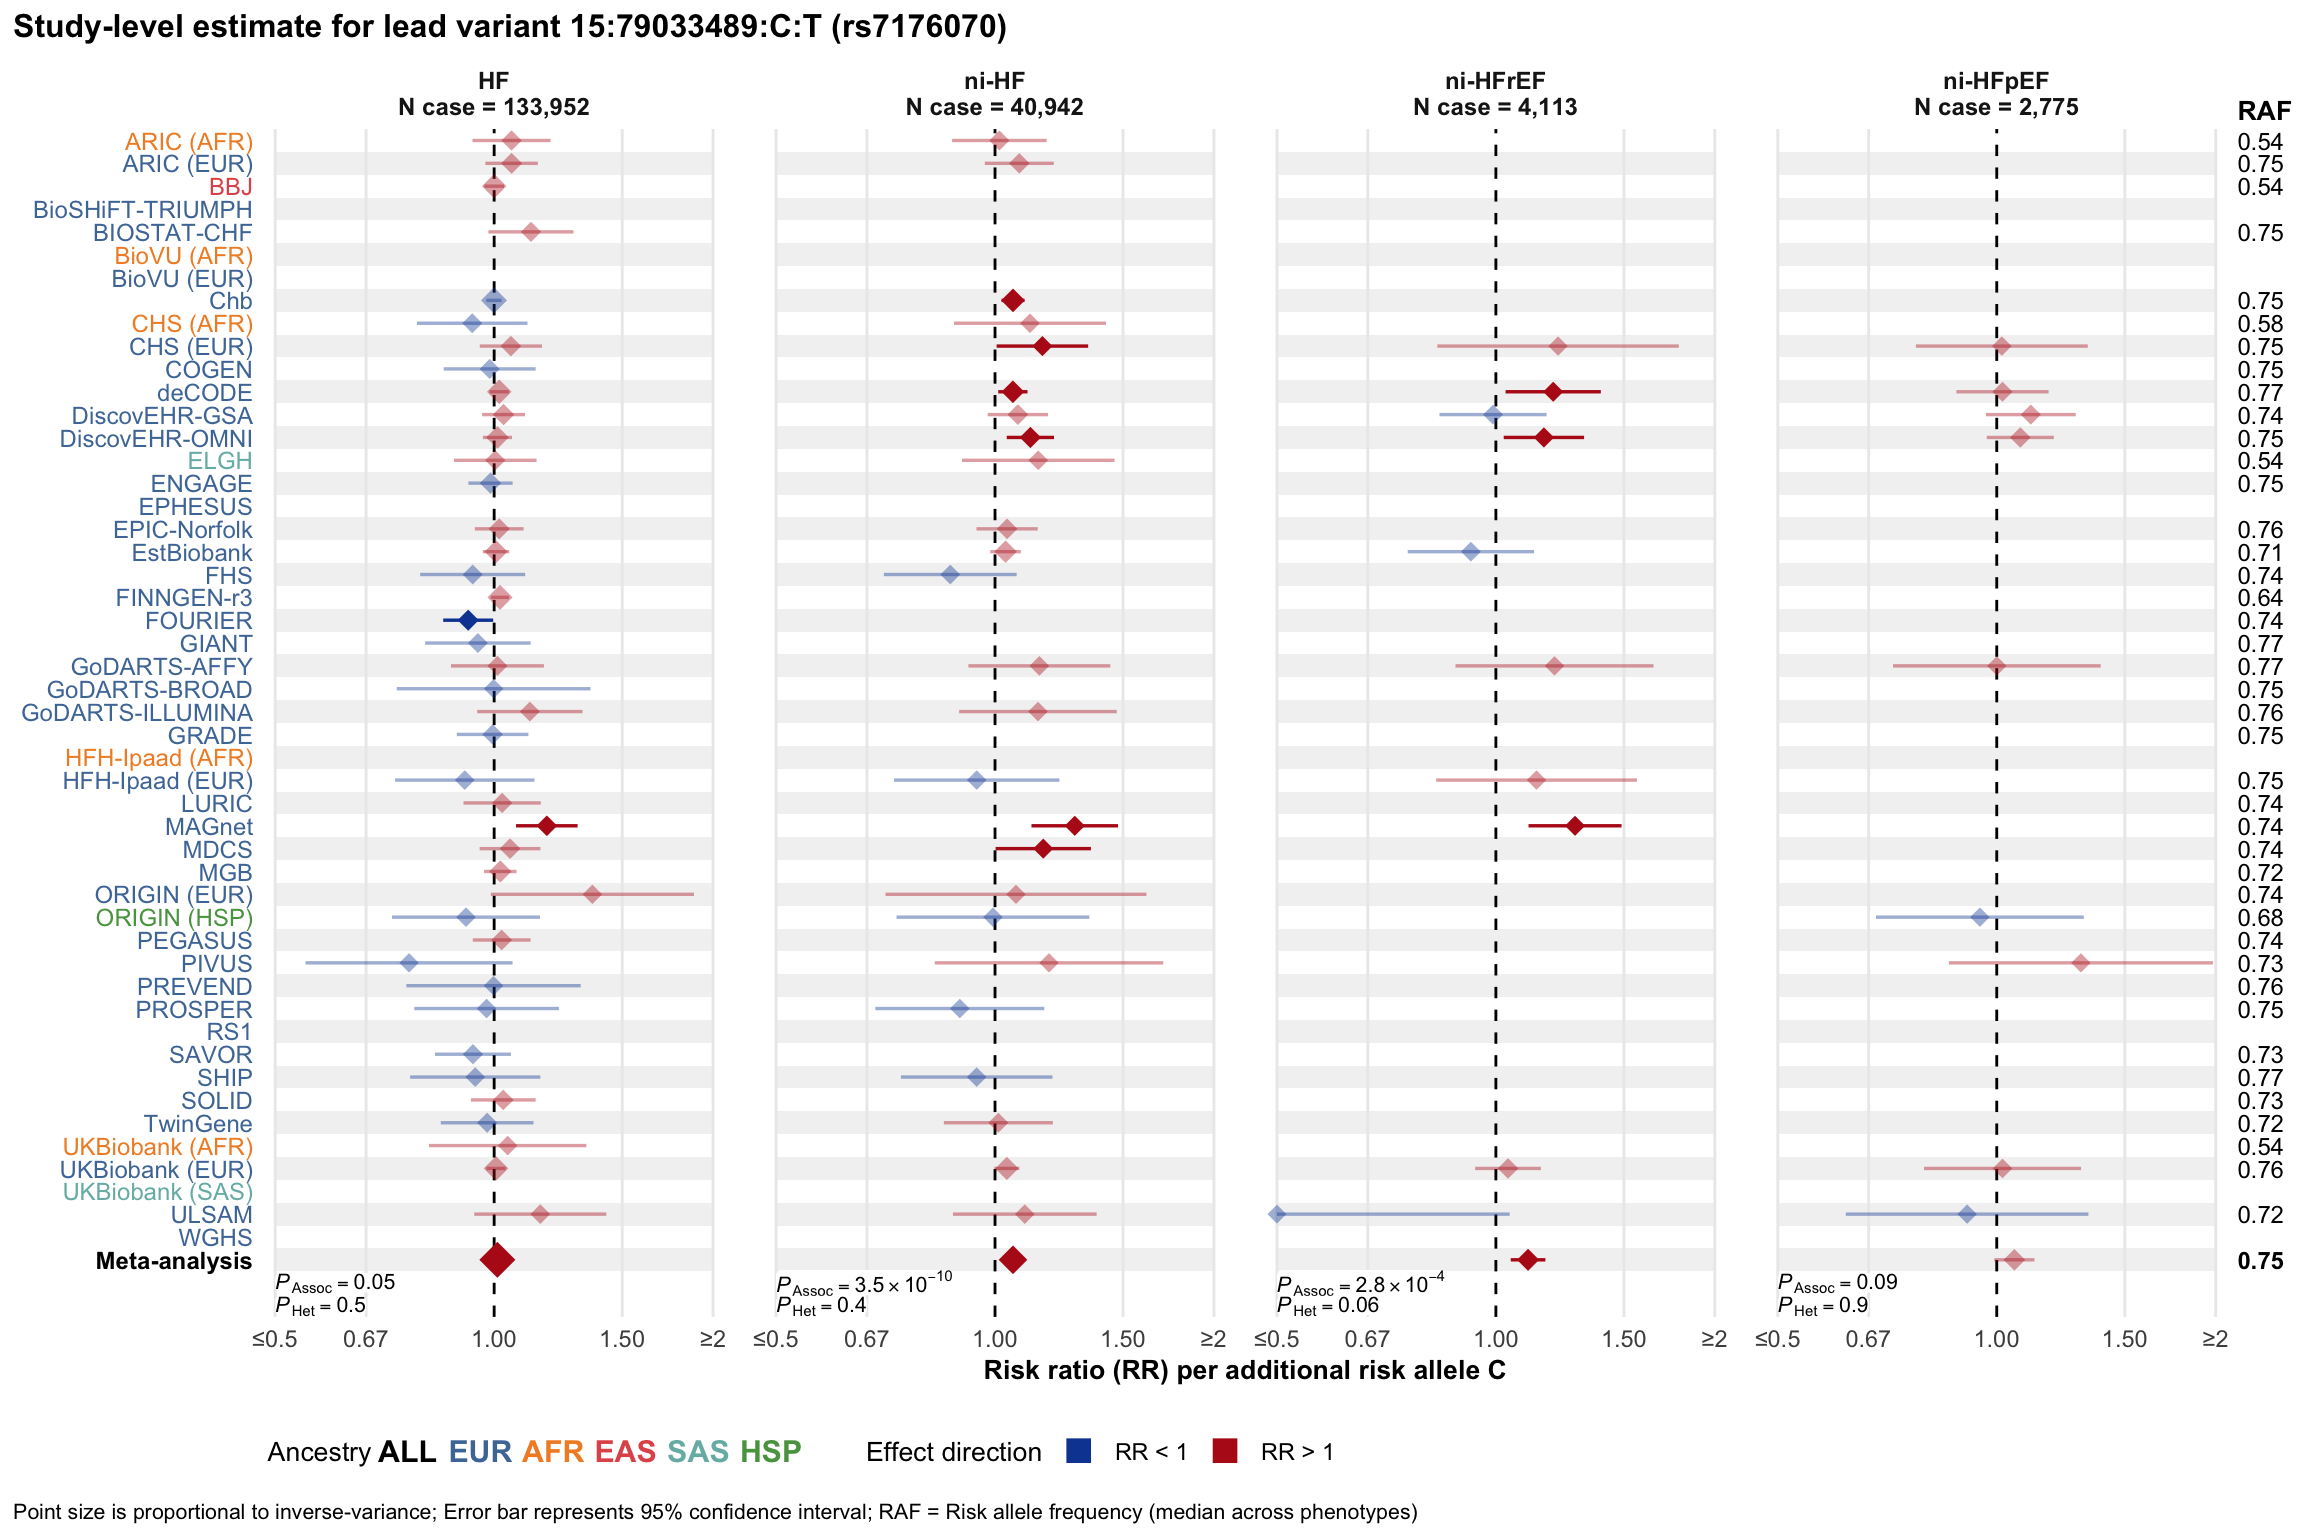
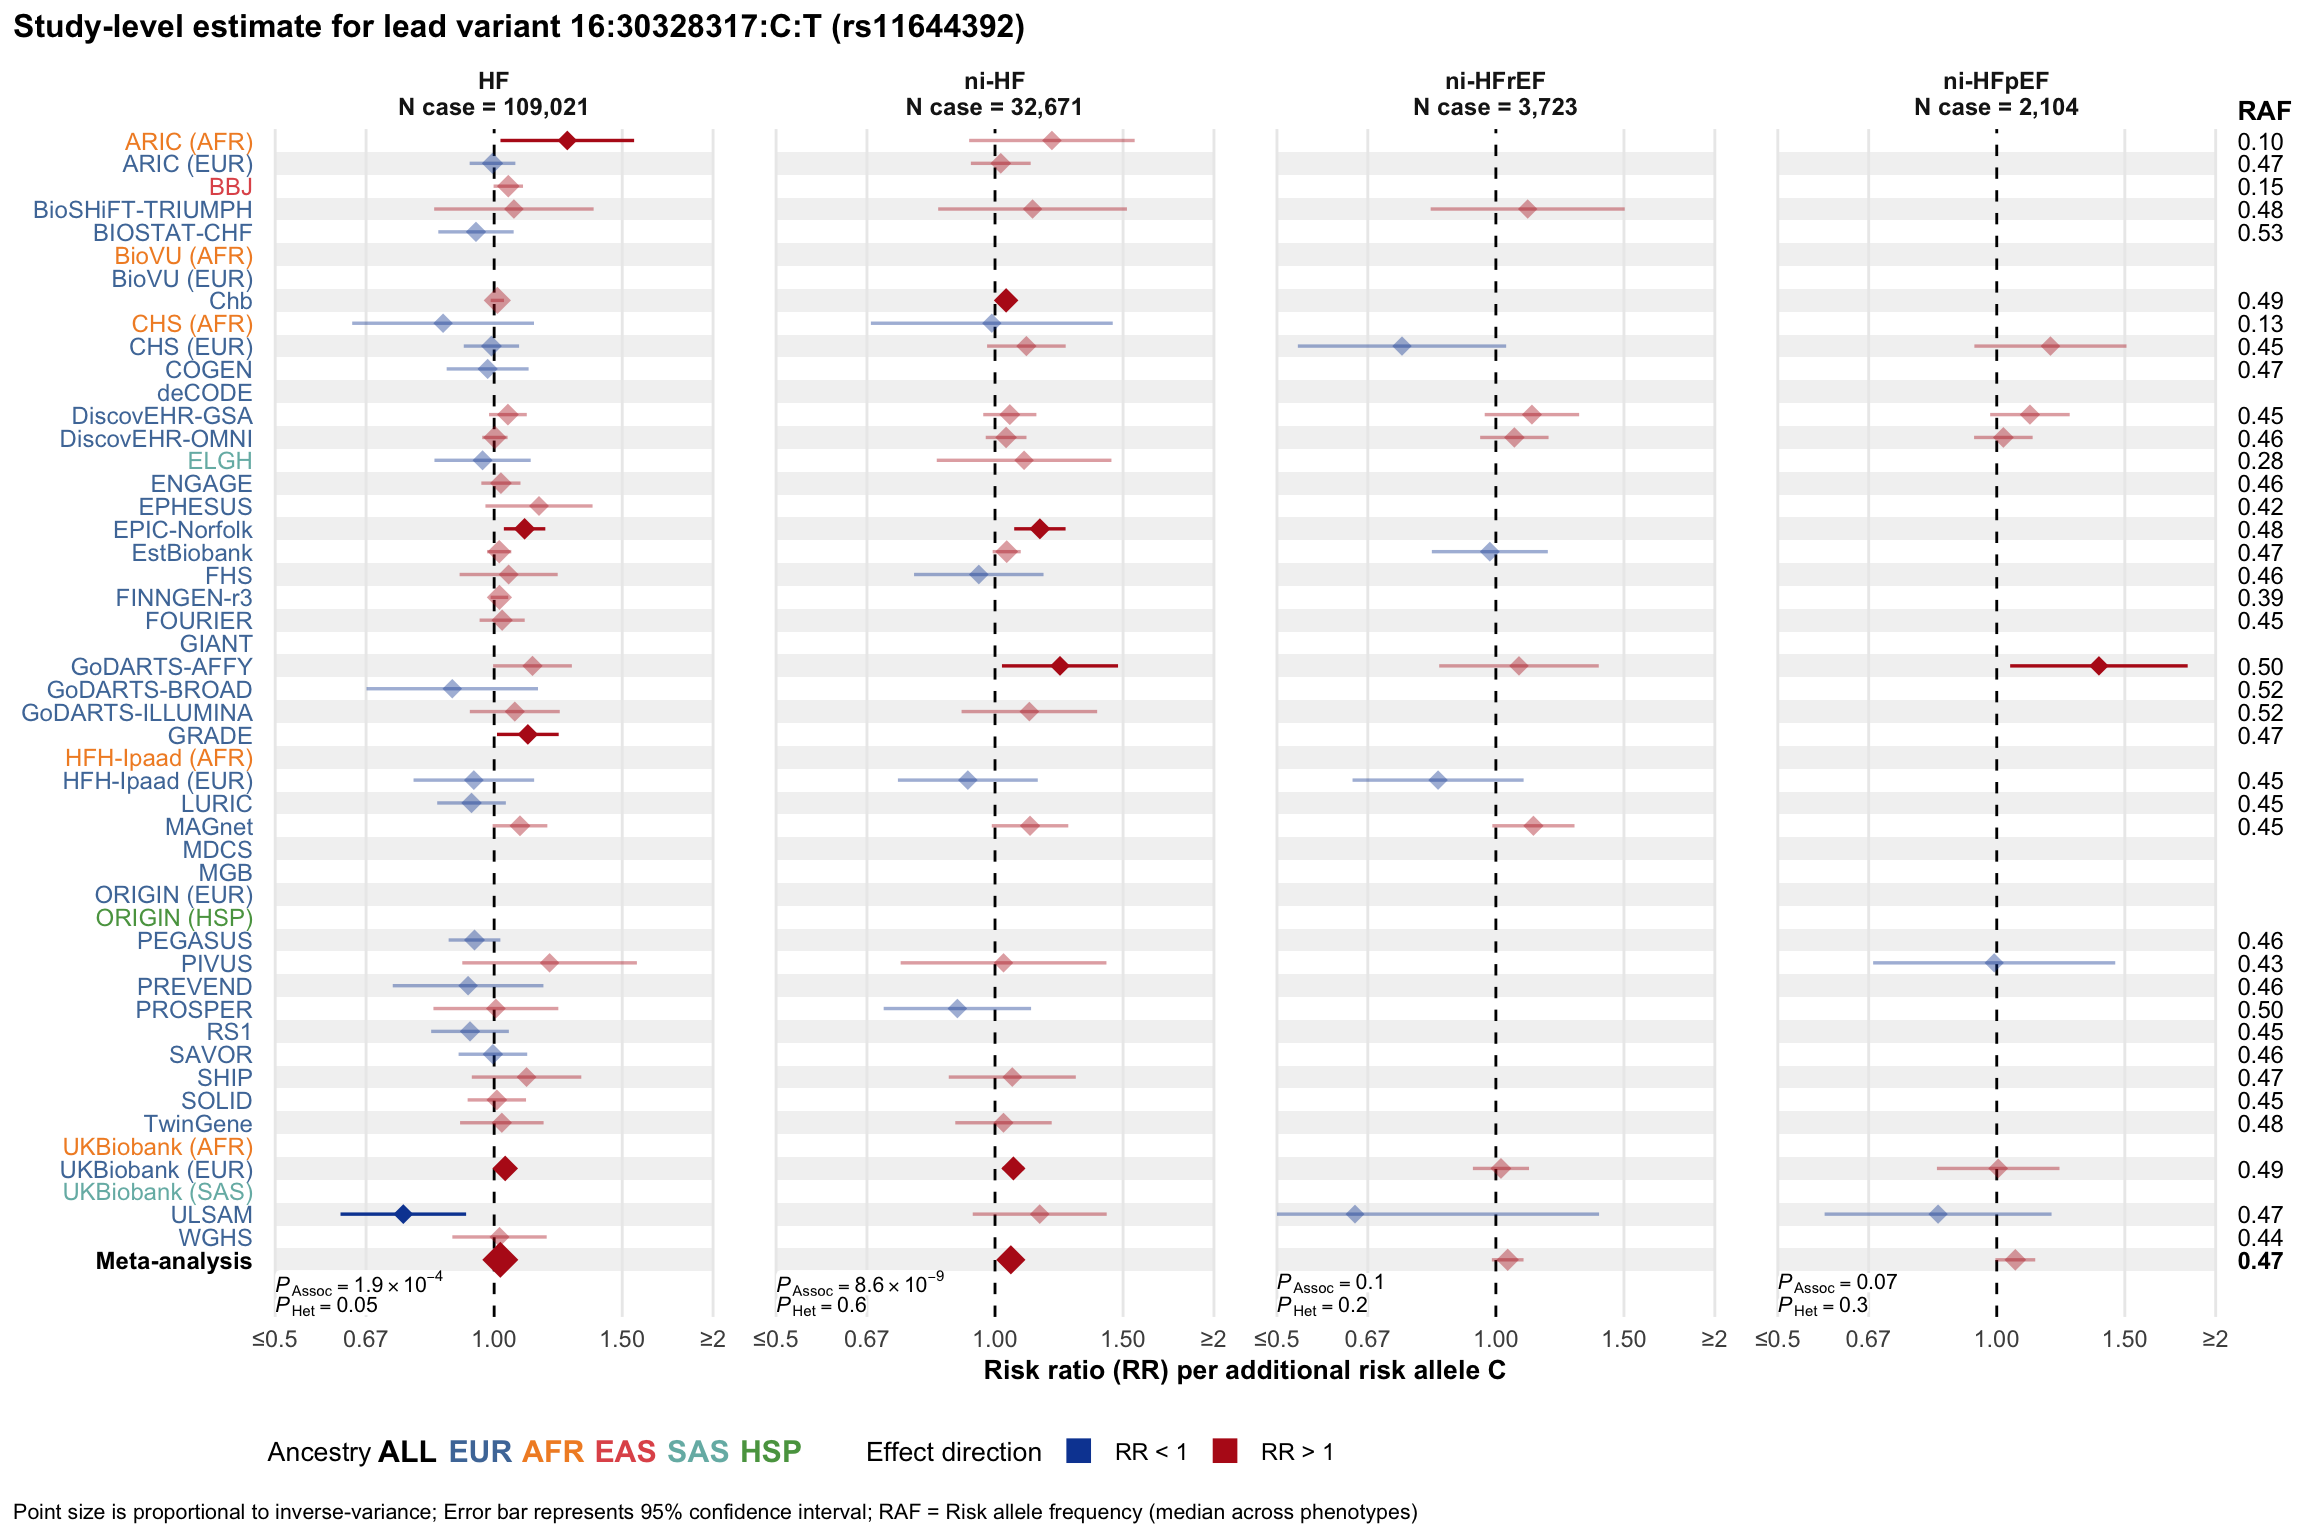
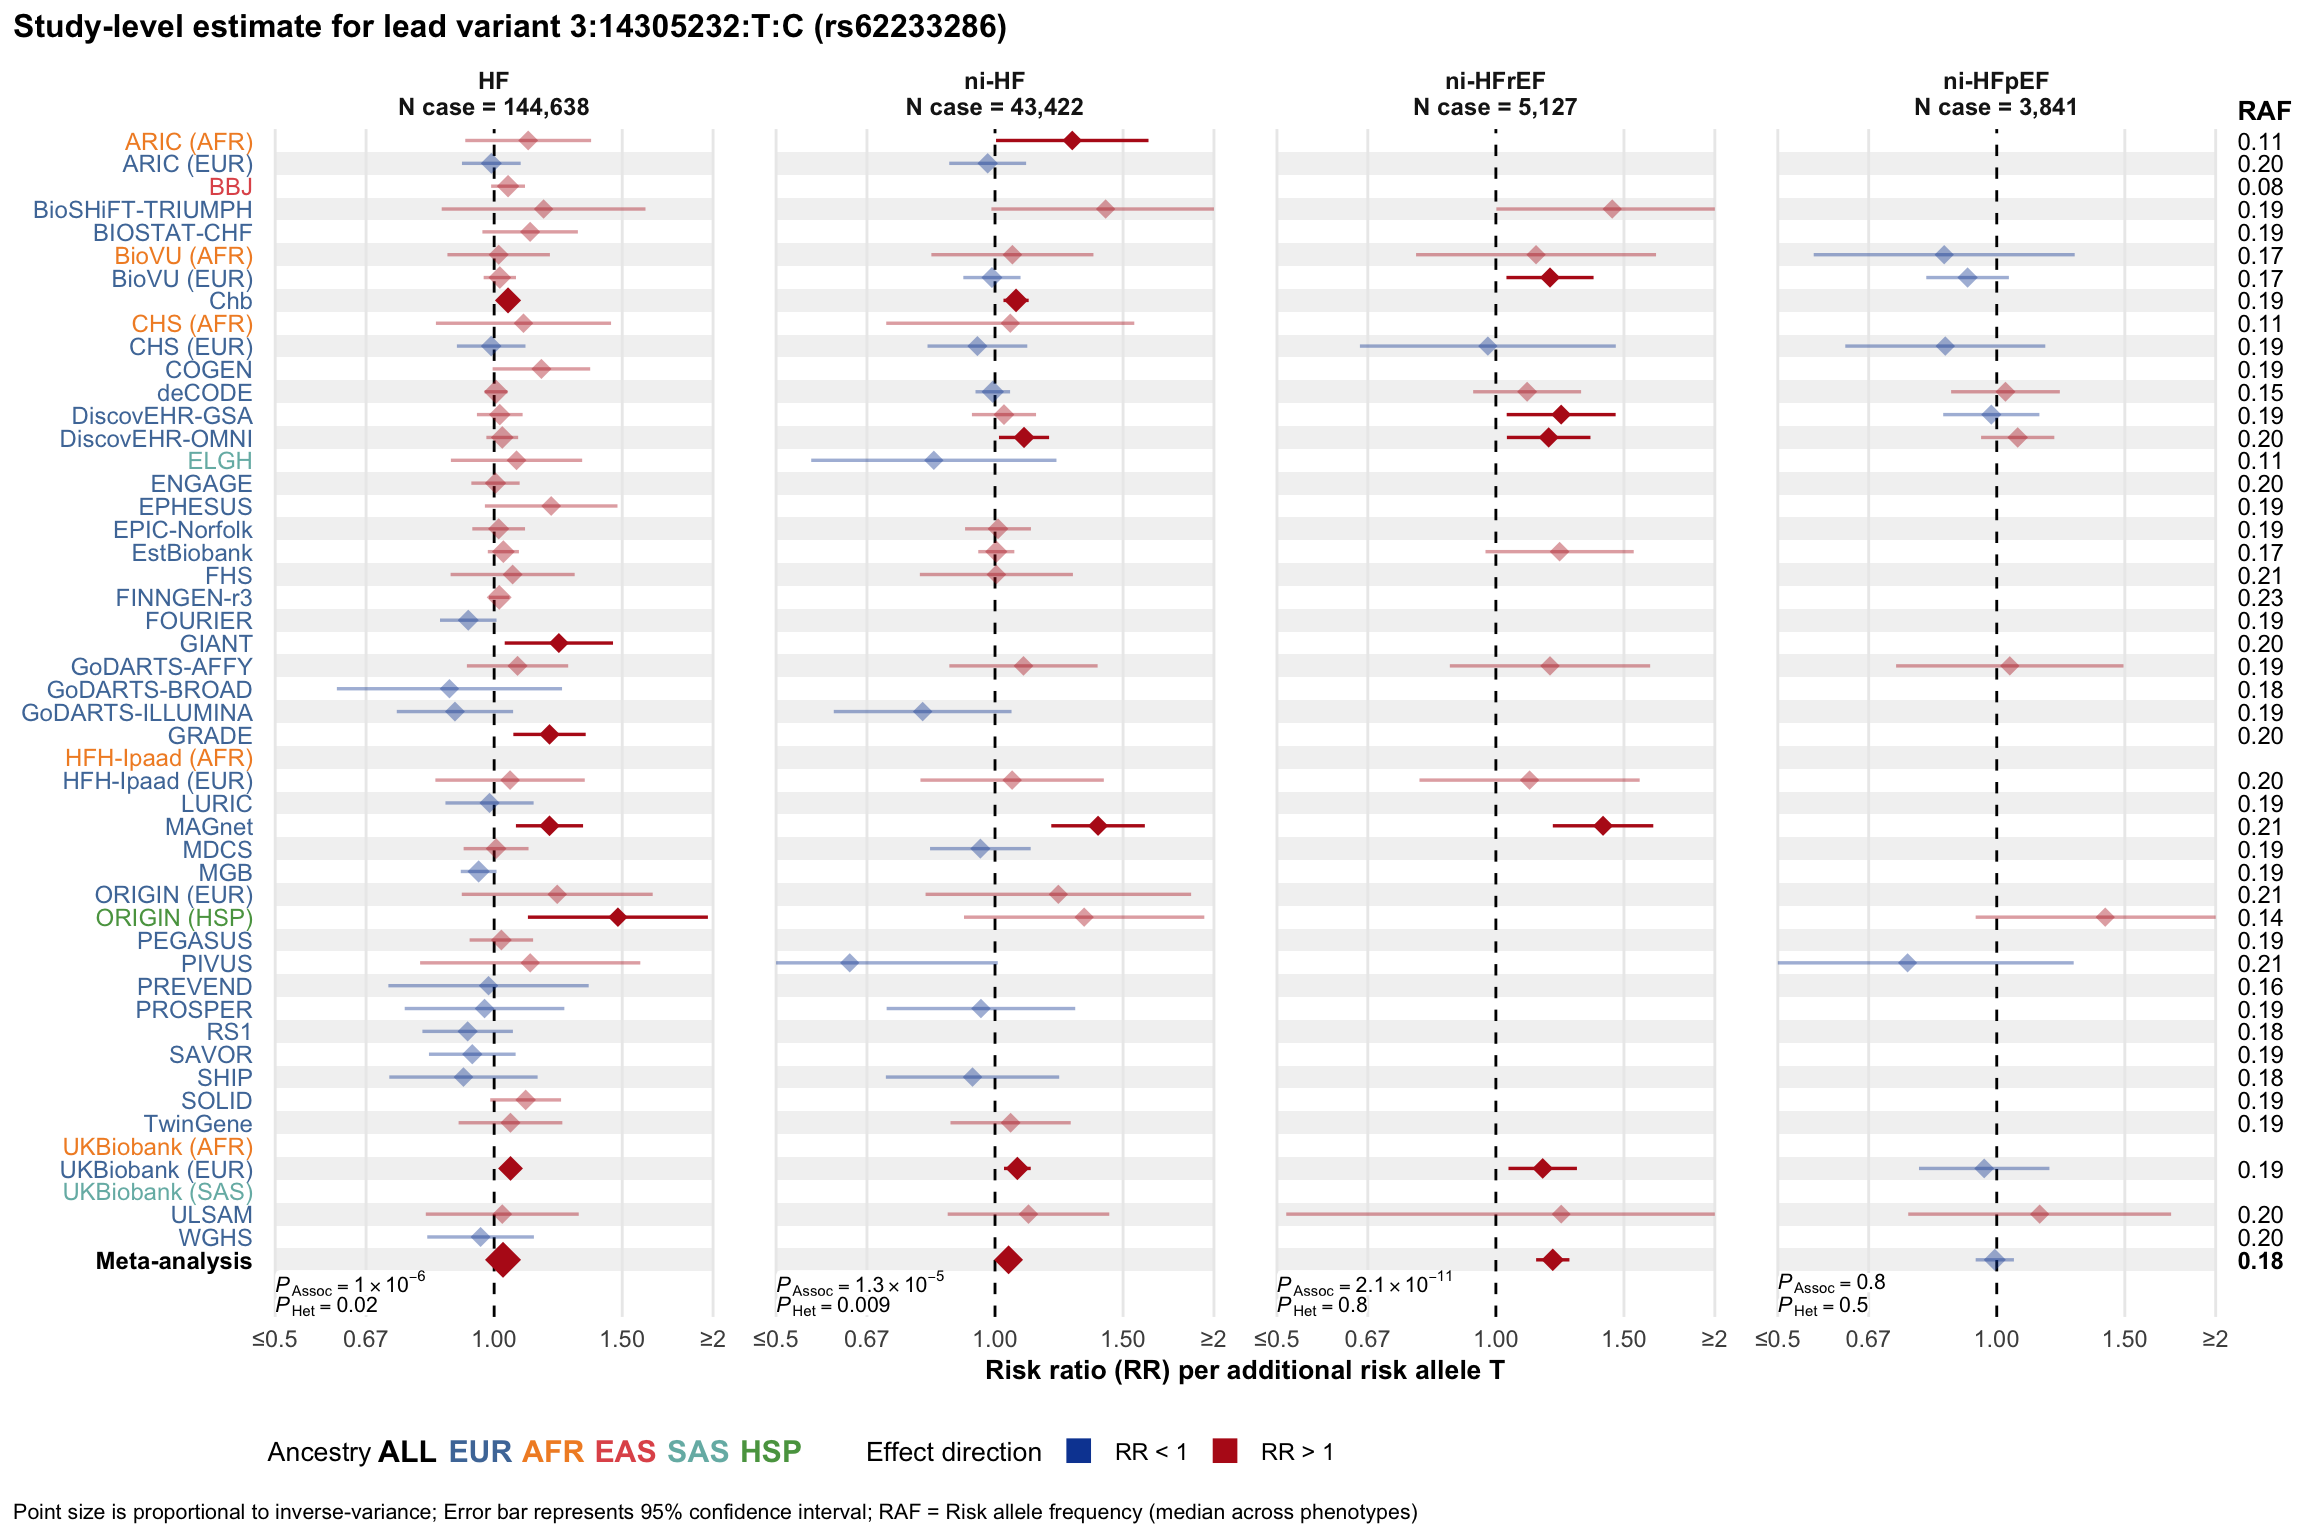
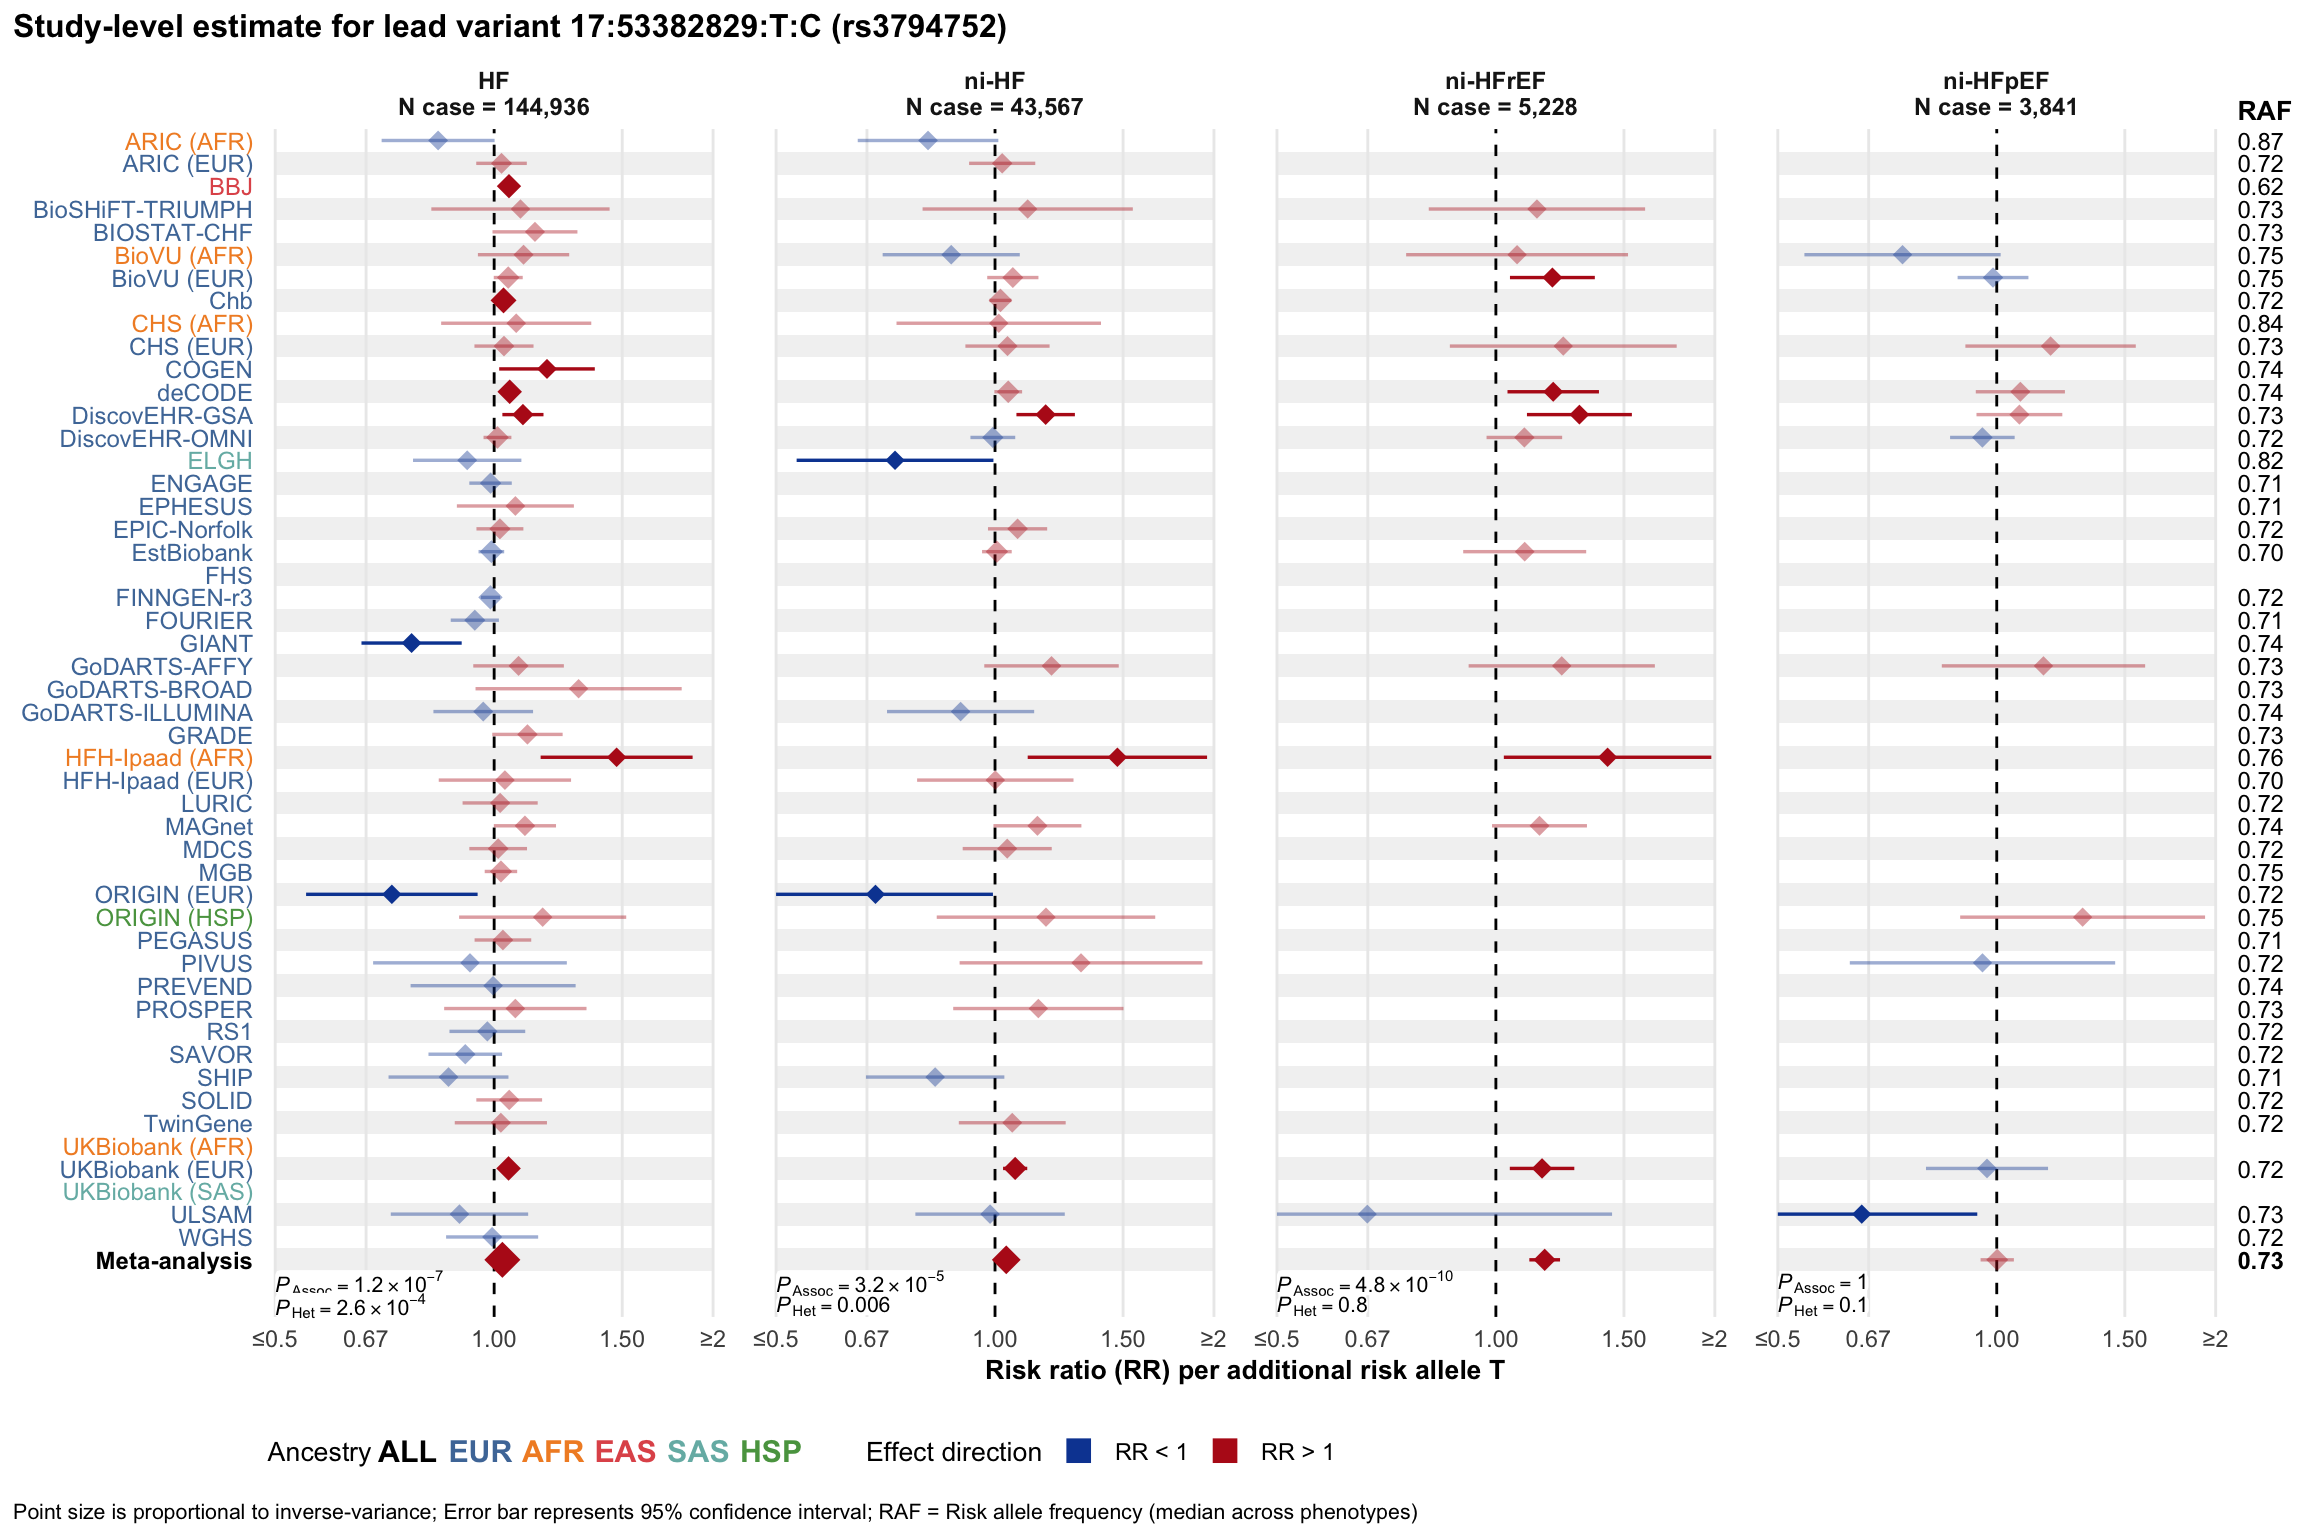
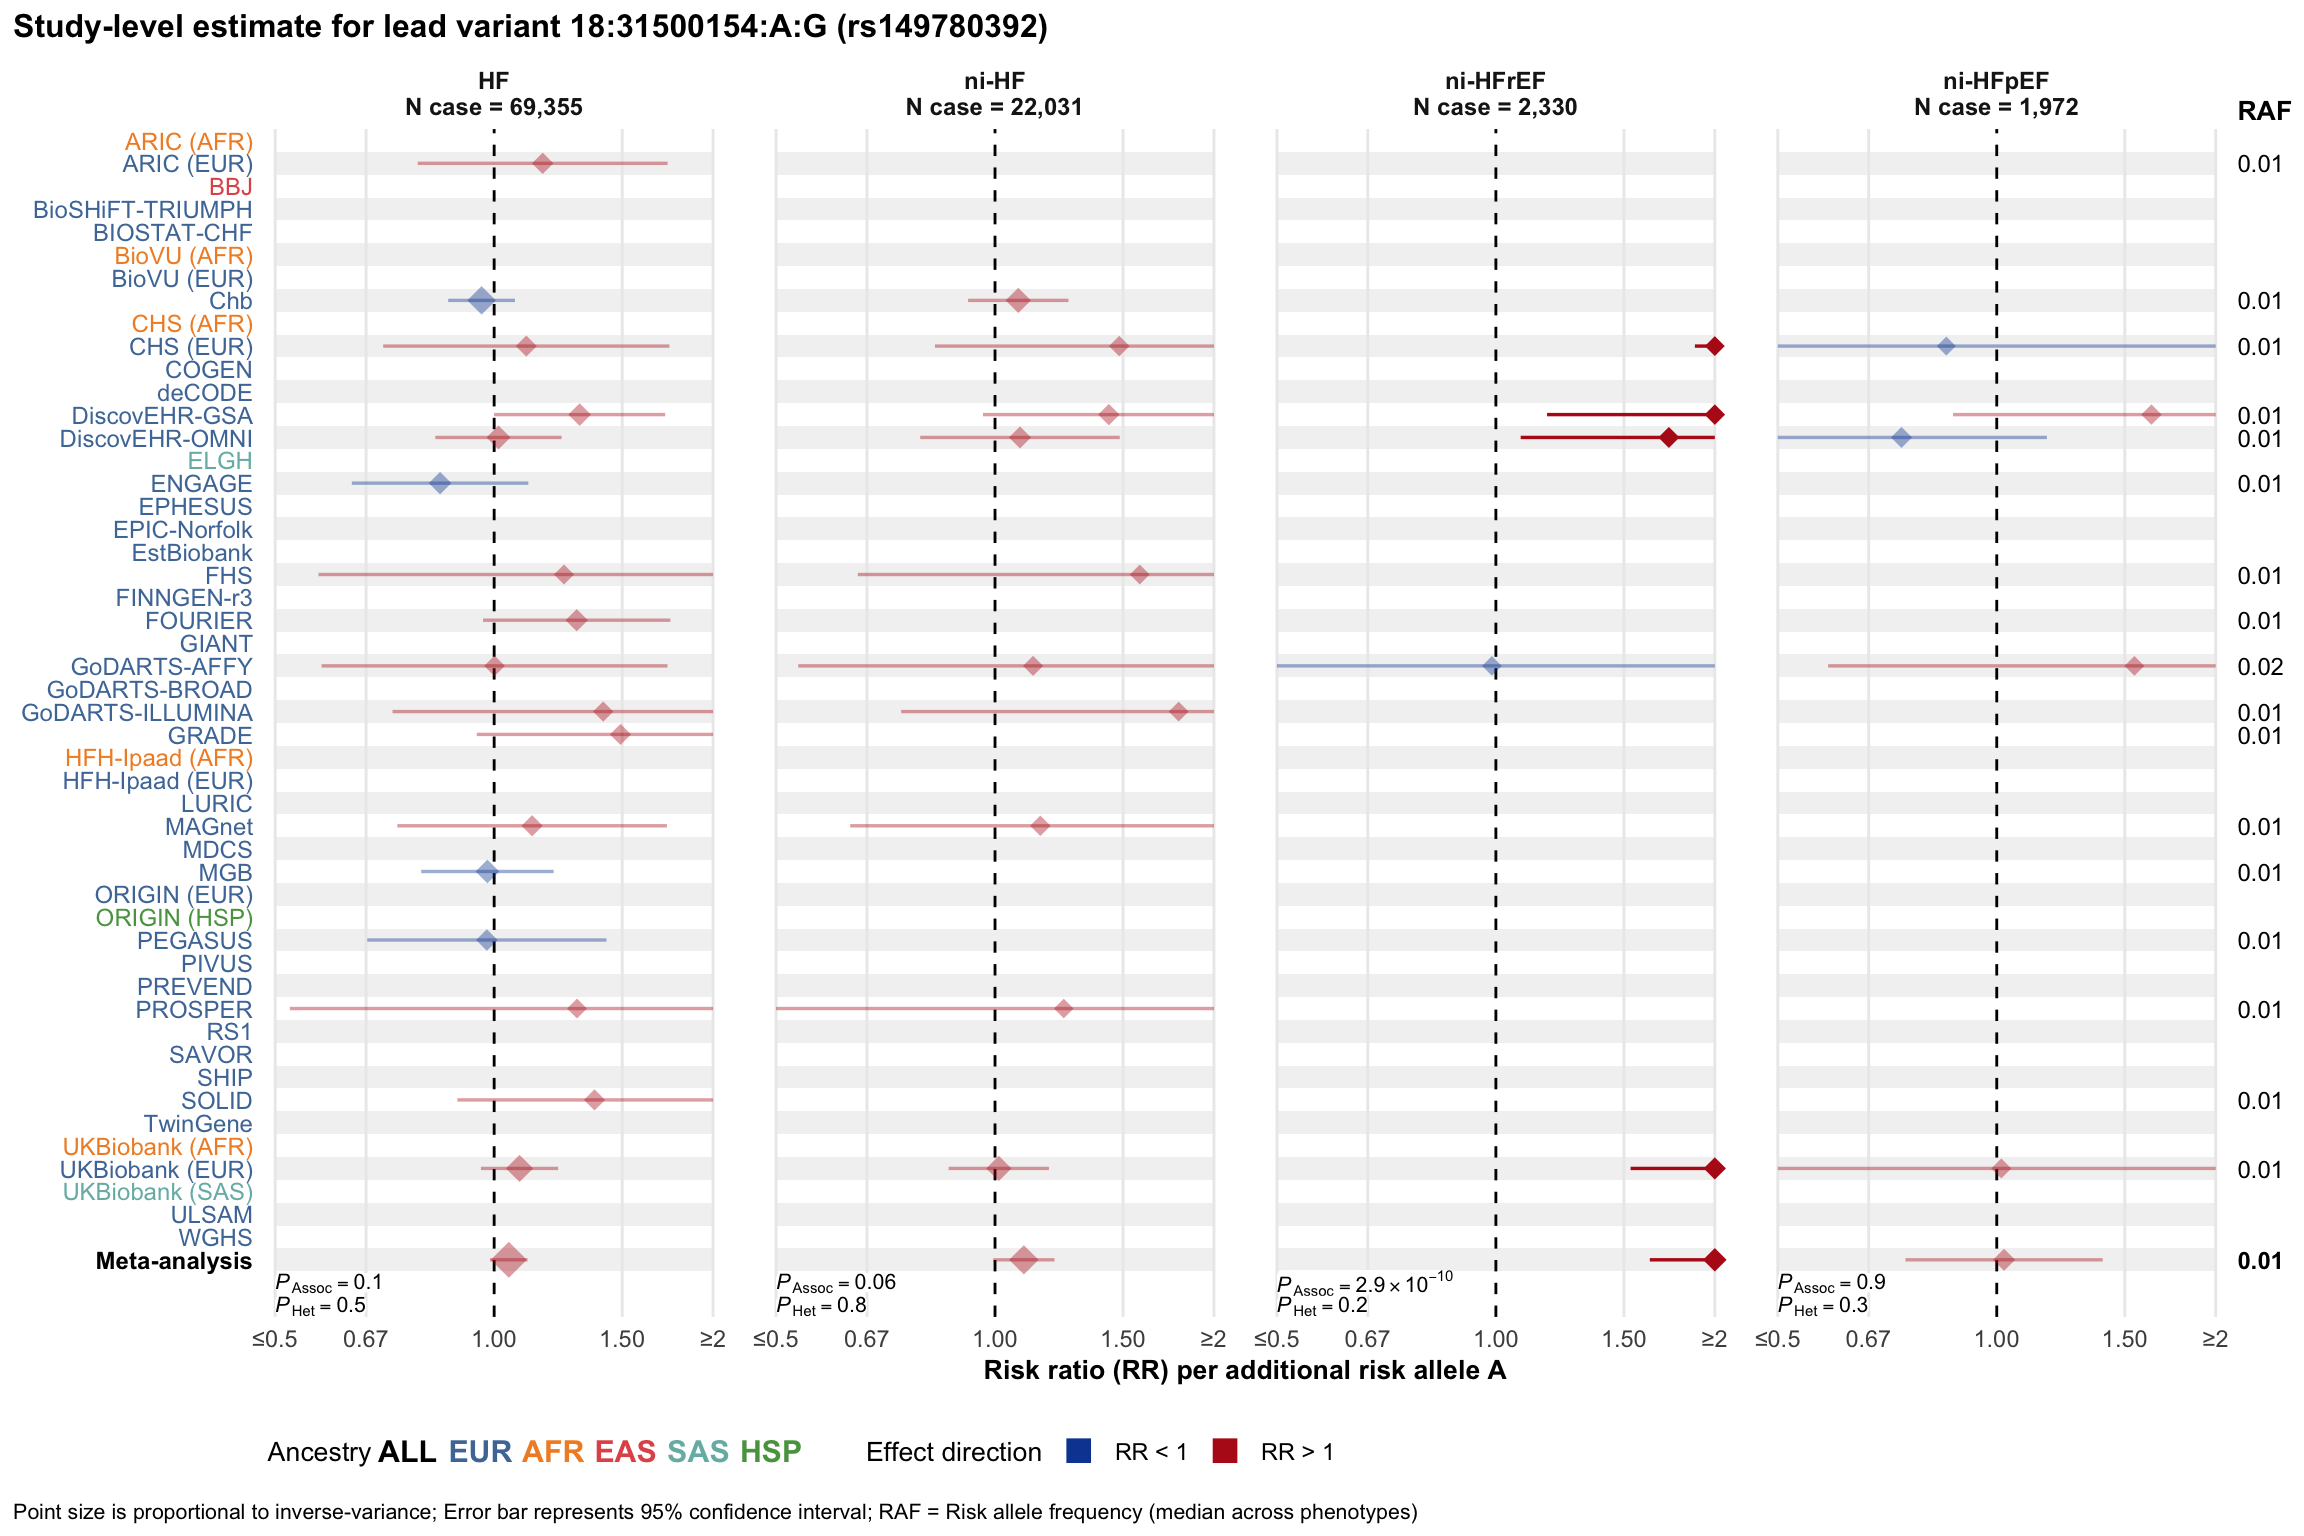
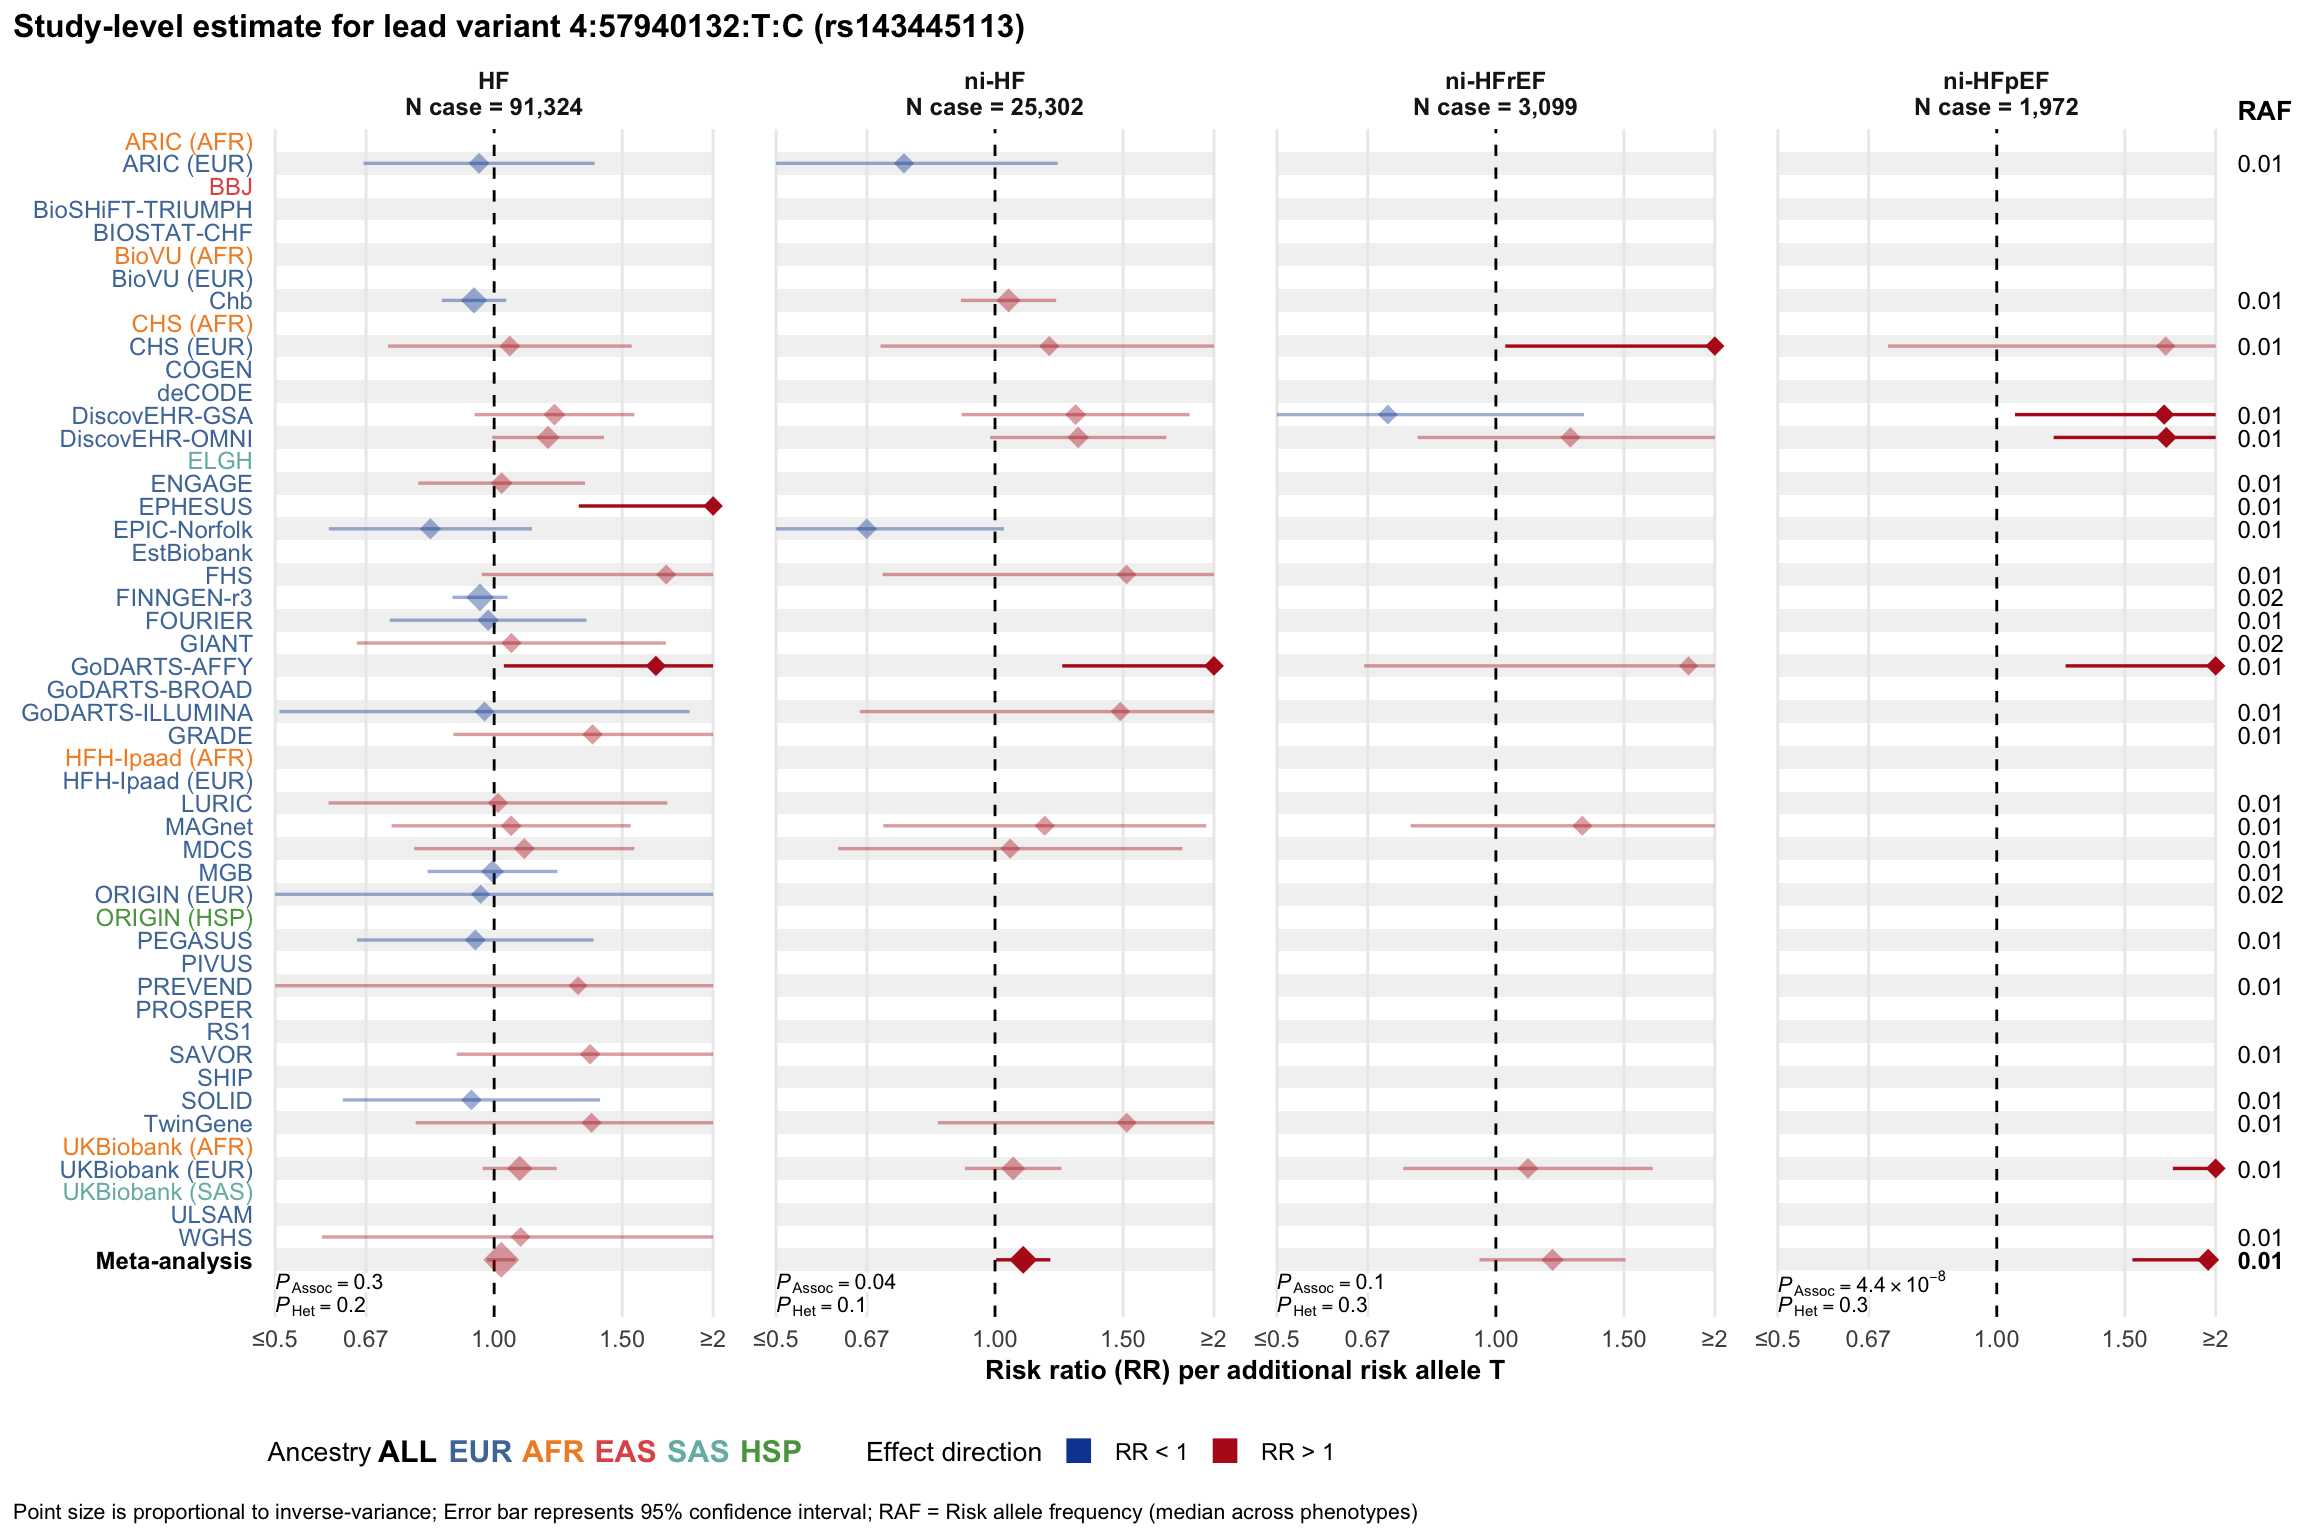
Study-level estimate
Genetic association estimates across participating cohorts for lead variant in the locus. For loci with multiple conditionally independent variants, lead variant is defined as variant with lowest joint P value for association with all-cause HF; or with one of the primary HF phenotypes for variants showing lowest P value for variants specifically associated with primary HF phenotype
2.1 Locus 1
2.2 Locus 2
2.3 Locus 3
2.4 Locus 4
2.5 Locus 5
2.6 Locus 6
2.7 Locus 7
2.8 Locus 8
2.9 Locus 9
2.10 Locus 10
2.11 Locus 11
2.12 Locus 12
2.13 Locus 13
2.14 Locus 14
2.15 Locus 15
2.16 Locus 16
2.17 Locus 17
2.18 Locus 18
2.19 Locus 19
2.20 Locus 20
2.21 Locus 21
2.22 Locus 22

2.23 Locus 23
2.24 Locus 24
2.25 Locus 25
2.26 Locus 26
2.27 Locus 27
2.28 Locus 28
2.29 Locus 29
2.30 Locus 30
2.31 Locus 31
2.32 Locus 32
2.33 Locus 33
2.34 Locus 34
2.35 Locus 35
2.36 Locus 36
2.37 Locus 37
2.38 Locus 38
2.39 Locus 39
2.40 Locus 40
2.41 Locus 41
2.42 Locus 42
2.43 Locus 43
2.44 Locus 44
2.45 Locus 45
2.46 Locus 46
2.47 Locus 47
2.48 Locus 48
2.49 Locus 49
2.50 Locus 50
2.51 Locus 51
2.52 Locus 52
2.53 Locus 53
2.54 Locus 54
2.55 Locus 55
2.56 Locus 56
2.57 Locus 57
2.58 Locus 58
2.59 Locus 59
2.60 Locus 60
2.61 Locus 61
2.62 Locus 62
2.63 Locus 63
2.64 Locus 64
2.65 Locus 65
2.66 Locus 66